| Param | Original file | Final file |
|---|---|---|
| Filename | modeM0/AS1T05_116T01_9000005682_41658cztM0_level2.fits | modeM0/AS1T05_116T01_9000005682_41658cztM0_level2_quad_clean.evt |
| Size (bytes) | 413,104,320 | 104,748,480 |
| Size | 394.0 MB | 99.9 MB |
| Events in quadrant A | 3,513,679 | 707,941 |
| Events in quadrant B | 3,109,942 | 725,256 |
| Events in quadrant C | 3,584,297 | 675,480 |
| Events in quadrant D | 4,581,475 | 612,598 |
| Mode M0 | |||
|---|---|---|---|
| Quadrant | BADHDUFLAG | Total packets | Discarded packets |
| A | 0 | 14263 | 2 |
| B | 0 | 13602 | 2 |
| C | 0 | 14591 | 2 |
| D | 0 | 18111 | 2 |
| Mode M9 | |||
|---|---|---|---|
| Quadrant | BADHDUFLAG | Total packets | Discarded packets |
| A | 0 | 32 | 0 |
| B | 0 | 32 | 0 |
| C | 0 | 32 | 0 |
| D | 0 | 32 | 0 |
| Mode SS | |||
|---|---|---|---|
| Quadrant | BADHDUFLAG | Total packets | Discarded packets |
| A | 0 | 132 | 0 |
| B | 0 | 132 | 0 |
| C | 0 | 132 | 0 |
| D | 0 | 132 | 0 |
| Quadrant | Total seconds | Saturated seconds | Saturation percentage |
|---|---|---|---|
| A | 6458 | 28 | 0.433571% |
| B | 6458 | 14 | 0.216785% |
| C | 6459 | 154 | 2.384270% |
| D | 6459 | 355 | 5.496207% |
Noise dominated data is calculated using 1-second bins in cleaned event files. If a bin has >2000 counts, and if more than 50% of those come from <1% of pixels, then it is considered to be noise-dominated and hence unusable.
| Quadrant | # 1 sec bins | Bins with >0 counts | Bins with >2000 counts | High rate bins dominated by noise | Noise dominated (total time) | Noise dominated (detector-on time) | Marked lightcurve |
|---|---|---|---|---|---|---|---|
| A | 9625 | 6460 | 15 | 15 | 0.16% | 0.23% | 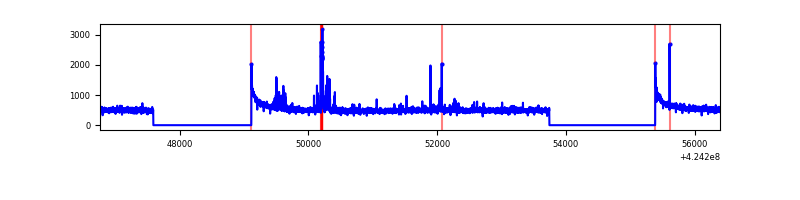 |
| B | 9625 | 6460 | 1 | 1 | 0.01% | 0.02% | 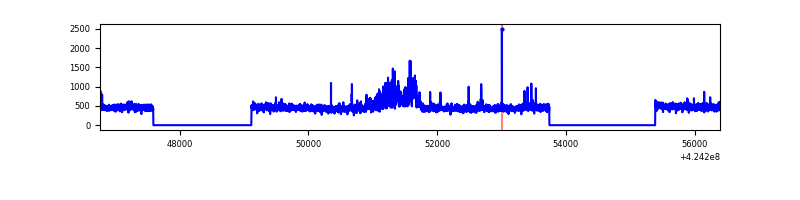 |
| C | 9626 | 6461 | 137 | 137 | 1.42% | 2.12% | 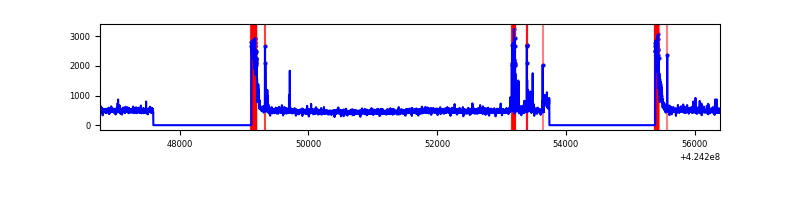 |
| D | 9626 | 6461 | 302 | 302 | 3.14% | 4.67% | 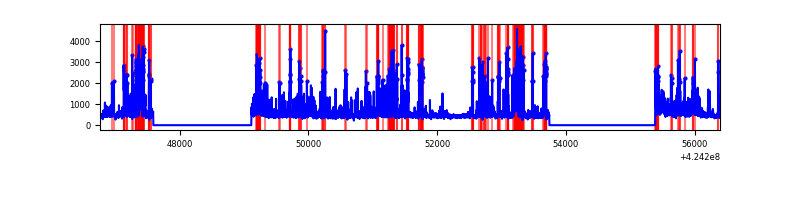 |
Top three noisy pixels from each quadrant. If the there are fewer than three noisy pixels in the level2.evt file, extra rows are filled as -1
| Pixel properties | Quadrant properties | ||||||
|---|---|---|---|---|---|---|---|
| Quadrant | DetID | PixID | Counts | Sigma | Mean | Median | Sigma |
| A | 10 | 83 | 593144 | 4025.57 | 717 | 701 | 147.2 |
| A | 13 | 248 | 130287 | 880.52 | 717 | 701 | 147.2 |
| A | 2 | 79 | 14273 | 92.22 | 717 | 701 | 147.2 |
| B | 0 | 186 | 120932 | 871.1 | 712 | 692 | 138.0 |
| B | 7 | 202 | 113719 | 818.85 | 712 | 692 | 138.0 |
| B | 0 | 190 | 31222 | 221.18 | 712 | 692 | 138.0 |
| C | 0 | 10 | 405433 | 2495.58 | 695 | 698 | 162.2 |
| C | 15 | 214 | 264145 | 1624.41 | 695 | 698 | 162.2 |
| C | 4 | 254 | 111689 | 684.37 | 695 | 698 | 162.2 |
| D | 13 | 249 | 1295123 | 7732.75 | 685 | 667 | 167.4 |
| D | 2 | 120 | 278994 | 1662.65 | 685 | 667 | 167.4 |
| D | 2 | 249 | 202729 | 1207.07 | 685 | 667 | 167.4 |
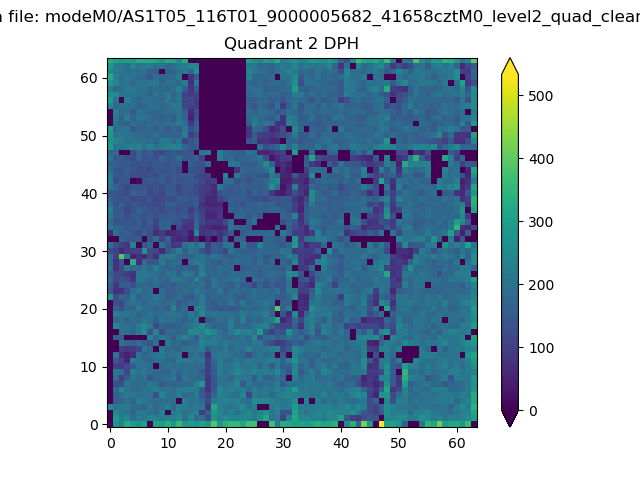
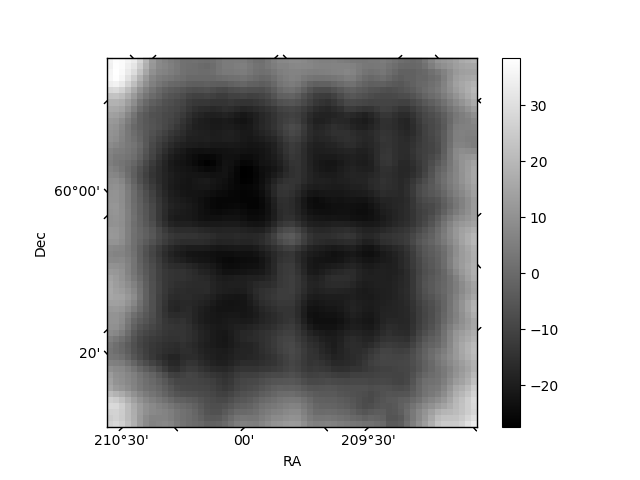
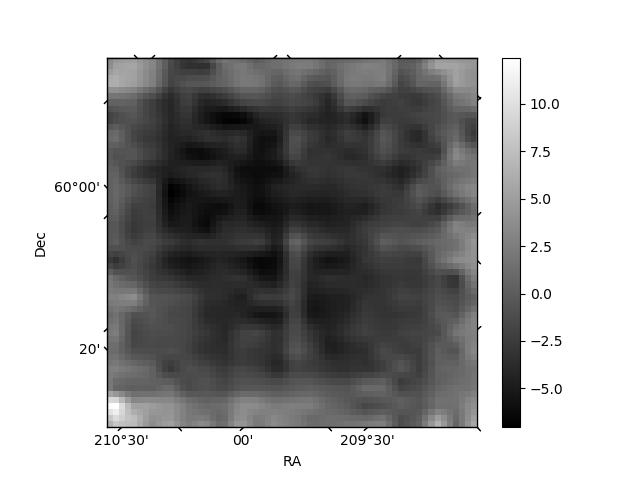
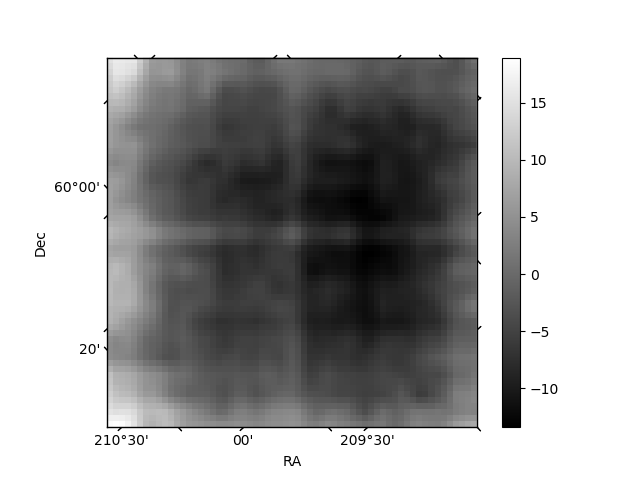
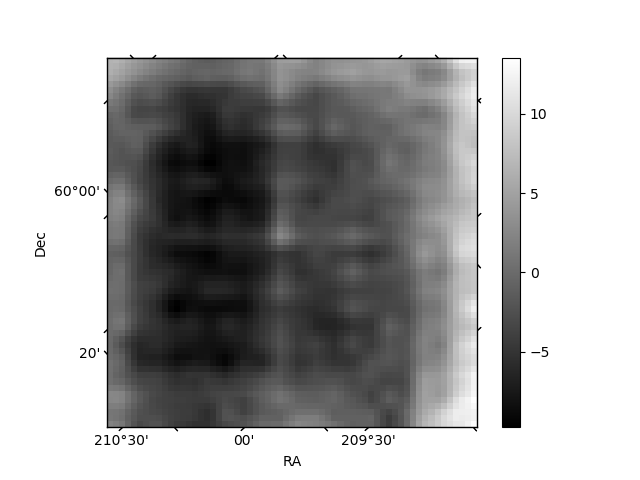
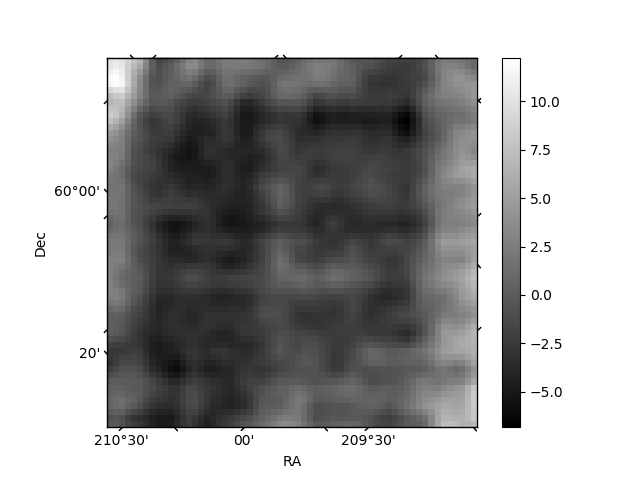
Histogram calculated using DETX and DETY for each event in the final _common_clean file
| Quadrant A | 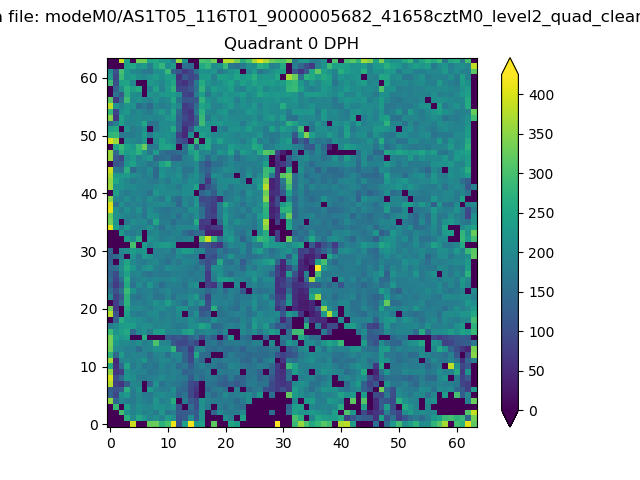 |
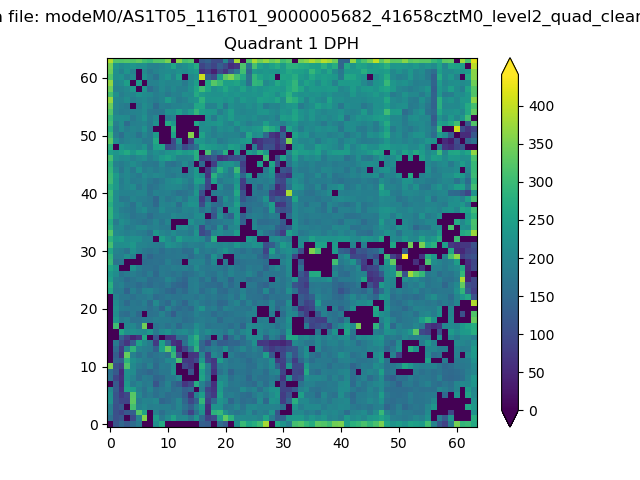 |
Quadrant B |
|---|---|---|---|
| Quadrant D | 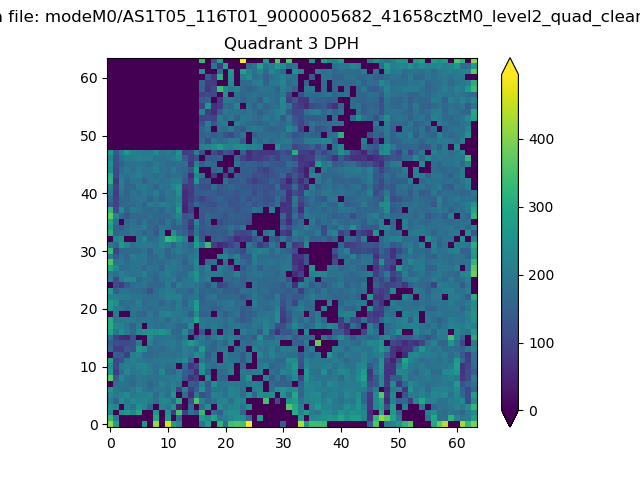 |
 |
Quadrant C |
| Plot type | Count rate plots | Images |
|---|---|---|
| Comparison with Poisson distribution Blue bars denote a histogram of data divided into 1 sec bins. Red curve is a Poisson curve with rate = median count rate of data. |
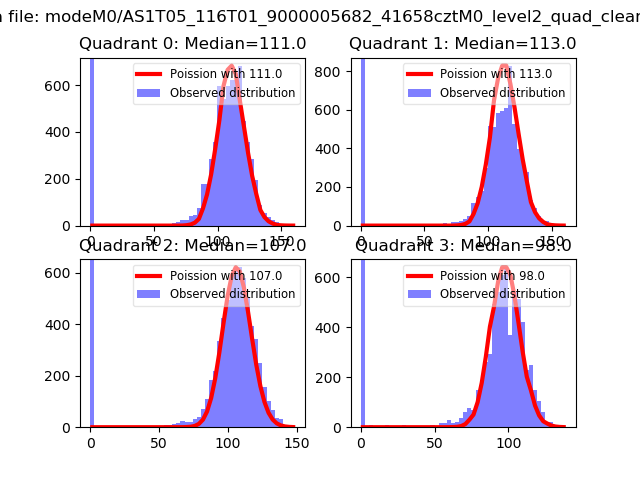 |
 |
| Quadrant-wise count rates Data is divided into 100 sec bins |
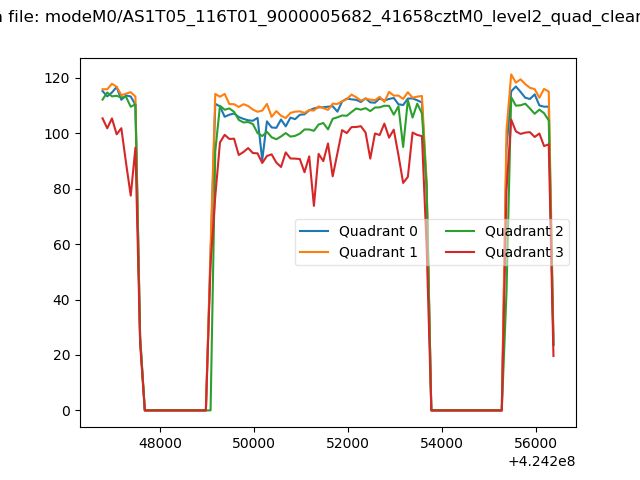 |
|
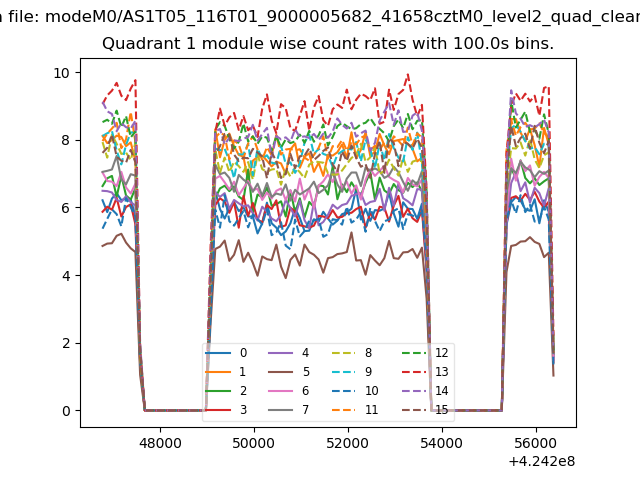
| Module-wise count rates for Quadrant A Data is divided into 100 sec bins |
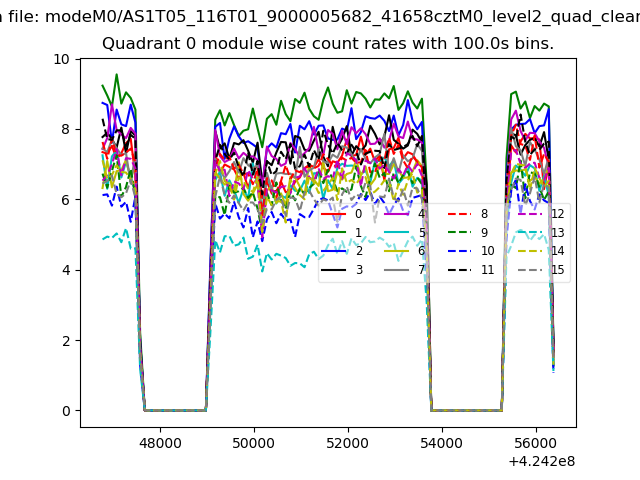 |
 |
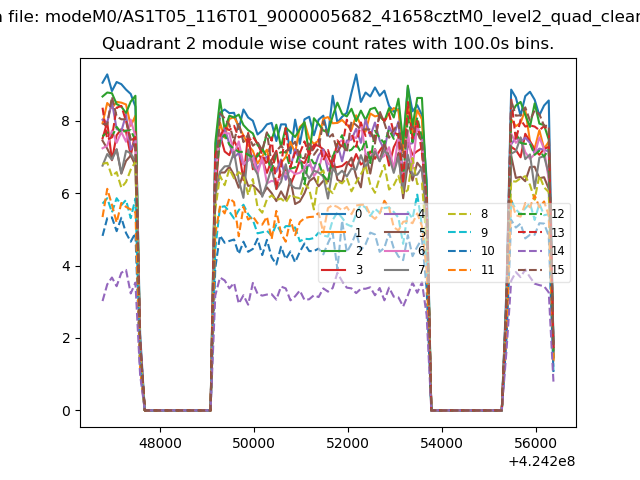
| Module-wise count rates for Quadrant B Data is divided into 100 sec bins |
 |
 |
| Module-wise count rates for Quadrant C Data is divided into 100 sec bins |
 |
 |
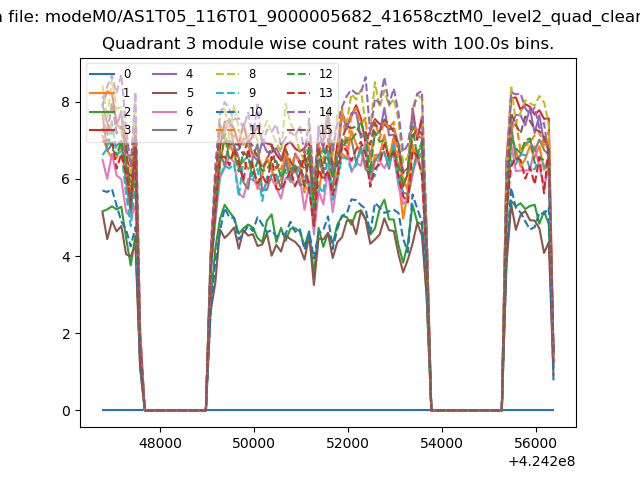
| Module-wise count rates for Quadrant D Data is divided into 100 sec bins |
 |
 |
| Parameter | Plot |
|---|---|
| CZT HV Monitor | 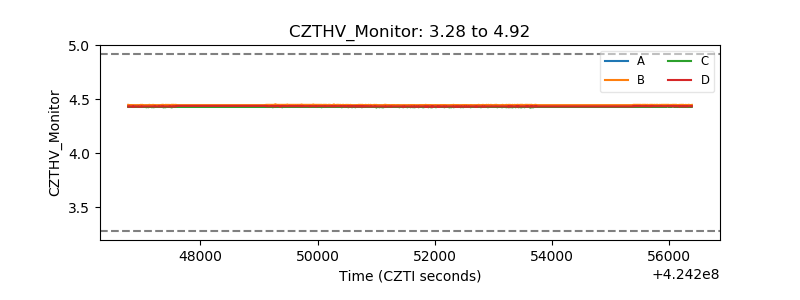 |
| D_VDD | 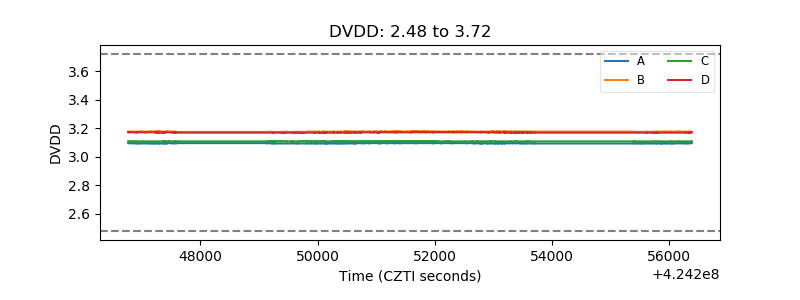 |
| Temperature 1 | 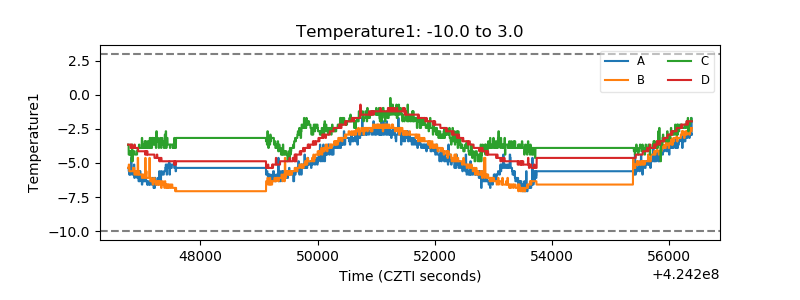 |
| Veto HV Monitor | 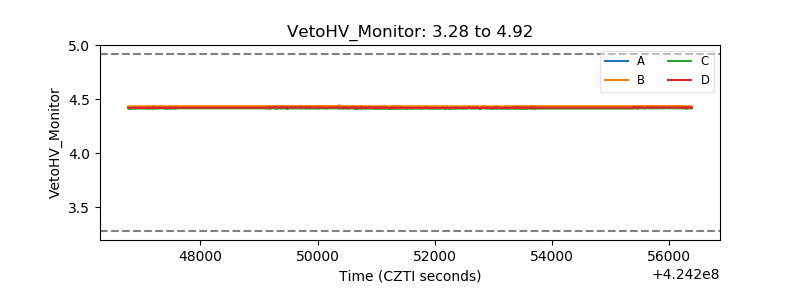 |
| Veto LLD | 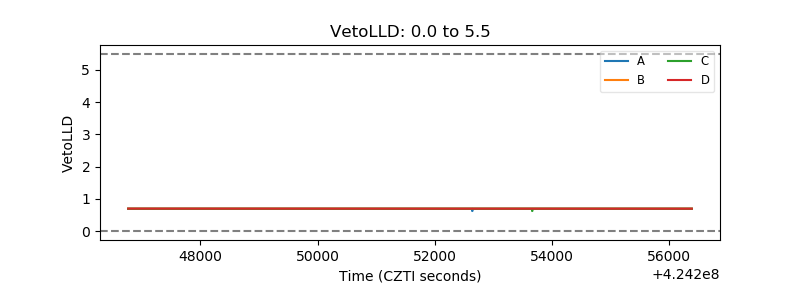 |
| Alpha Counter | 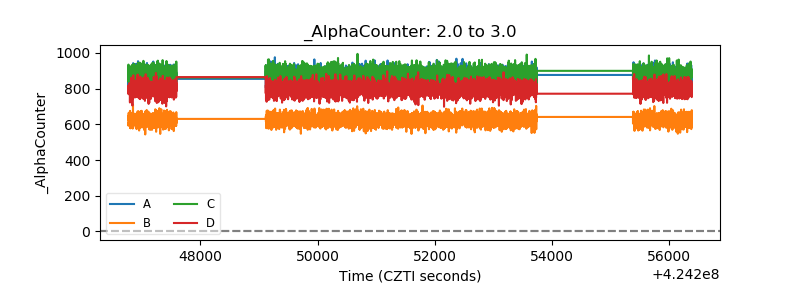 |
| _CPM_Rate | 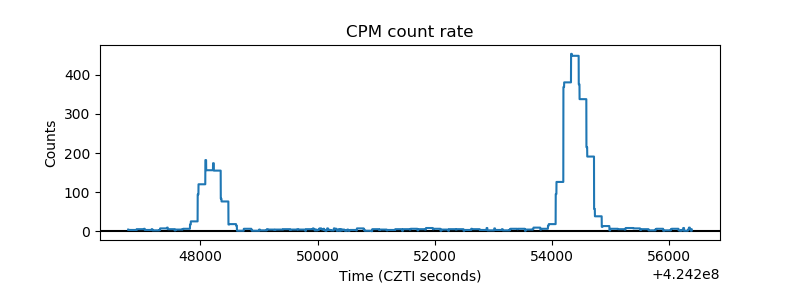 |
| CZT Counter | 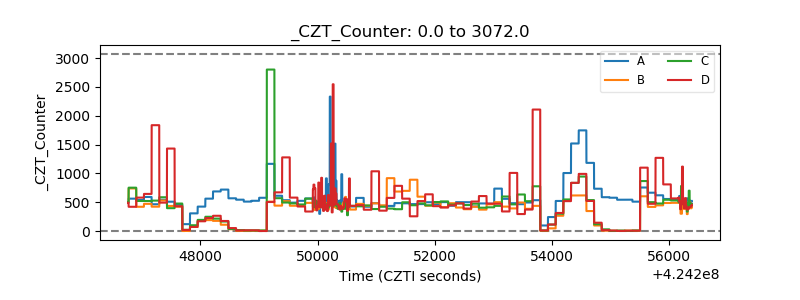 |
| +2.5 Volts monitor | 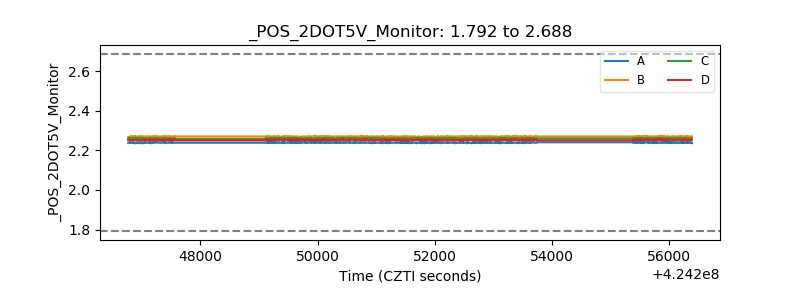 |
| +5 Volts monitor |  |
| _ROLL_ROT |  |
| _Roll_DEC | 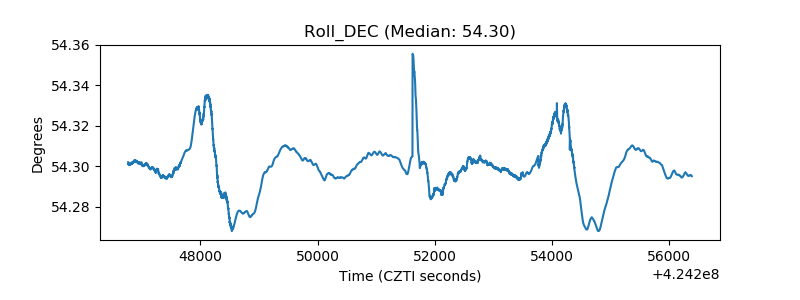 |
| _Roll_RA | 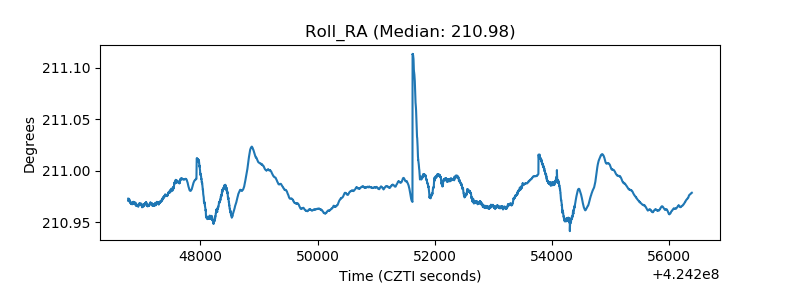 |
| Veto Counter | 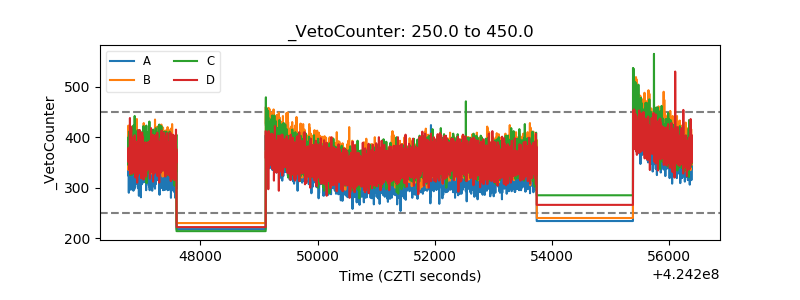 |