| Param | Original file | Final file |
|---|---|---|
| Filename | modeM0/AS1T05_116T01_9000005682_41660cztM0_level2.fits | modeM0/AS1T05_116T01_9000005682_41660cztM0_level2_quad_clean.evt |
| Size (bytes) | 387,342,720 | 92,332,800 |
| Size | 369.4 MB | 88.1 MB |
| Events in quadrant A | 3,071,616 | 633,762 |
| Events in quadrant B | 3,253,341 | 649,819 |
| Events in quadrant C | 3,095,558 | 593,525 |
| Events in quadrant D | 4,483,919 | 528,679 |
| Mode M0 | |||
|---|---|---|---|
| Quadrant | BADHDUFLAG | Total packets | Discarded packets |
| A | 0 | 12457 | 2 |
| B | 0 | 13296 | 2 |
| C | 0 | 12621 | 2 |
| D | 0 | 17261 | 2 |
| Mode M9 | |||
|---|---|---|---|
| Quadrant | BADHDUFLAG | Total packets | Discarded packets |
| A | 0 | 23 | 0 |
| B | 0 | 24 | 0 |
| C | 0 | 24 | 0 |
| D | 0 | 24 | 0 |
| Mode SS | |||
|---|---|---|---|
| Quadrant | BADHDUFLAG | Total packets | Discarded packets |
| A | 0 | 114 | 0 |
| B | 0 | 114 | 0 |
| C | 0 | 114 | 0 |
| D | 0 | 114 | 0 |
| Quadrant | Total seconds | Saturated seconds | Saturation percentage |
|---|---|---|---|
| A | 5575 | 43 | 0.771300% |
| B | 5575 | 44 | 0.789238% |
| C | 5575 | 175 | 3.139013% |
| D | 5575 | 475 | 8.520179% |
Noise dominated data is calculated using 1-second bins in cleaned event files. If a bin has >2000 counts, and if more than 50% of those come from <1% of pixels, then it is considered to be noise-dominated and hence unusable.
| Quadrant | # 1 sec bins | Bins with >0 counts | Bins with >2000 counts | High rate bins dominated by noise | Noise dominated (total time) | Noise dominated (detector-on time) | Marked lightcurve |
|---|---|---|---|---|---|---|---|
| A | 7337 | 5576 | 25 | 25 | 0.34% | 0.45% | 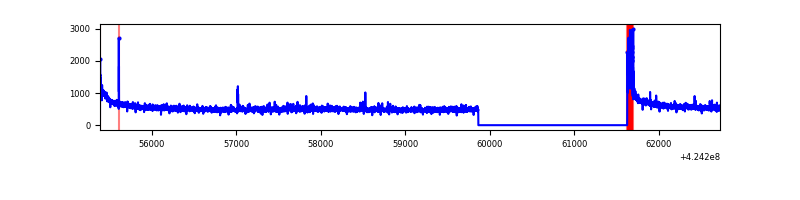 |
| B | 7337 | 5576 | 22 | 22 | 0.30% | 0.39% | 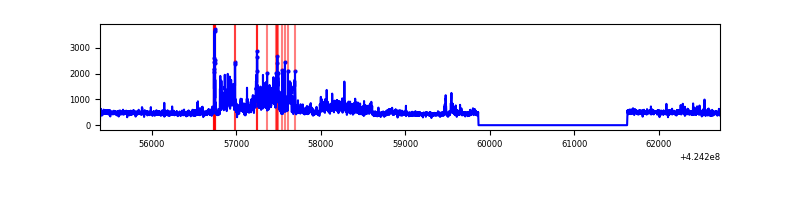 |
| C | 7337 | 5576 | 159 | 159 | 2.17% | 2.85% | 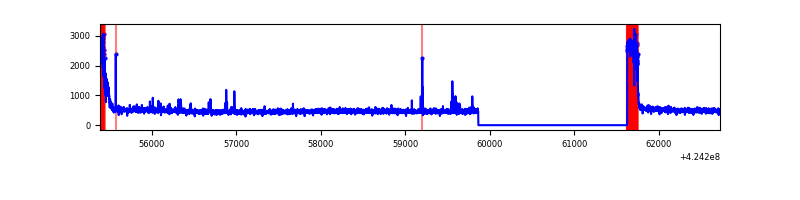 |
| D | 7337 | 5576 | 412 | 412 | 5.62% | 7.39% | 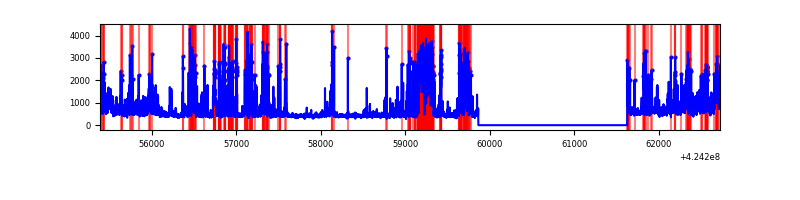 |
Top three noisy pixels from each quadrant. If the there are fewer than three noisy pixels in the level2.evt file, extra rows are filled as -1
| Pixel properties | Quadrant properties | ||||||
|---|---|---|---|---|---|---|---|
| Quadrant | DetID | PixID | Counts | Sigma | Mean | Median | Sigma |
| A | 10 | 83 | 548883 | 4246.08 | 628 | 615 | 129.1 |
| A | 13 | 248 | 64970 | 498.4 | 628 | 615 | 129.1 |
| A | 3 | 1 | 13836 | 102.39 | 628 | 615 | 129.1 |
| B | 7 | 202 | 361266 | 2999.08 | 619 | 601 | 120.3 |
| B | 0 | 186 | 327660 | 2719.63 | 619 | 601 | 120.3 |
| B | 0 | 190 | 66144 | 545.02 | 619 | 601 | 120.3 |
| C | 0 | 10 | 484664 | 3466.84 | 597 | 600 | 139.6 |
| C | 15 | 214 | 226793 | 1619.98 | 597 | 600 | 139.6 |
| C | 4 | 254 | 35392 | 249.18 | 597 | 600 | 139.6 |
| D | 13 | 249 | 1003427 | 6940.11 | 592 | 576 | 144.5 |
| D | 1 | 47 | 687905 | 4756.58 | 592 | 576 | 144.5 |
| D | 2 | 249 | 204659 | 1412.33 | 592 | 576 | 144.5 |
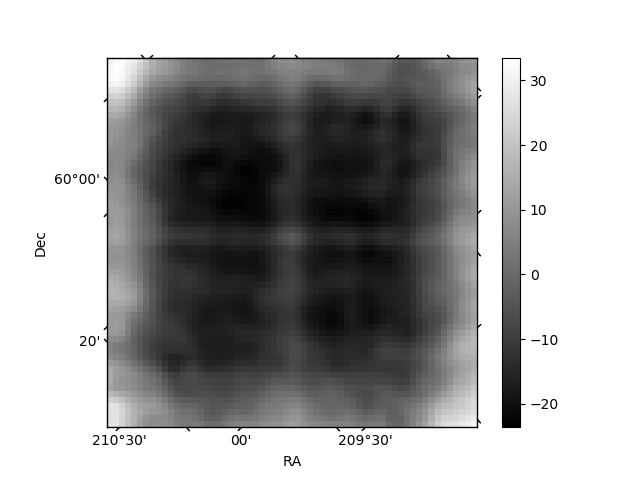
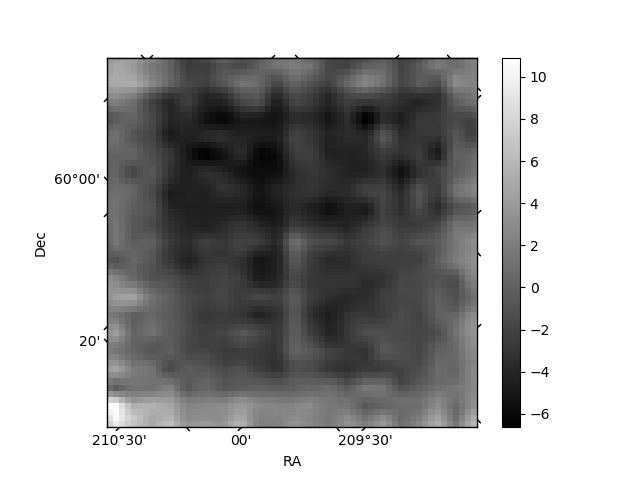
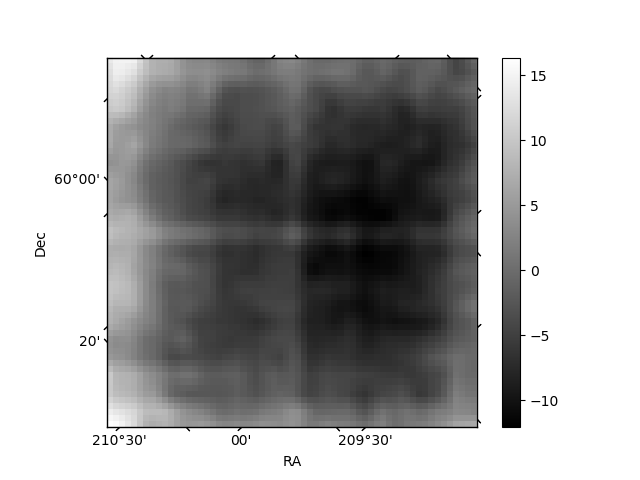
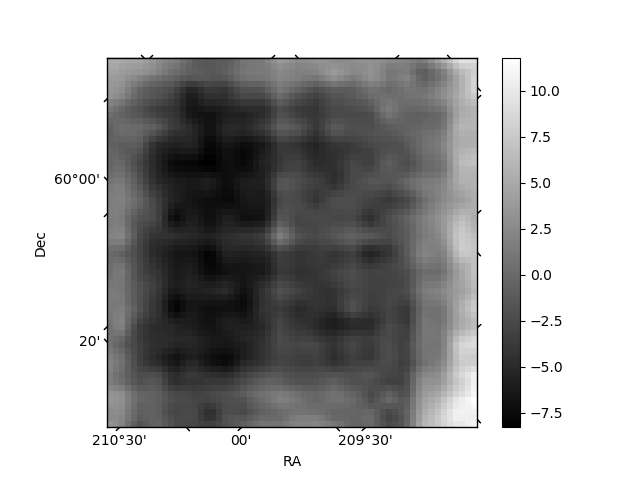
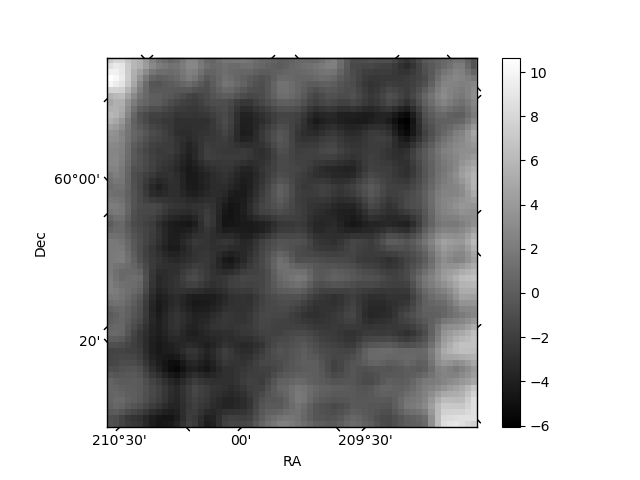
Histogram calculated using DETX and DETY for each event in the final _common_clean file
| Quadrant A | 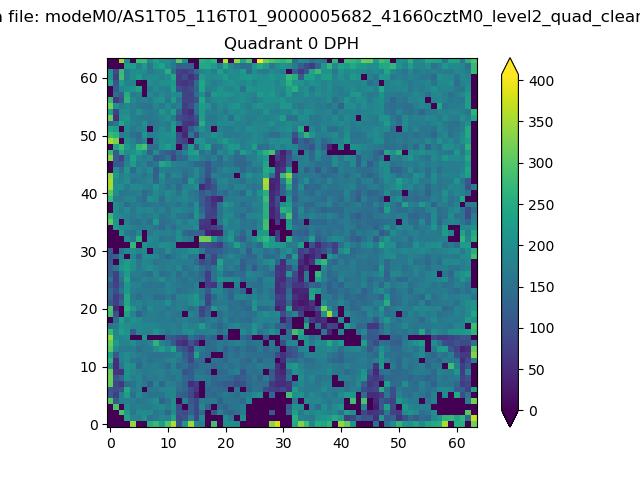 |
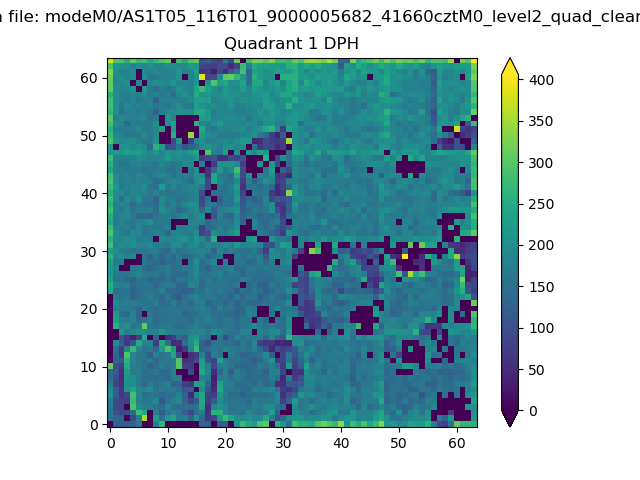 |
Quadrant B |
|---|---|---|---|
| Quadrant D | 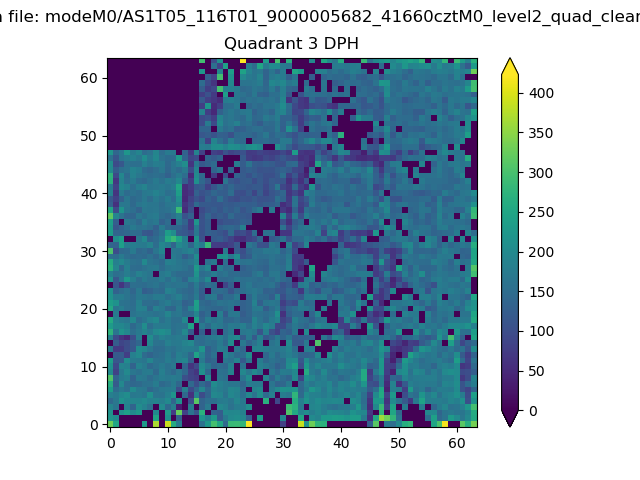 |
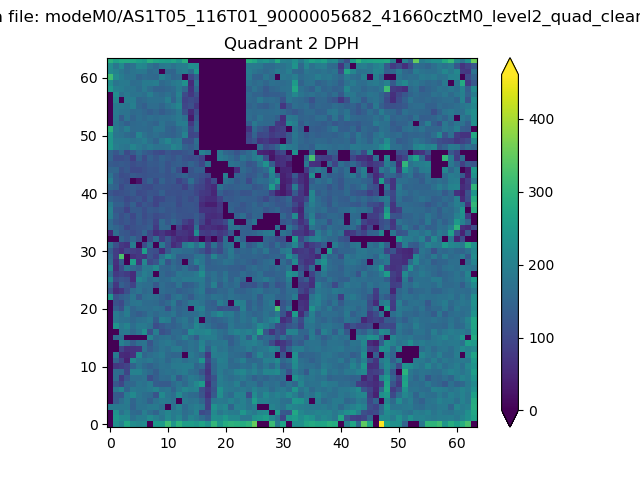 |
Quadrant C |
| Plot type | Count rate plots | Images |
|---|---|---|
| Comparison with Poisson distribution Blue bars denote a histogram of data divided into 1 sec bins. Red curve is a Poisson curve with rate = median count rate of data. |
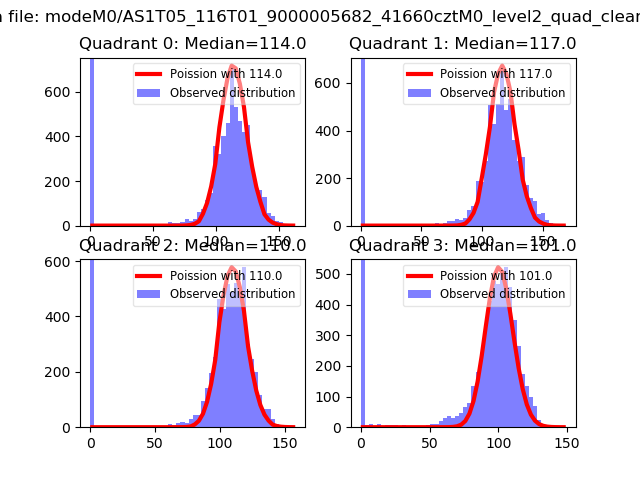 |
 |
| Quadrant-wise count rates Data is divided into 100 sec bins |
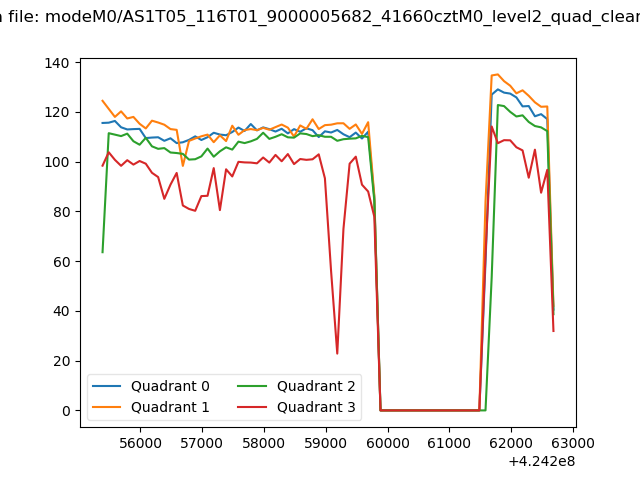 |
|
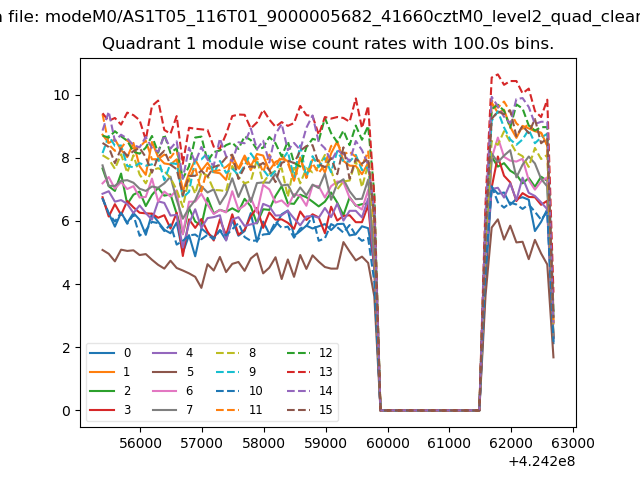
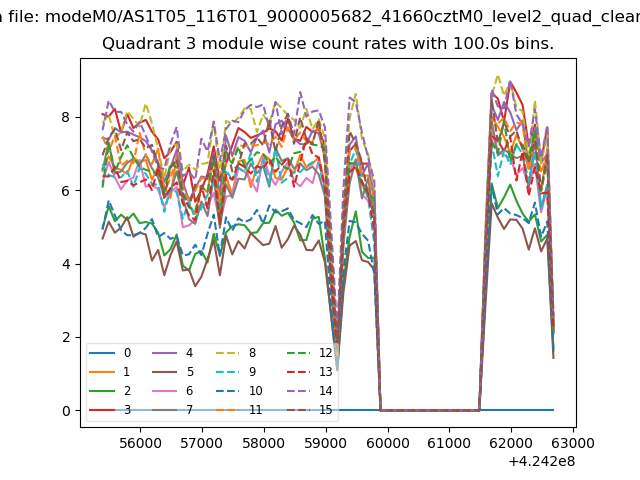
| Module-wise count rates for Quadrant A Data is divided into 100 sec bins |
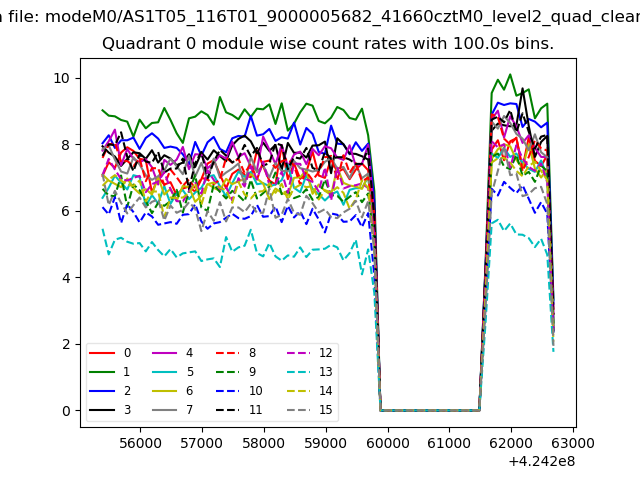 |
 |
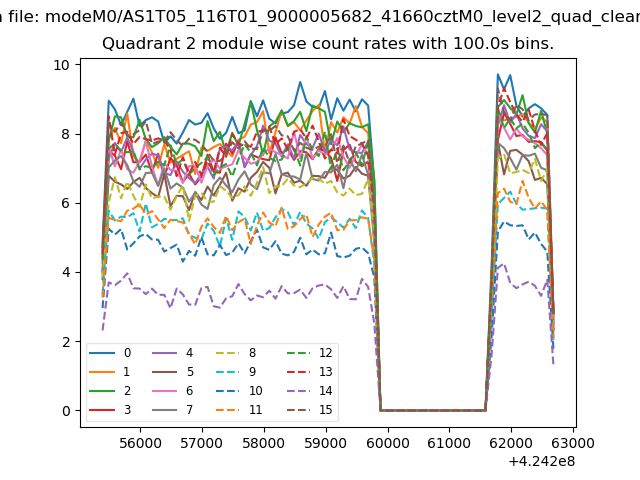
| Module-wise count rates for Quadrant B Data is divided into 100 sec bins |
 |
 |
| Module-wise count rates for Quadrant C Data is divided into 100 sec bins |
 |
 |
| Module-wise count rates for Quadrant D Data is divided into 100 sec bins |
 |
 |
| Parameter | Plot |
|---|---|
| CZT HV Monitor | 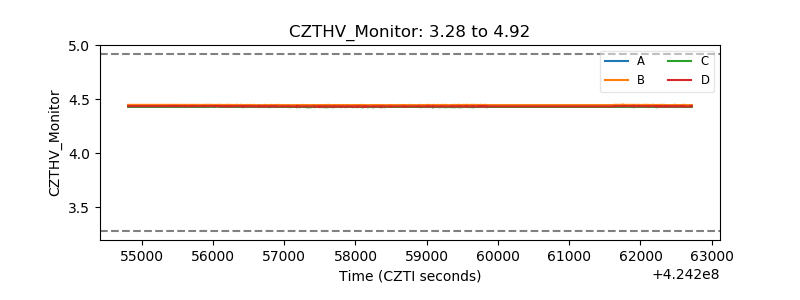 |
| D_VDD | 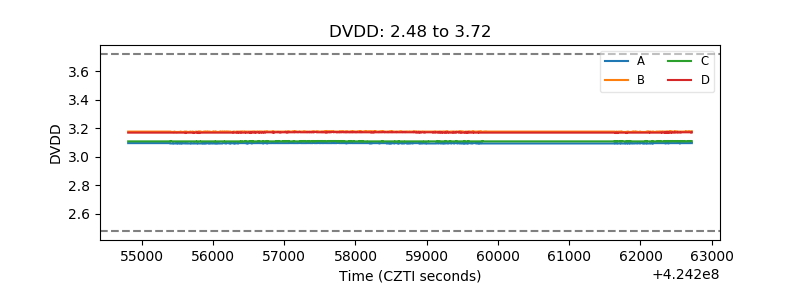 |
| Temperature 1 | 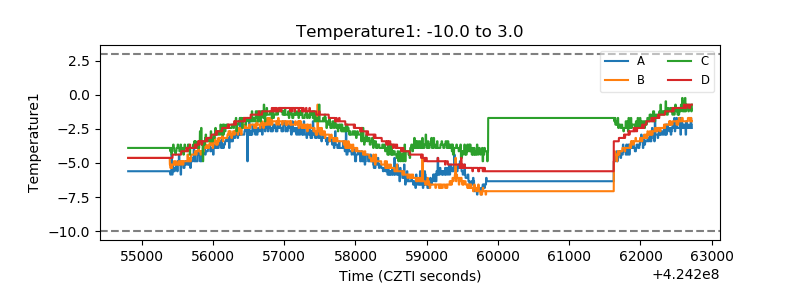 |
| Veto HV Monitor | 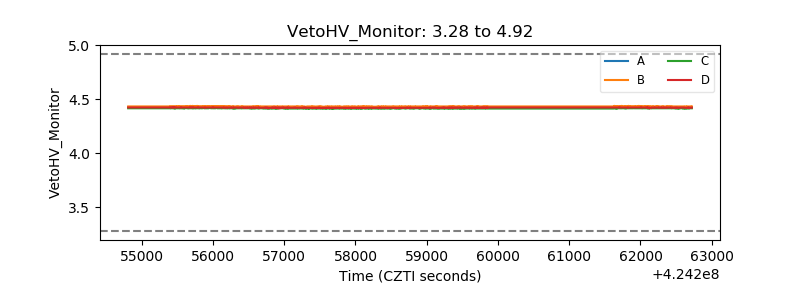 |
| Veto LLD | 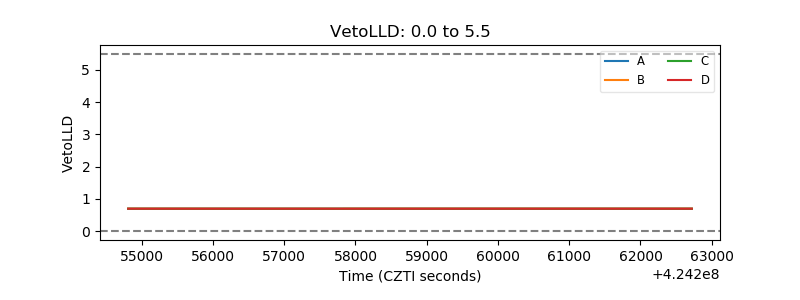 |
| Alpha Counter | 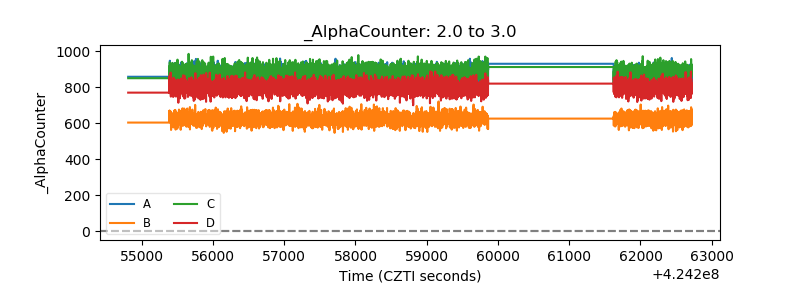 |
| _CPM_Rate | 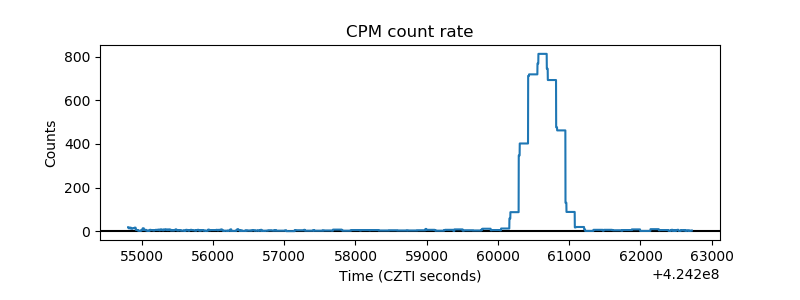 |
| CZT Counter | 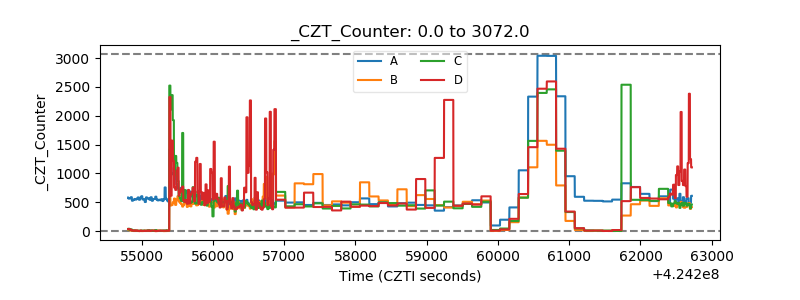 |
| +2.5 Volts monitor | 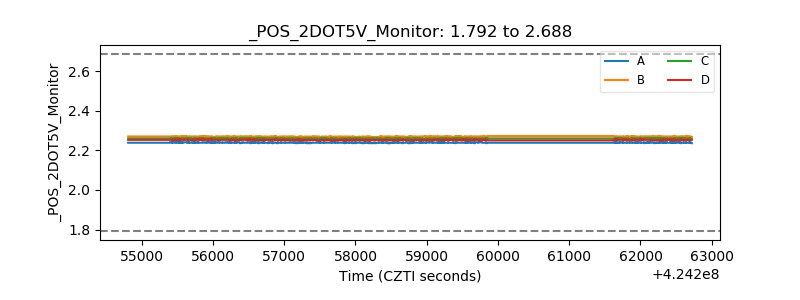 |
| +5 Volts monitor | 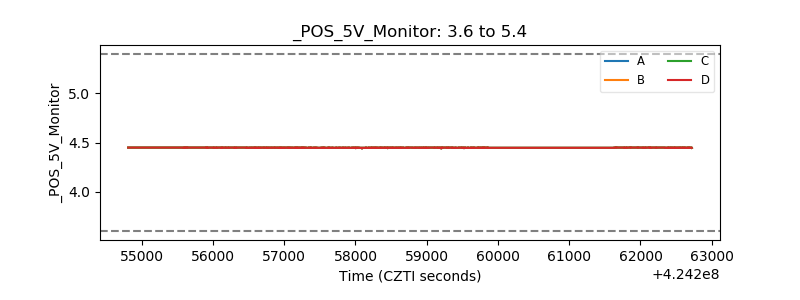 |
| _ROLL_ROT | 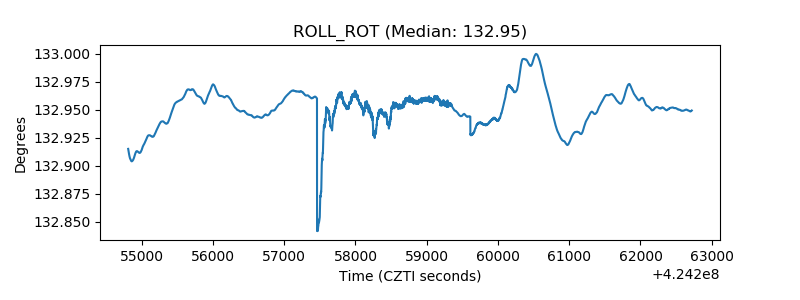 |
| _Roll_DEC | 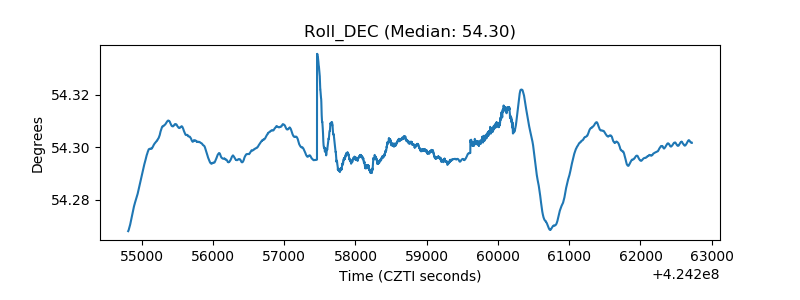 |
| _Roll_RA | 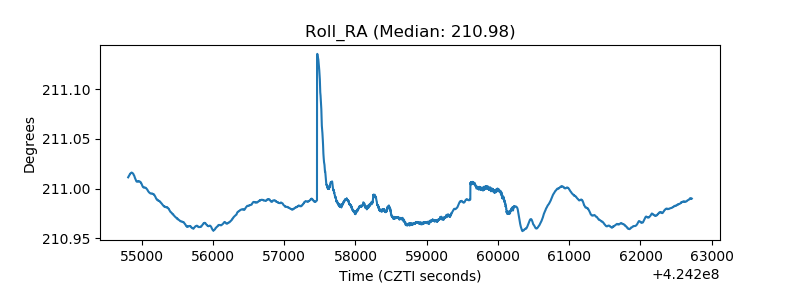 |
| Veto Counter |  |