| Param | Original file | Final file |
|---|---|---|
| Filename | modeM0/AS1T05_116T01_9000005682_41662cztM0_level2.fits | modeM0/AS1T05_116T01_9000005682_41662cztM0_level2_quad_clean.evt |
| Size (bytes) | 373,328,640 | 92,534,400 |
| Size | 356.0 MB | 88.2 MB |
| Events in quadrant A | 2,851,781 | 644,249 |
| Events in quadrant B | 2,579,375 | 652,499 |
| Events in quadrant C | 3,494,582 | 597,472 |
| Events in quadrant D | 4,492,821 | 546,562 |
| Mode M0 | |||
|---|---|---|---|
| Quadrant | BADHDUFLAG | Total packets | Discarded packets |
| A | 0 | 11623 | 1 |
| B | 0 | 10914 | 2 |
| C | 0 | 13622 | 1 |
| D | 0 | 16849 | 1 |
| Mode M9 | |||
|---|---|---|---|
| Quadrant | BADHDUFLAG | Total packets | Discarded packets |
| A | 0 | 20 | 0 |
| B | 0 | 20 | 0 |
| C | 0 | 20 | 0 |
| D | 0 | 20 | 0 |
| Mode SS | |||
|---|---|---|---|
| Quadrant | BADHDUFLAG | Total packets | Discarded packets |
| A | 0 | 106 | 0 |
| B | 0 | 106 | 0 |
| C | 0 | 106 | 0 |
| D | 0 | 106 | 0 |
| Quadrant | Total seconds | Saturated seconds | Saturation percentage |
|---|---|---|---|
| A | 5153 | 6 | 0.116437% |
| B | 5152 | 9 | 0.174689% |
| C | 5152 | 293 | 5.687112% |
| D | 5152 | 376 | 7.298137% |
Noise dominated data is calculated using 1-second bins in cleaned event files. If a bin has >2000 counts, and if more than 50% of those come from <1% of pixels, then it is considered to be noise-dominated and hence unusable.
| Quadrant | # 1 sec bins | Bins with >0 counts | Bins with >2000 counts | High rate bins dominated by noise | Noise dominated (total time) | Noise dominated (detector-on time) | Marked lightcurve |
|---|---|---|---|---|---|---|---|
| A | 7186 | 5154 | 1 | 1 | 0.01% | 0.02% | 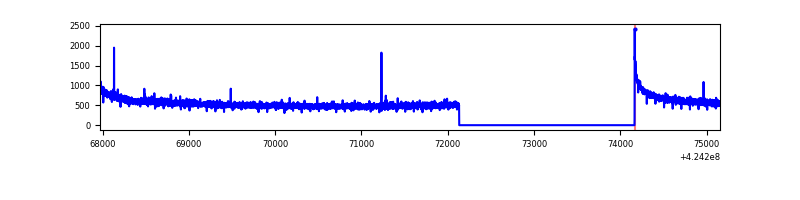 |
| B | 7185 | 5153 | 3 | 3 | 0.04% | 0.06% | 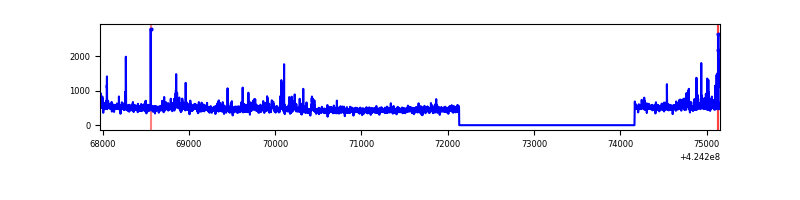 |
| C | 7185 | 5153 | 232 | 232 | 3.23% | 4.50% | 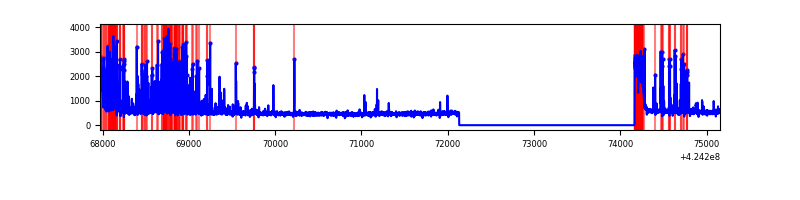 |
| D | 7185 | 5153 | 350 | 350 | 4.87% | 6.79% | 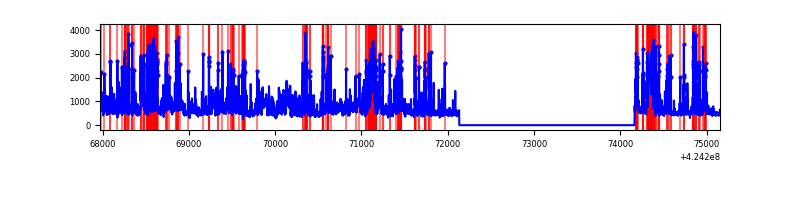 |
Top three noisy pixels from each quadrant. If the there are fewer than three noisy pixels in the level2.evt file, extra rows are filled as -1
| Pixel properties | Quadrant properties | ||||||
|---|---|---|---|---|---|---|---|
| Quadrant | DetID | PixID | Counts | Sigma | Mean | Median | Sigma |
| A | 10 | 83 | 504900 | 4109.34 | 602 | 591 | 122.7 |
| A | 2 | 79 | 8984 | 68.39 | 602 | 591 | 122.7 |
| A | 13 | 254 | 7354 | 55.11 | 602 | 591 | 122.7 |
| B | 0 | 245 | 99165 | 875.91 | 593 | 578 | 112.6 |
| B | 0 | 190 | 65005 | 572.41 | 593 | 578 | 112.6 |
| B | 0 | 186 | 35422 | 309.58 | 593 | 578 | 112.6 |
| C | 14 | 17 | 752737 | 5676.53 | 574 | 577 | 132.5 |
| C | 0 | 10 | 287997 | 2169.15 | 574 | 577 | 132.5 |
| C | 15 | 214 | 209060 | 1573.41 | 574 | 577 | 132.5 |
| D | 13 | 249 | 1297950 | 9374.08 | 573 | 557 | 138.4 |
| D | 12 | 79 | 729250 | 5265.04 | 573 | 557 | 138.4 |
| D | 2 | 249 | 111208 | 799.49 | 573 | 557 | 138.4 |
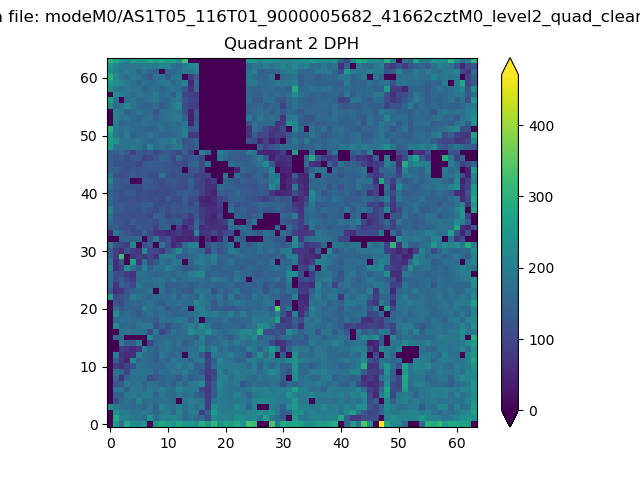
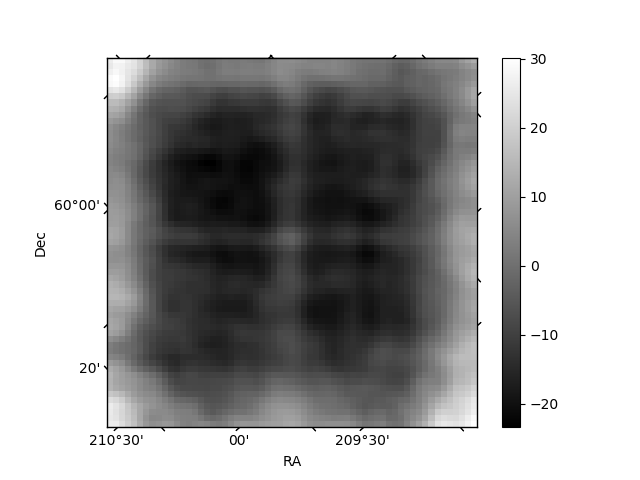
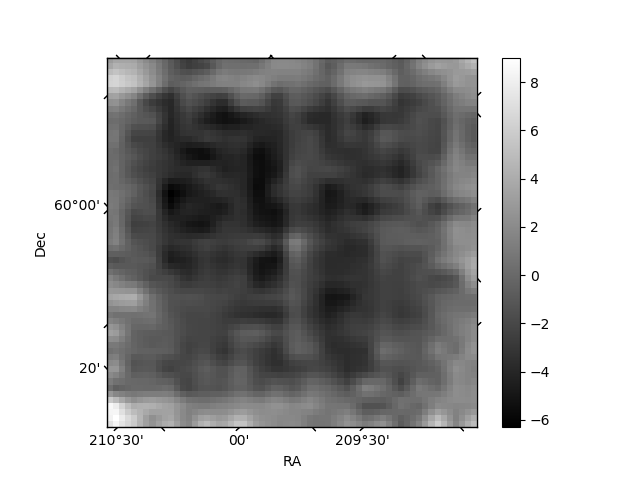
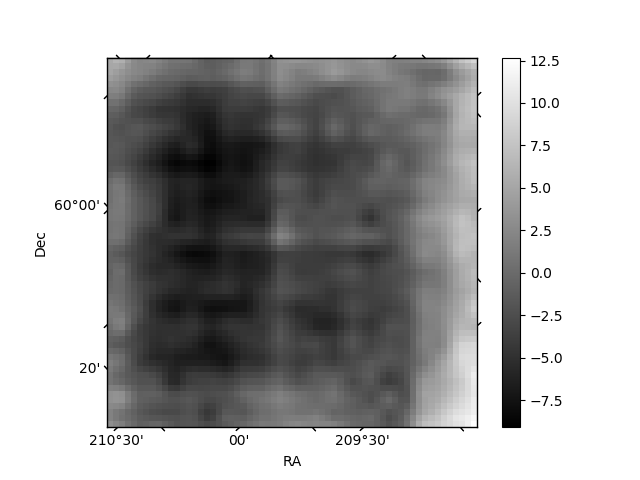
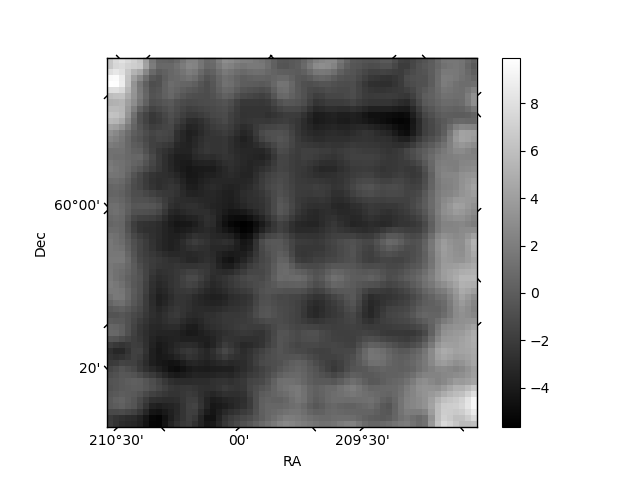
Histogram calculated using DETX and DETY for each event in the final _common_clean file
| Quadrant A | 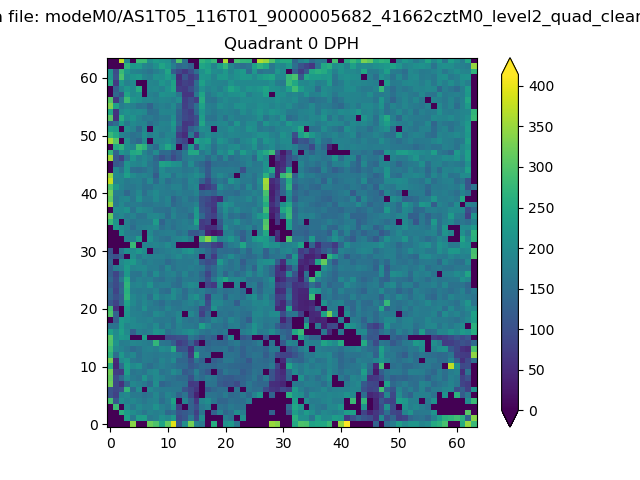 |
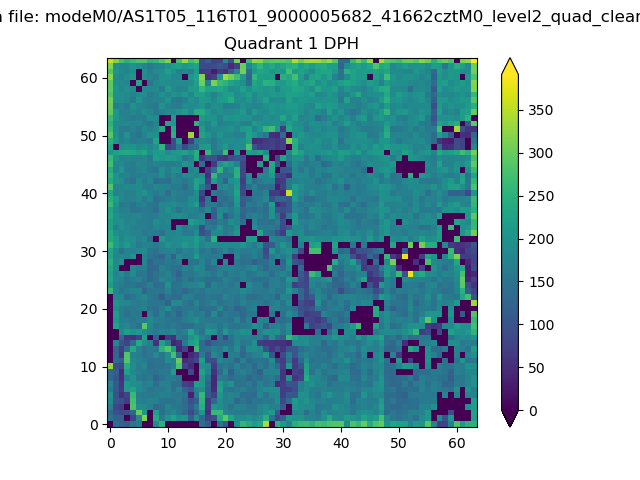 |
Quadrant B |
|---|---|---|---|
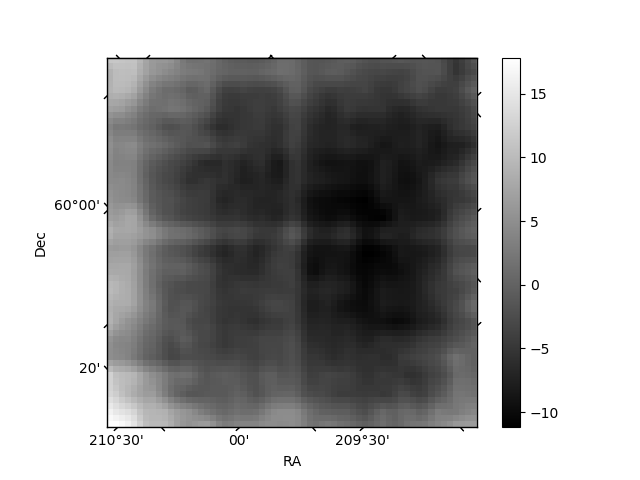
| Quadrant D | 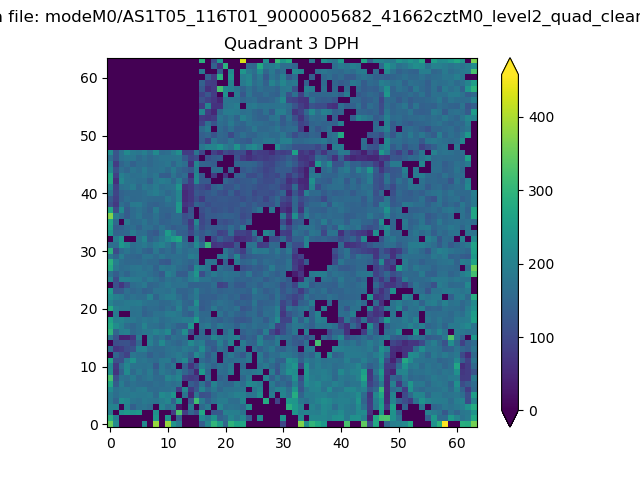 |
 |
Quadrant C |
| Plot type | Count rate plots | Images |
|---|---|---|
| Comparison with Poisson distribution Blue bars denote a histogram of data divided into 1 sec bins. Red curve is a Poisson curve with rate = median count rate of data. |
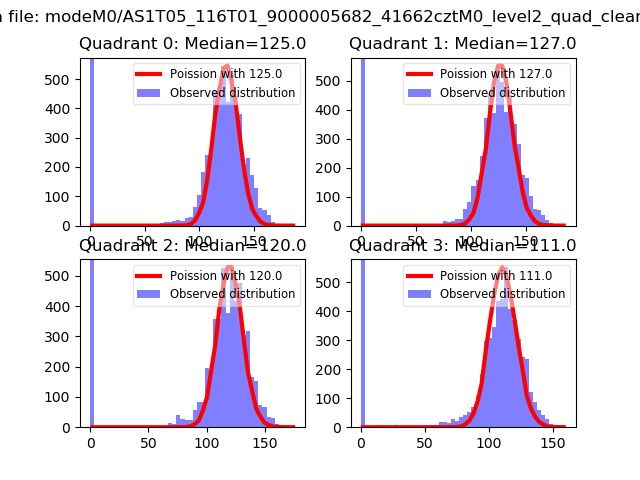 |
 |
| Quadrant-wise count rates Data is divided into 100 sec bins |
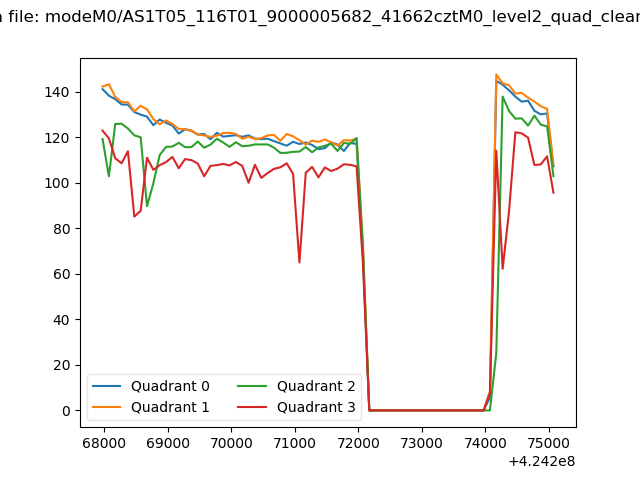 |
|
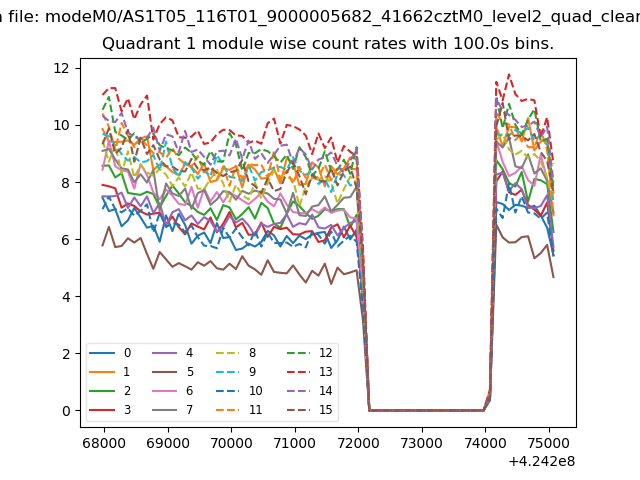
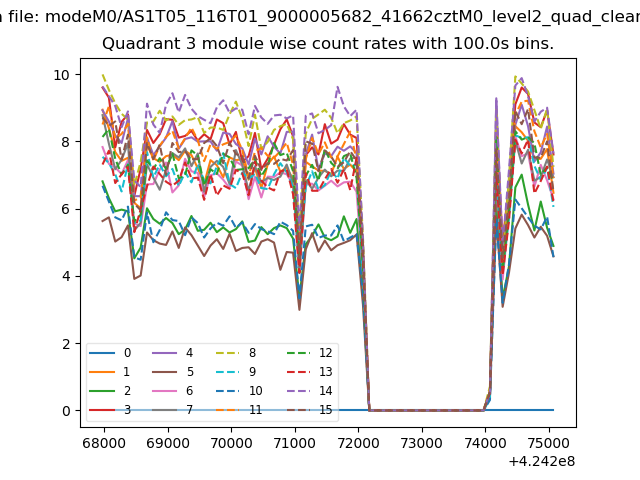
| Module-wise count rates for Quadrant A Data is divided into 100 sec bins |
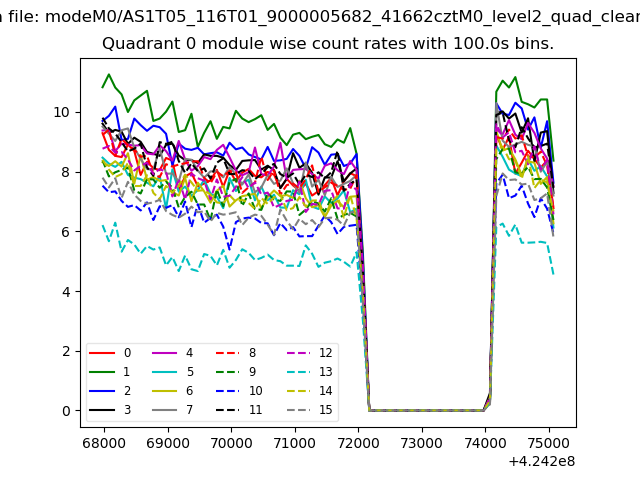 |
 |
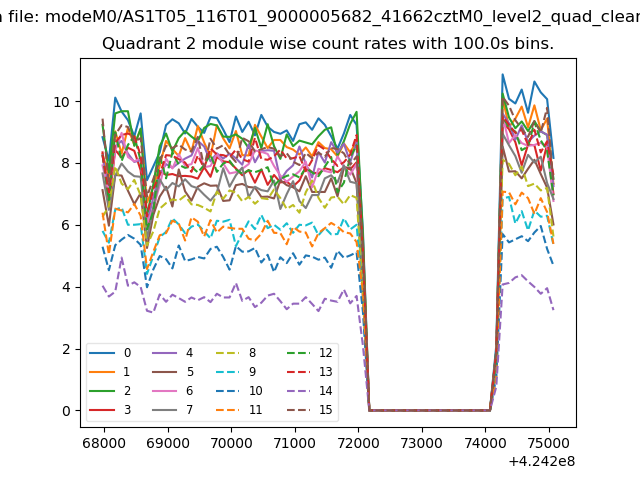
| Module-wise count rates for Quadrant B Data is divided into 100 sec bins |
 |
 |
| Module-wise count rates for Quadrant C Data is divided into 100 sec bins |
 |
 |
| Module-wise count rates for Quadrant D Data is divided into 100 sec bins |
 |
 |
| Parameter | Plot |
|---|---|
| CZT HV Monitor | 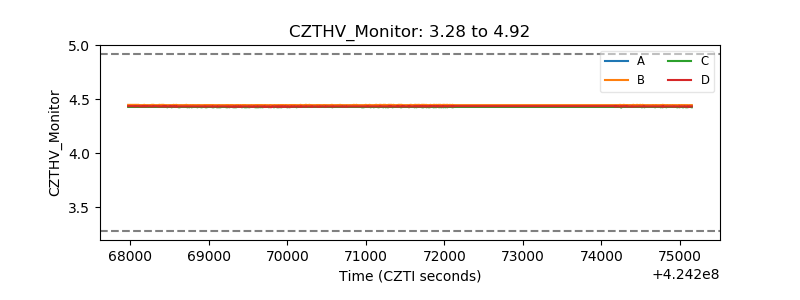 |
| D_VDD | 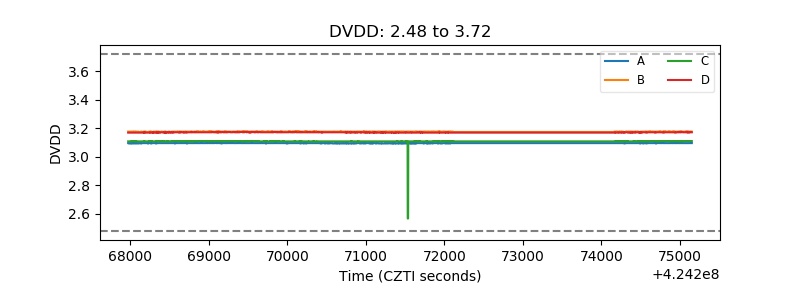 |
| Temperature 1 | 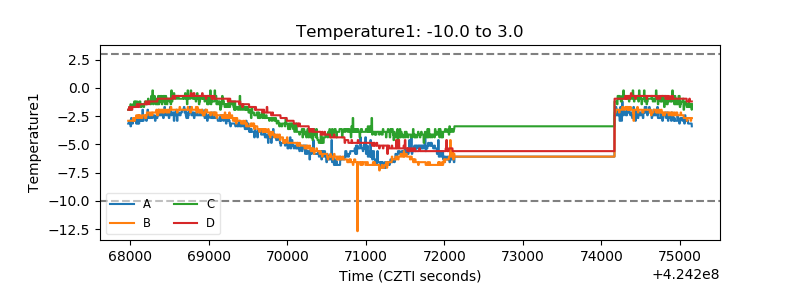 |
| Veto HV Monitor | 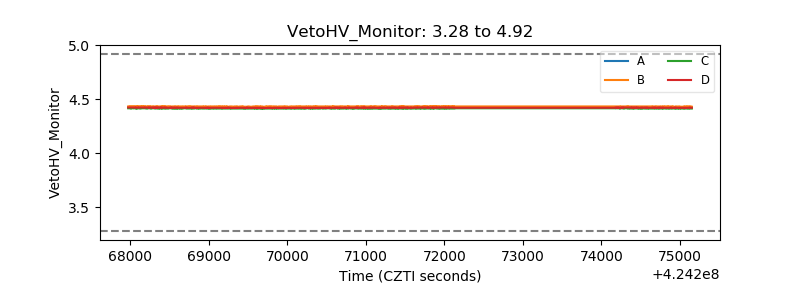 |
| Veto LLD | 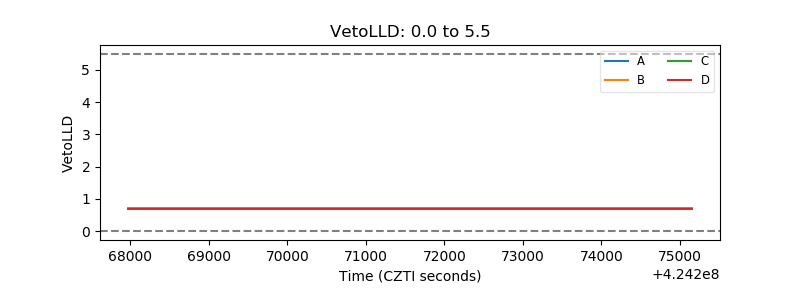 |
| Alpha Counter | 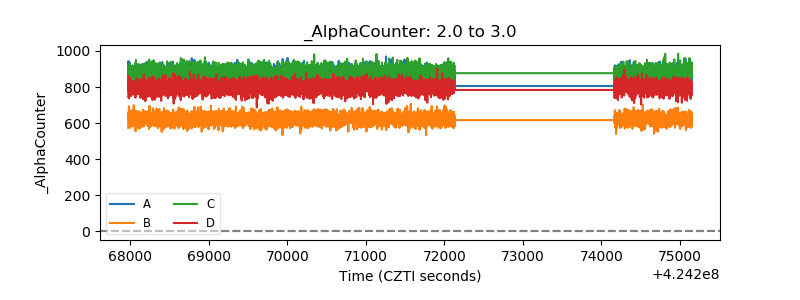 |
| _CPM_Rate | 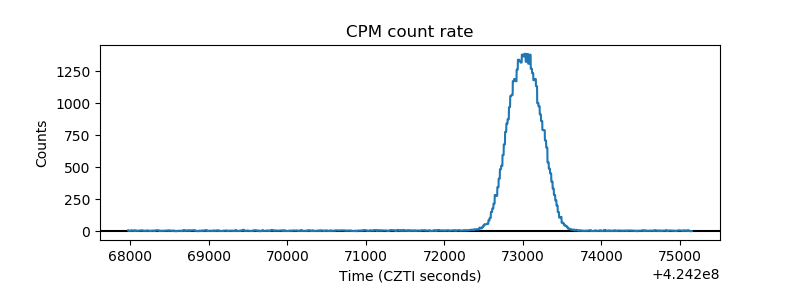 |
| CZT Counter | 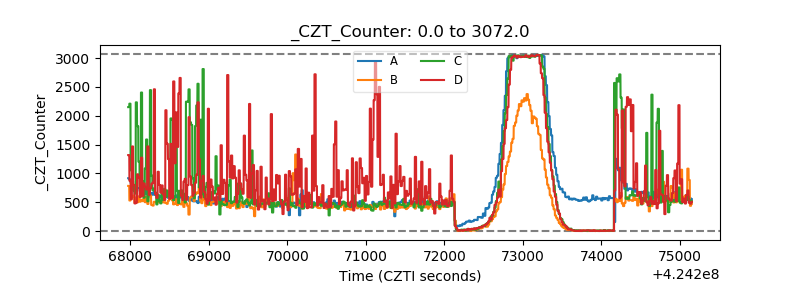 |
| +2.5 Volts monitor | 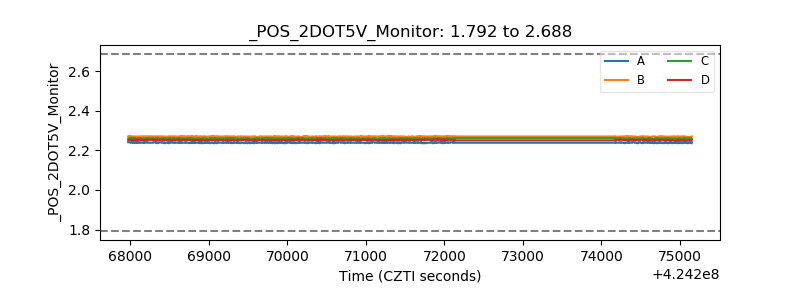 |
| +5 Volts monitor | 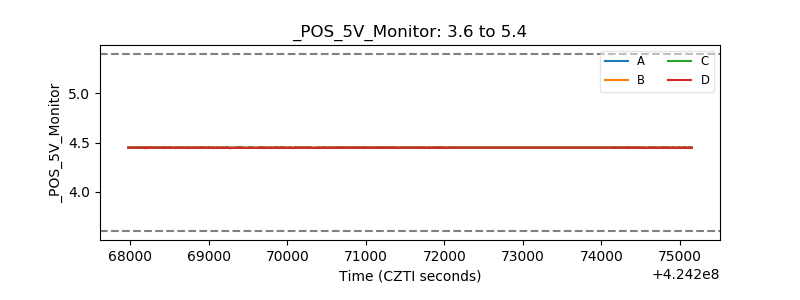 |
| _ROLL_ROT | 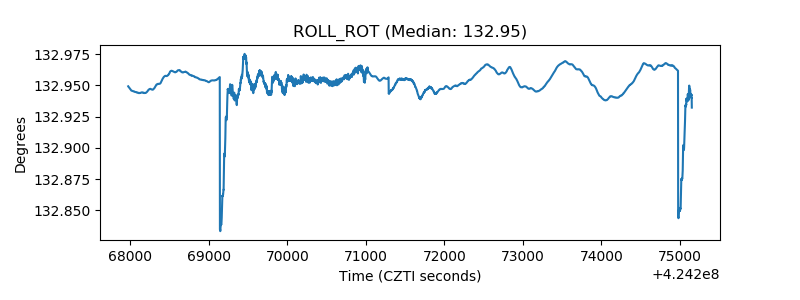 |
| _Roll_DEC | 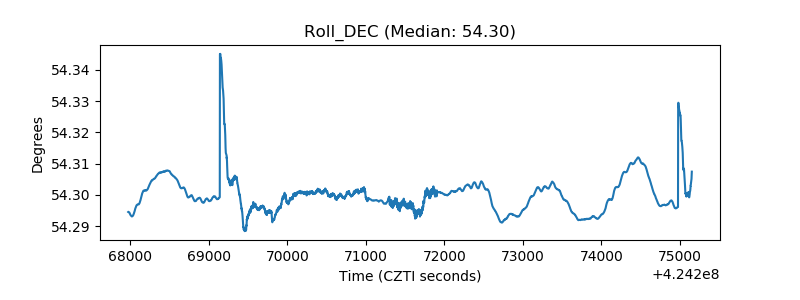 |
| _Roll_RA | 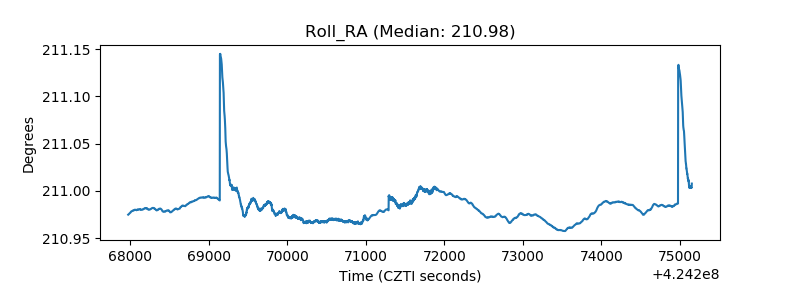 |
| Veto Counter |  |