| Param | Original file | Final file |
|---|---|---|
| Filename | modeM0/AS1T05_116T01_9000005682_41663cztM0_level2.fits | modeM0/AS1T05_116T01_9000005682_41663cztM0_level2_quad_clean.evt |
| Size (bytes) | 344,943,360 | 89,245,440 |
| Size | 329.0 MB | 85.1 MB |
| Events in quadrant A | 2,771,073 | 619,107 |
| Events in quadrant B | 2,579,139 | 630,090 |
| Events in quadrant C | 3,295,592 | 577,370 |
| Events in quadrant D | 3,735,474 | 527,211 |
| Mode M0 | |||
|---|---|---|---|
| Quadrant | BADHDUFLAG | Total packets | Discarded packets |
| A | 0 | 11305 | 2 |
| B | 0 | 10942 | 2 |
| C | 0 | 12843 | 2 |
| D | 0 | 14401 | 2 |
| Mode M9 | |||
|---|---|---|---|
| Quadrant | BADHDUFLAG | Total packets | Discarded packets |
| A | 0 | 21 | 0 |
| B | 0 | 21 | 0 |
| C | 0 | 21 | 0 |
| D | 0 | 21 | 0 |
| Mode SS | |||
|---|---|---|---|
| Quadrant | BADHDUFLAG | Total packets | Discarded packets |
| A | 0 | 102 | 0 |
| B | 0 | 102 | 0 |
| C | 0 | 102 | 0 |
| D | 0 | 102 | 0 |
| Quadrant | Total seconds | Saturated seconds | Saturation percentage |
|---|---|---|---|
| A | 4972 | 10 | 0.201126% |
| B | 4972 | 14 | 0.281577% |
| C | 4972 | 276 | 5.551086% |
| D | 4972 | 393 | 7.904264% |
Noise dominated data is calculated using 1-second bins in cleaned event files. If a bin has >2000 counts, and if more than 50% of those come from <1% of pixels, then it is considered to be noise-dominated and hence unusable.
| Quadrant | # 1 sec bins | Bins with >0 counts | Bins with >2000 counts | High rate bins dominated by noise | Noise dominated (total time) | Noise dominated (detector-on time) | Marked lightcurve |
|---|---|---|---|---|---|---|---|
| A | 7065 | 4973 | 2 | 2 | 0.03% | 0.04% | 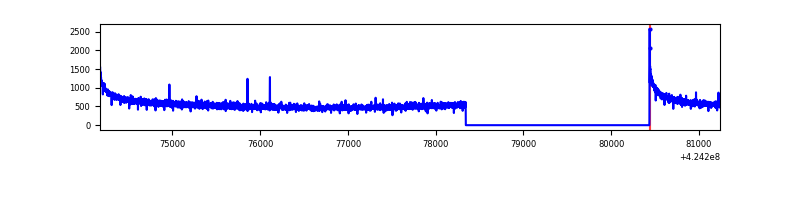 |
| B | 7065 | 4973 | 9 | 9 | 0.13% | 0.18% | 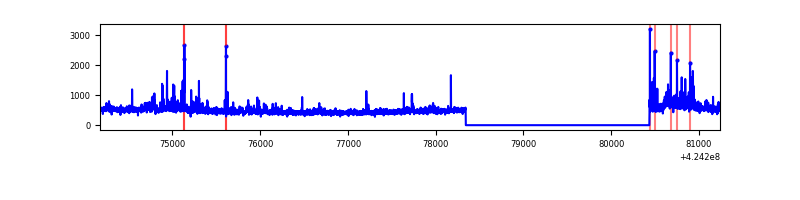 |
| C | 7065 | 4973 | 259 | 259 | 3.67% | 5.21% | 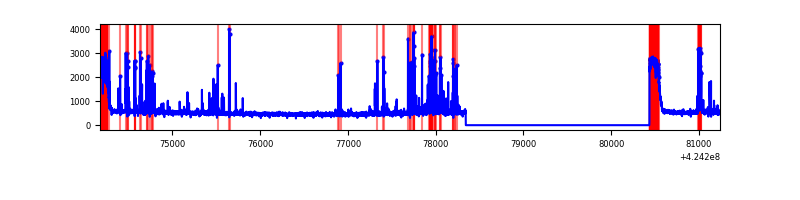 |
| D | 7065 | 4973 | 373 | 373 | 5.28% | 7.50% | 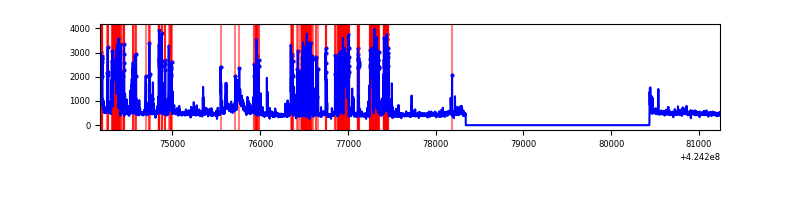 |
Top three noisy pixels from each quadrant. If the there are fewer than three noisy pixels in the level2.evt file, extra rows are filled as -1
| Pixel properties | Quadrant properties | ||||||
|---|---|---|---|---|---|---|---|
| Quadrant | DetID | PixID | Counts | Sigma | Mean | Median | Sigma |
| A | 10 | 83 | 526617 | 4504.59 | 575 | 565 | 116.8 |
| A | 2 | 79 | 11942 | 97.42 | 575 | 565 | 116.8 |
| A | 13 | 254 | 7293 | 57.61 | 575 | 565 | 116.8 |
| B | 0 | 190 | 115751 | 1073.75 | 567 | 553 | 107.3 |
| B | 0 | 186 | 94263 | 873.46 | 567 | 553 | 107.3 |
| B | 4 | 141 | 86175 | 798.07 | 567 | 553 | 107.3 |
| C | 0 | 10 | 499850 | 3914.63 | 549 | 553 | 127.5 |
| C | 14 | 17 | 436148 | 3415.19 | 549 | 553 | 127.5 |
| C | 15 | 214 | 200183 | 1565.15 | 549 | 553 | 127.5 |
| D | 13 | 249 | 1368936 | 10316.23 | 548 | 533 | 132.6 |
| D | 2 | 249 | 89349 | 669.57 | 548 | 533 | 132.6 |
| D | 12 | 79 | 48536 | 361.89 | 548 | 533 | 132.6 |
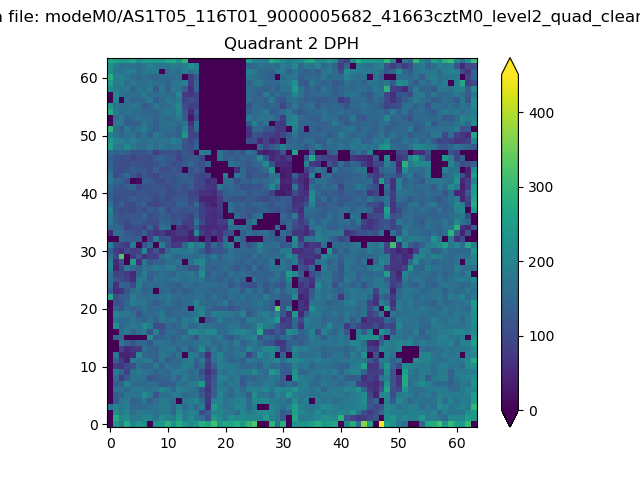
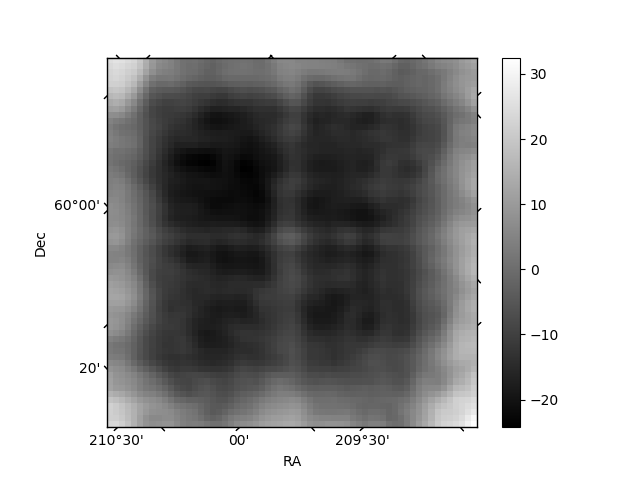
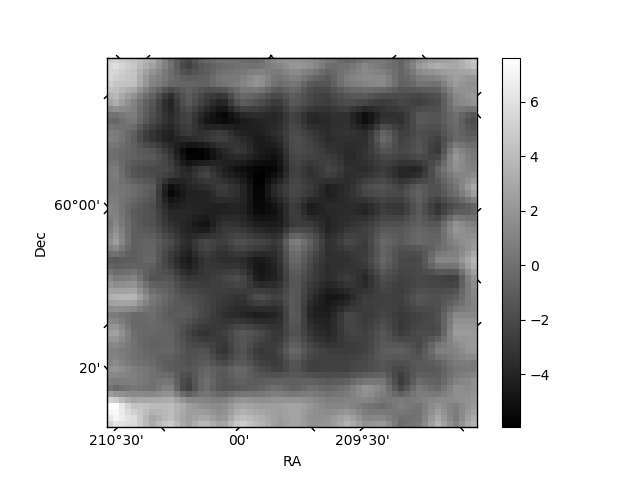
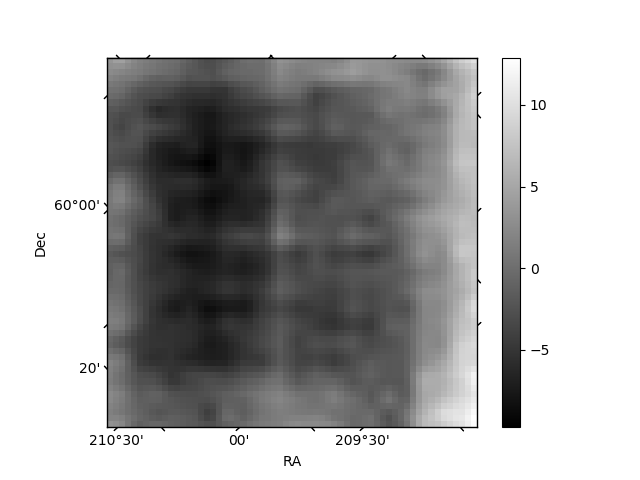
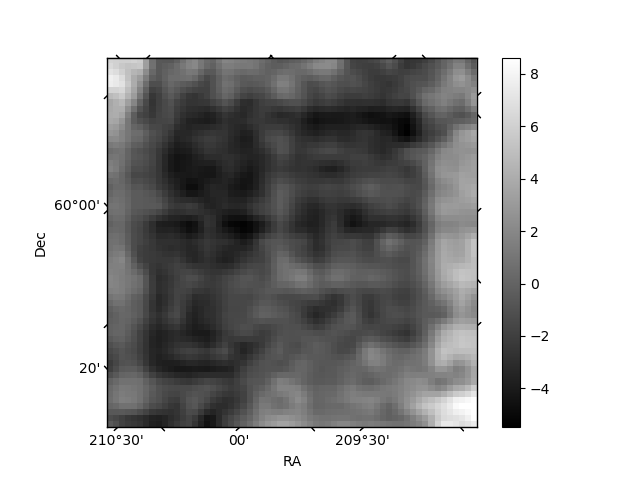
Histogram calculated using DETX and DETY for each event in the final _common_clean file
| Quadrant A | 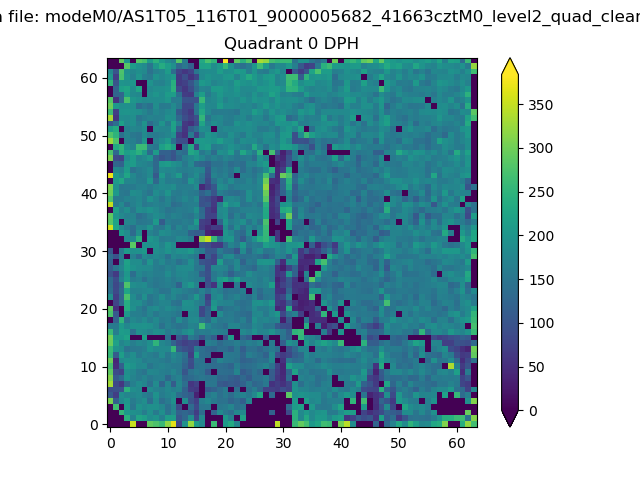 |
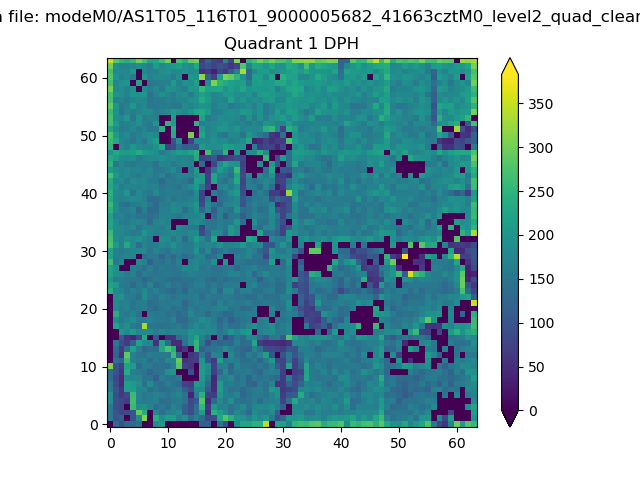 |
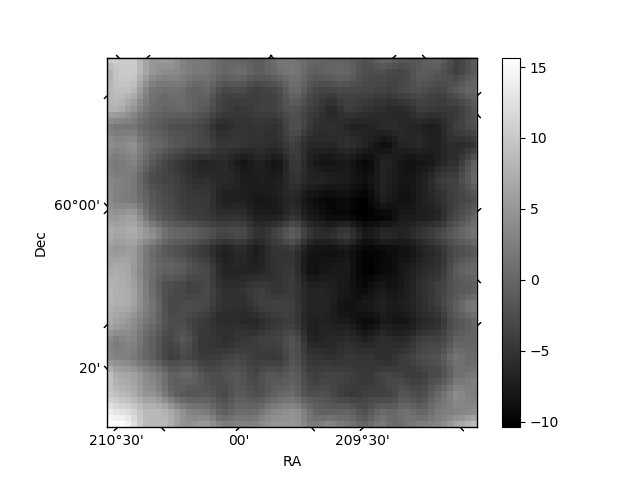
Quadrant B |
|---|---|---|---|
| Quadrant D | 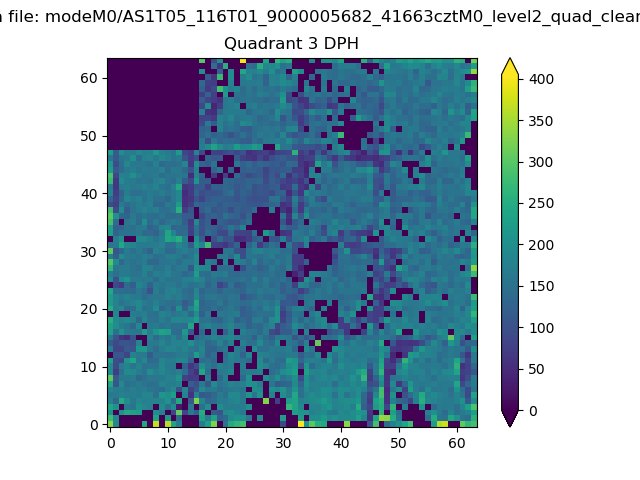 |
 |
Quadrant C |
| Plot type | Count rate plots | Images |
|---|---|---|
| Comparison with Poisson distribution Blue bars denote a histogram of data divided into 1 sec bins. Red curve is a Poisson curve with rate = median count rate of data. |
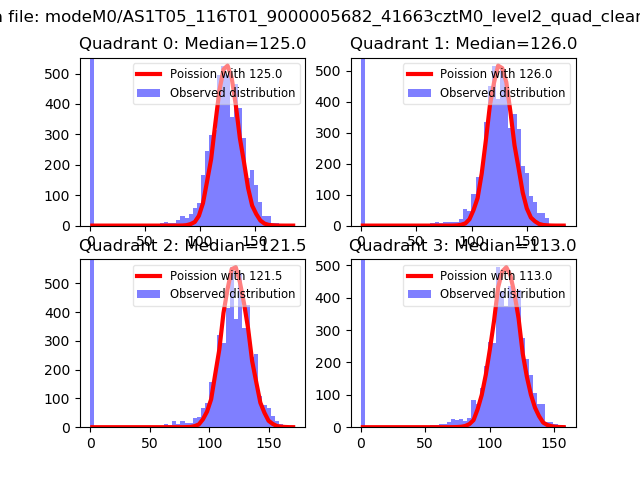 |
 |
| Quadrant-wise count rates Data is divided into 100 sec bins |
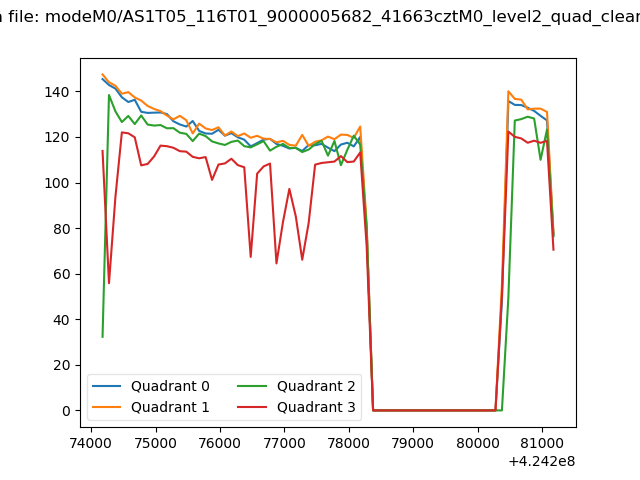 |
|
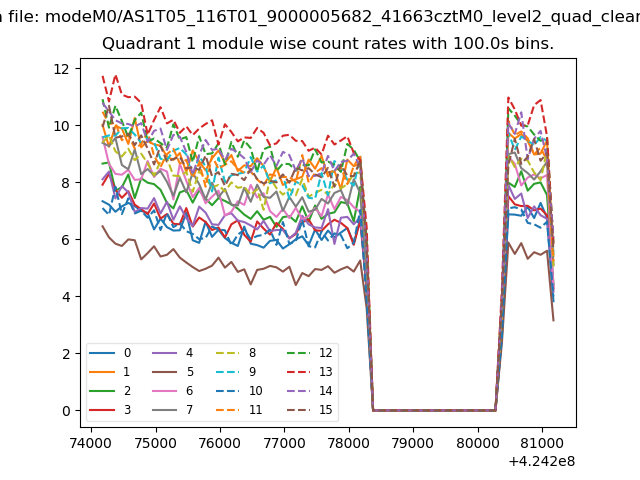
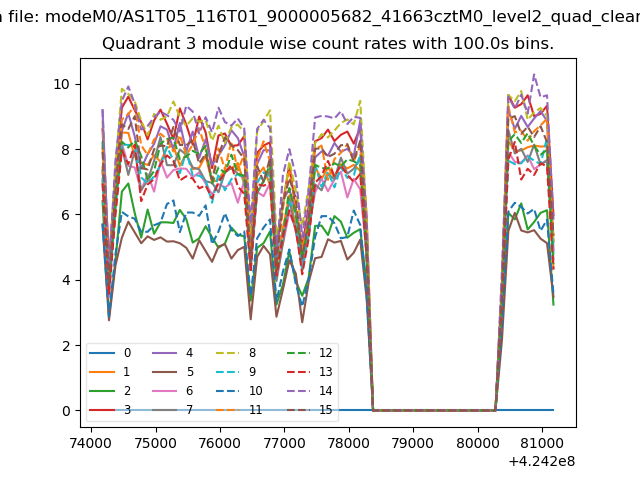
| Module-wise count rates for Quadrant A Data is divided into 100 sec bins |
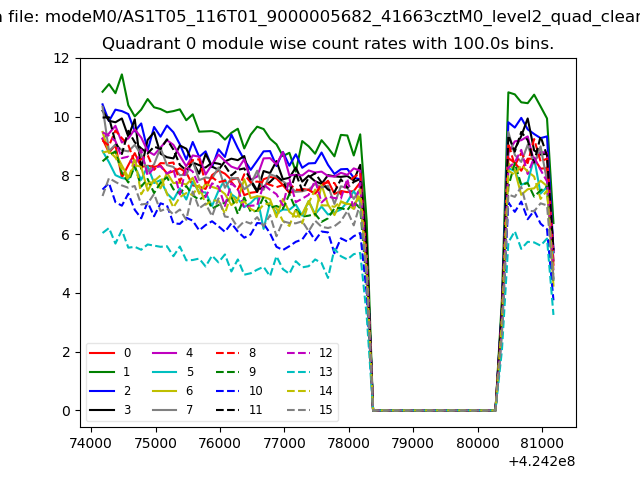 |
 |
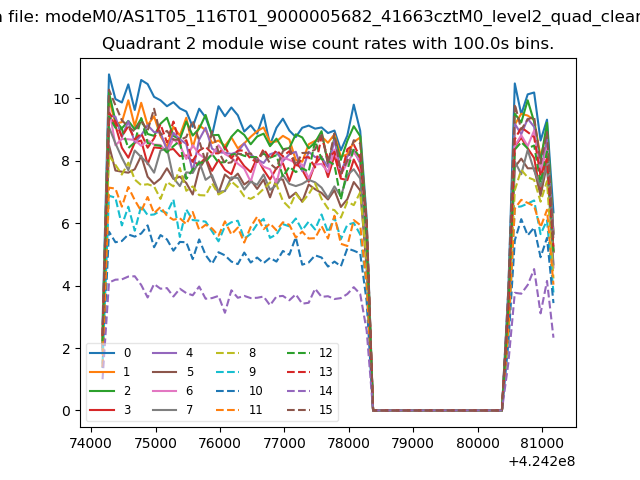
| Module-wise count rates for Quadrant B Data is divided into 100 sec bins |
 |
 |
| Module-wise count rates for Quadrant C Data is divided into 100 sec bins |
 |
 |
| Module-wise count rates for Quadrant D Data is divided into 100 sec bins |
 |
 |
| Parameter | Plot |
|---|---|
| CZT HV Monitor | 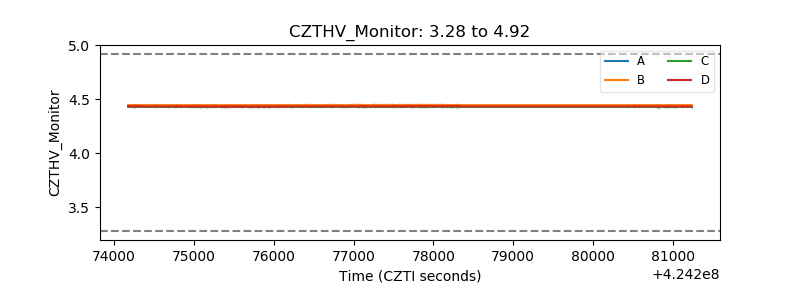 |
| D_VDD | 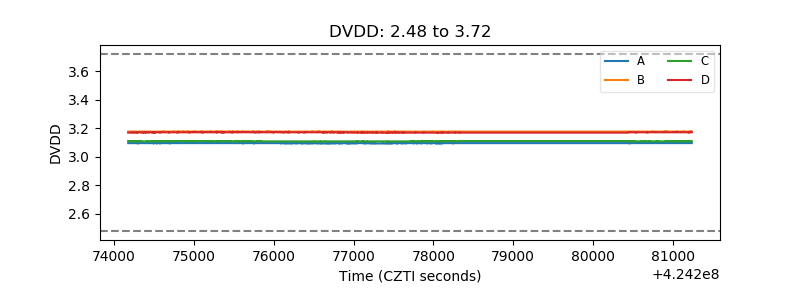 |
| Temperature 1 | 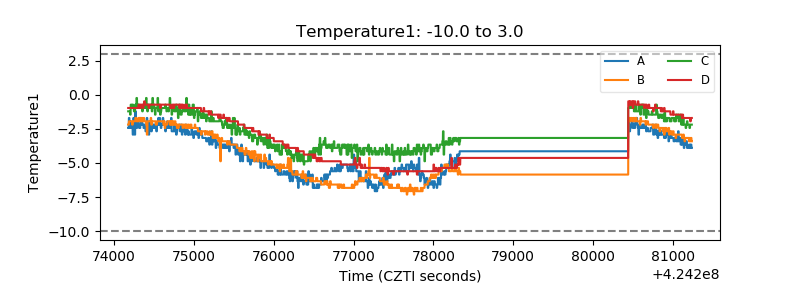 |
| Veto HV Monitor | 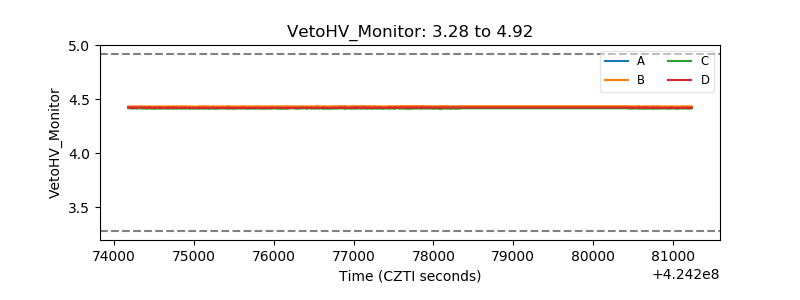 |
| Veto LLD | 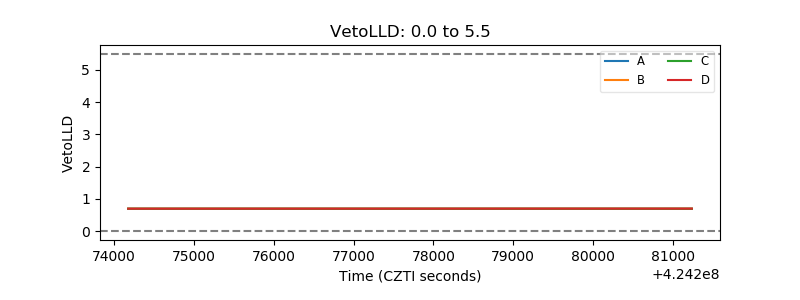 |
| Alpha Counter | 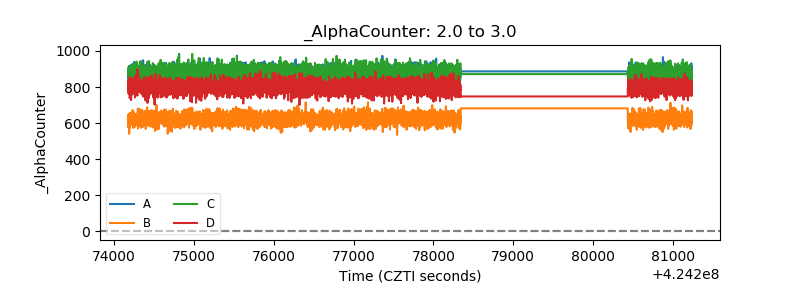 |
| _CPM_Rate | 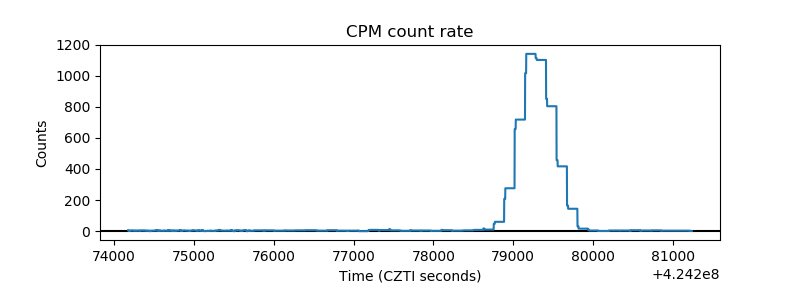 |
| CZT Counter | 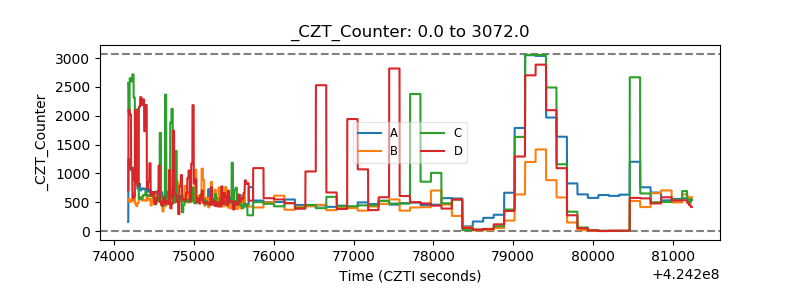 |
| +2.5 Volts monitor | 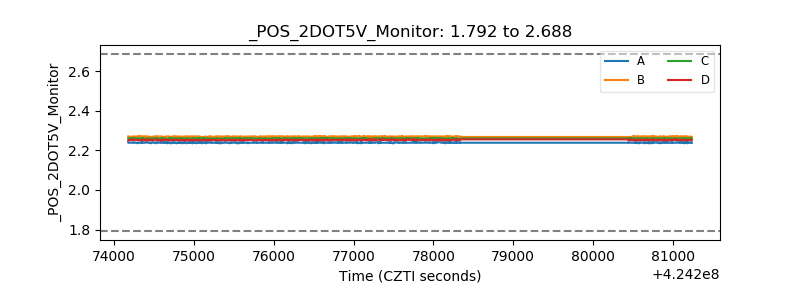 |
| +5 Volts monitor | 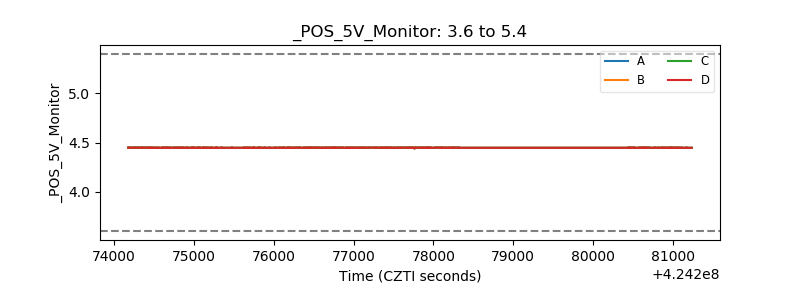 |
| _ROLL_ROT |  |
| _Roll_DEC | 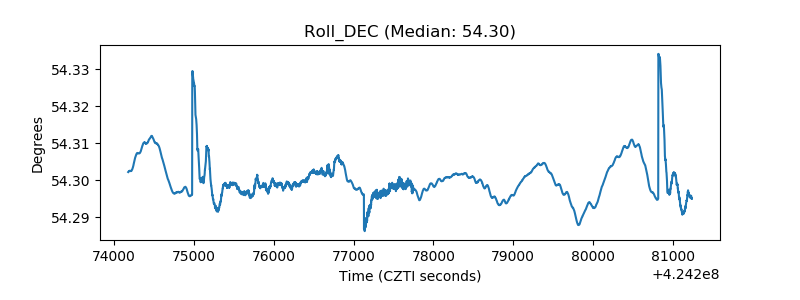 |
| _Roll_RA | 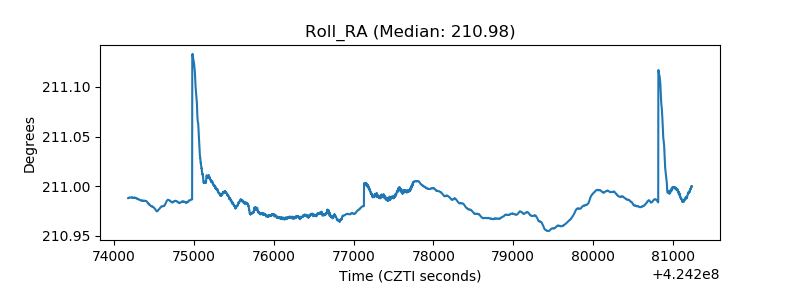 |
| Veto Counter | 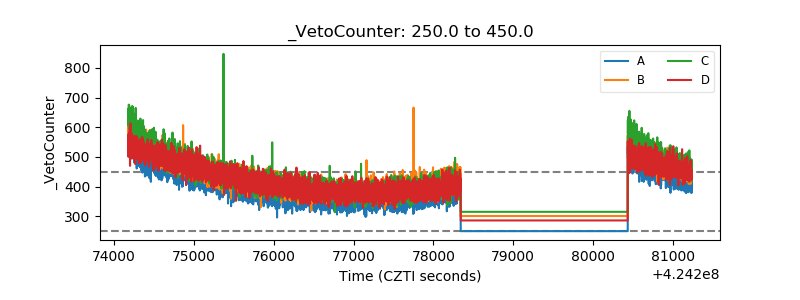 |