| Param | Original file | Final file |
|---|---|---|
| Filename | modeM0/AS1T05_116T01_9000005682_41665cztM0_level2.fits | modeM0/AS1T05_116T01_9000005682_41665cztM0_level2_quad_clean.evt |
| Size (bytes) | 331,139,520 | 80,873,280 |
| Size | 315.8 MB | 77.1 MB |
| Events in quadrant A | 2,583,047 | 556,576 |
| Events in quadrant B | 2,206,983 | 568,901 |
| Events in quadrant C | 2,762,371 | 532,530 |
| Events in quadrant D | 4,322,923 | 446,773 |
| Mode M0 | |||
|---|---|---|---|
| Quadrant | BADHDUFLAG | Total packets | Discarded packets |
| A | 0 | 10701 | 2 |
| B | 0 | 10079 | 2 |
| C | 0 | 11344 | 2 |
| D | 0 | 16347 | 2 |
| Mode M9 | |||
|---|---|---|---|
| Quadrant | BADHDUFLAG | Total packets | Discarded packets |
| A | 0 | 29 | 0 |
| B | 0 | 30 | 0 |
| C | 0 | 30 | 0 |
| D | 0 | 30 | 0 |
| Mode SS | |||
|---|---|---|---|
| Quadrant | BADHDUFLAG | Total packets | Discarded packets |
| A | 0 | 102 | 0 |
| B | 0 | 102 | 0 |
| C | 0 | 102 | 0 |
| D | 0 | 102 | 0 |
| Quadrant | Total seconds | Saturated seconds | Saturation percentage |
|---|---|---|---|
| A | 4899 | 11 | 0.224536% |
| B | 4899 | 10 | 0.204123% |
| C | 4899 | 194 | 3.959992% |
| D | 4899 | 724 | 14.778526% |
Noise dominated data is calculated using 1-second bins in cleaned event files. If a bin has >2000 counts, and if more than 50% of those come from <1% of pixels, then it is considered to be noise-dominated and hence unusable.
| Quadrant | # 1 sec bins | Bins with >0 counts | Bins with >2000 counts | High rate bins dominated by noise | Noise dominated (total time) | Noise dominated (detector-on time) | Marked lightcurve |
|---|---|---|---|---|---|---|---|
| A | 6962 | 4900 | 4 | 4 | 0.06% | 0.08% | 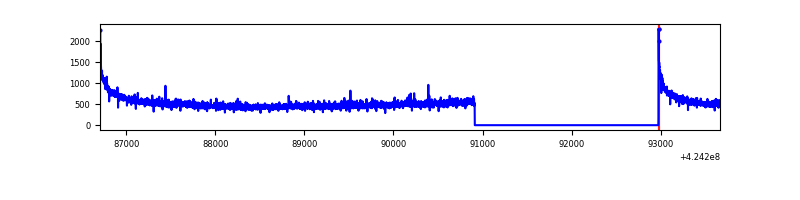 |
| B | 6962 | 4900 | 1 | 1 | 0.01% | 0.02% | 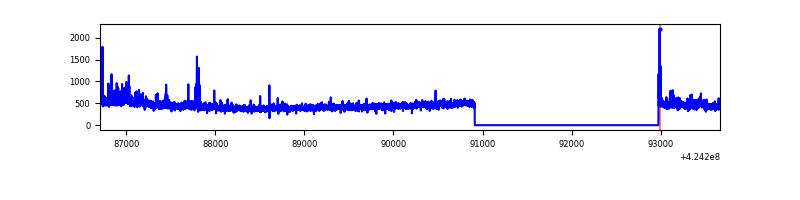 |
| C | 6962 | 4900 | 191 | 191 | 2.74% | 3.90% | 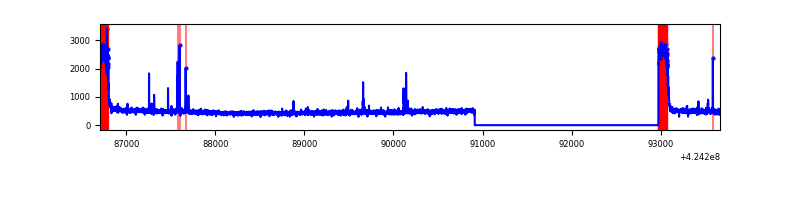 |
| D | 6962 | 4899 | 683 | 683 | 9.81% | 13.94% | 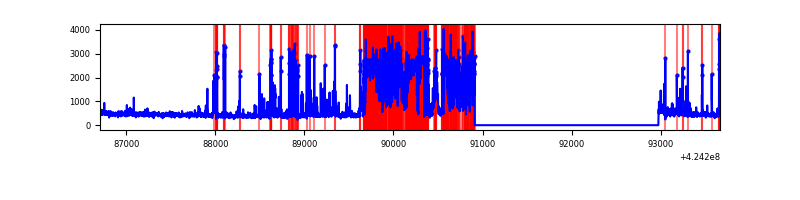 |
Top three noisy pixels from each quadrant. If the there are fewer than three noisy pixels in the level2.evt file, extra rows are filled as -1
| Pixel properties | Quadrant properties | ||||||
|---|---|---|---|---|---|---|---|
| Quadrant | DetID | PixID | Counts | Sigma | Mean | Median | Sigma |
| A | 10 | 83 | 516385 | 4752.88 | 529 | 518 | 108.5 |
| A | 13 | 6 | 7729 | 66.44 | 529 | 518 | 108.5 |
| A | 13 | 254 | 7089 | 60.54 | 529 | 518 | 108.5 |
| B | 0 | 190 | 73209 | 724.04 | 527 | 513 | 100.4 |
| B | 0 | 186 | 25696 | 250.82 | 527 | 513 | 100.4 |
| B | 0 | 245 | 22813 | 222.1 | 527 | 513 | 100.4 |
| C | 0 | 10 | 507811 | 4287.29 | 510 | 513 | 118.3 |
| C | 15 | 214 | 195408 | 1647.1 | 510 | 513 | 118.3 |
| C | 14 | 254 | 32583 | 271.03 | 510 | 513 | 118.3 |
| D | 13 | 249 | 2079119 | 17771.82 | 483 | 469 | 117.0 |
| D | 2 | 249 | 256125 | 2185.78 | 483 | 469 | 117.0 |
| D | 12 | 218 | 35265 | 297.5 | 483 | 469 | 117.0 |
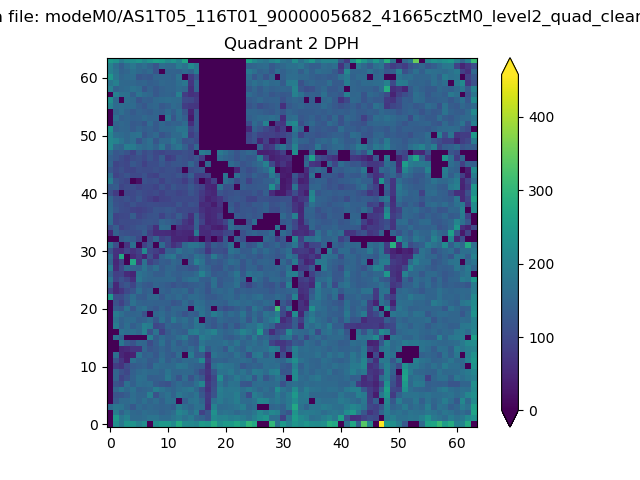
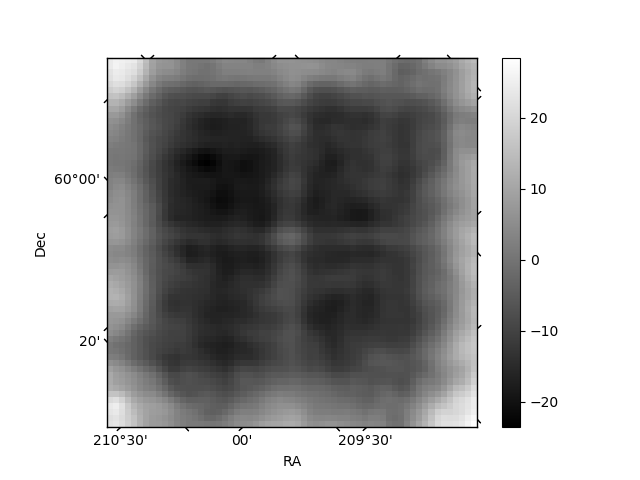
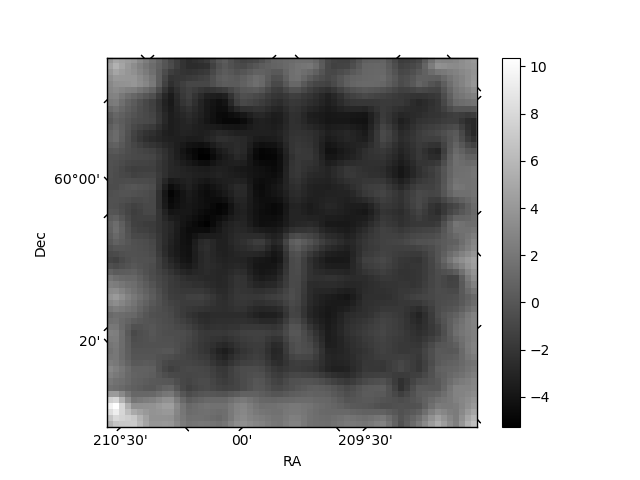
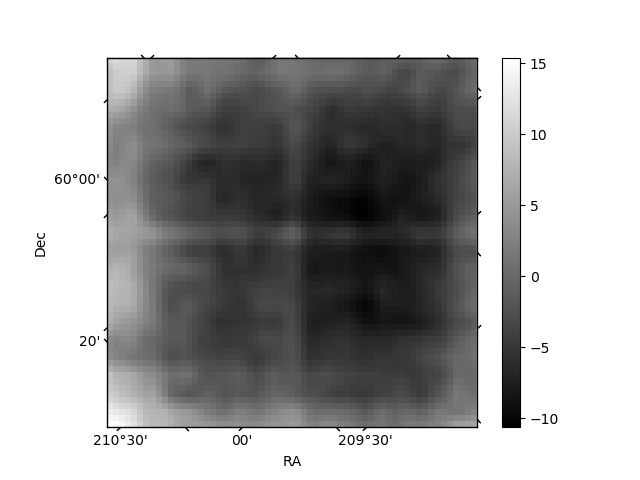
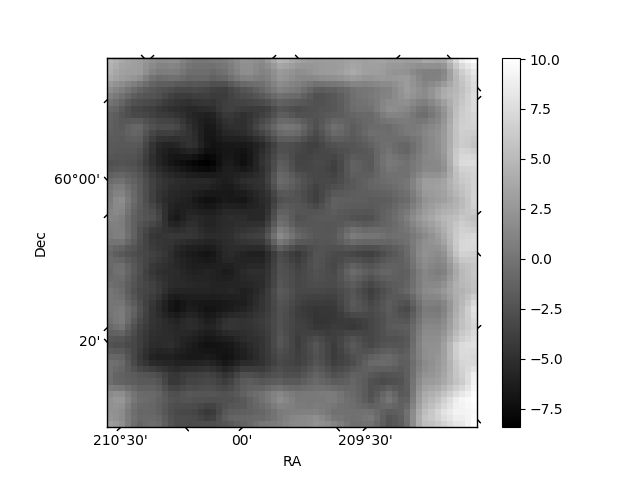
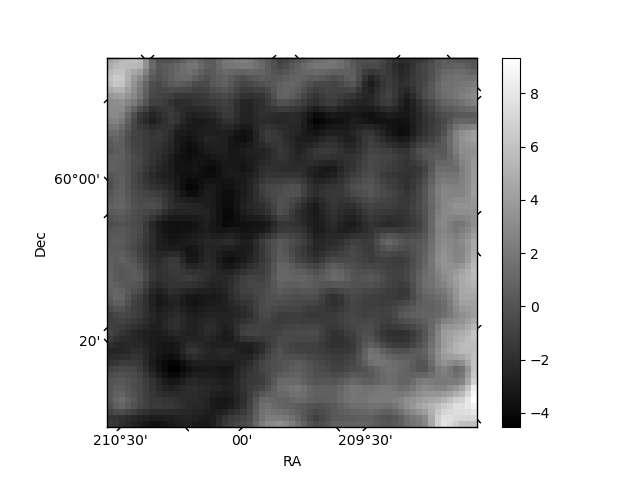
Histogram calculated using DETX and DETY for each event in the final _common_clean file
| Quadrant A | 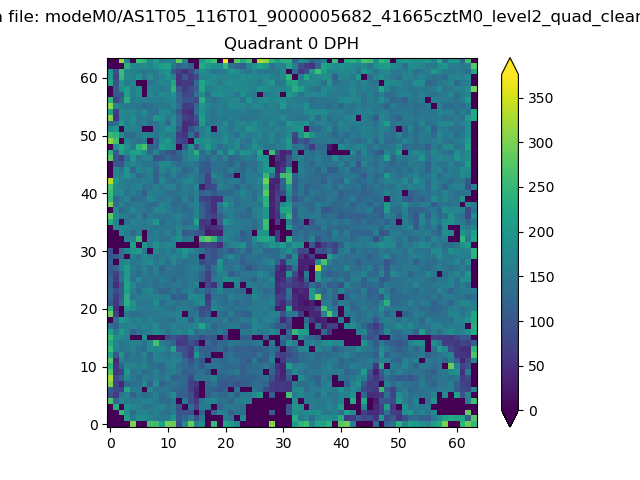 |
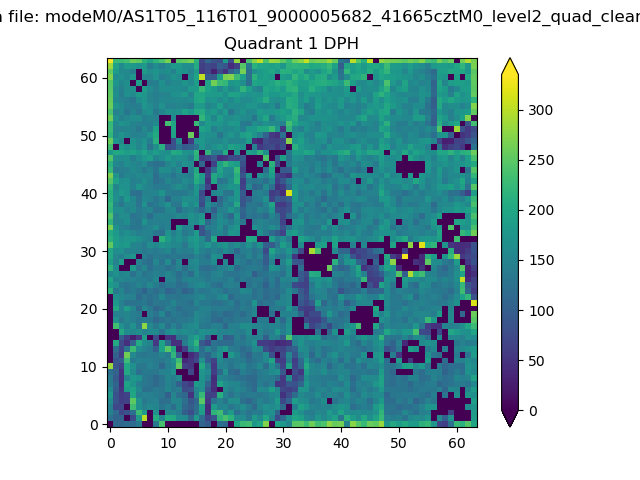 |
Quadrant B |
|---|---|---|---|
| Quadrant D | 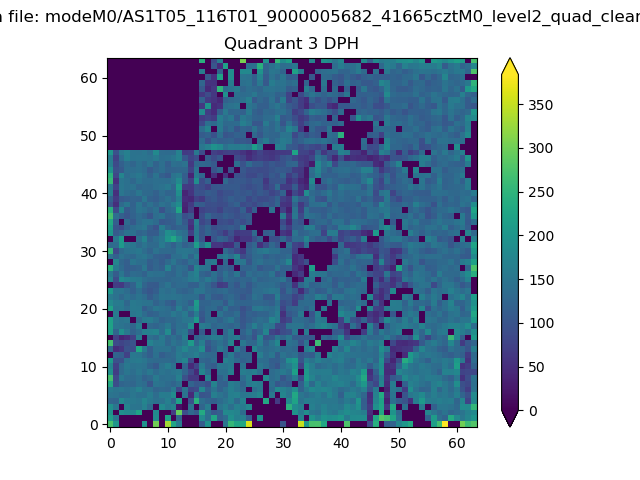 |
 |
Quadrant C |
| Plot type | Count rate plots | Images |
|---|---|---|
| Comparison with Poisson distribution Blue bars denote a histogram of data divided into 1 sec bins. Red curve is a Poisson curve with rate = median count rate of data. |
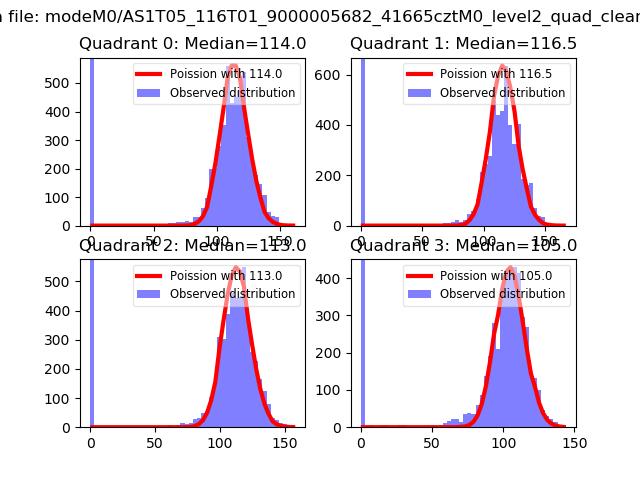 |
 |
| Quadrant-wise count rates Data is divided into 100 sec bins |
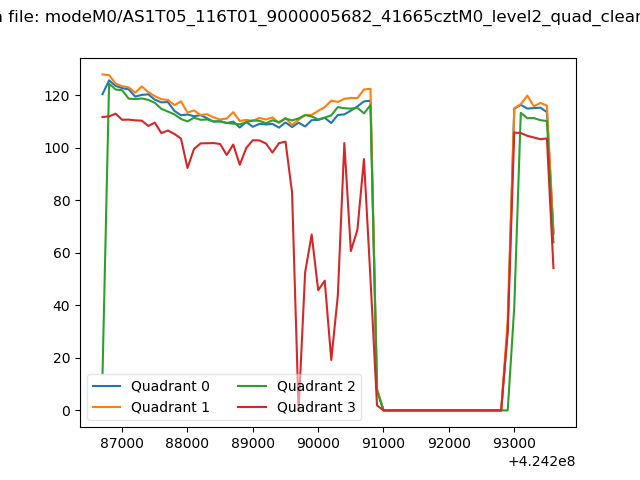 |
|
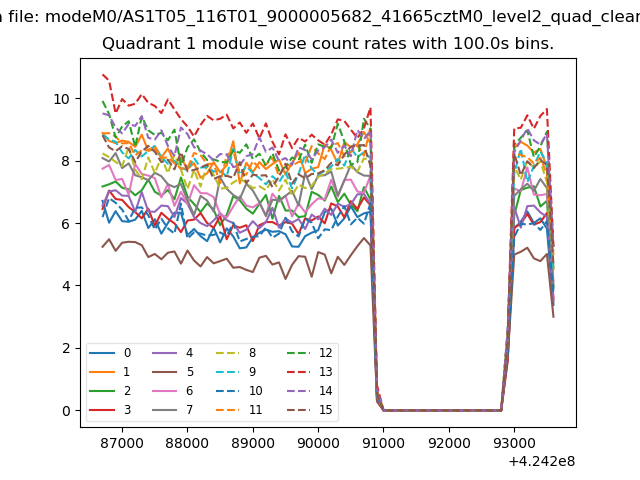
| Module-wise count rates for Quadrant A Data is divided into 100 sec bins |
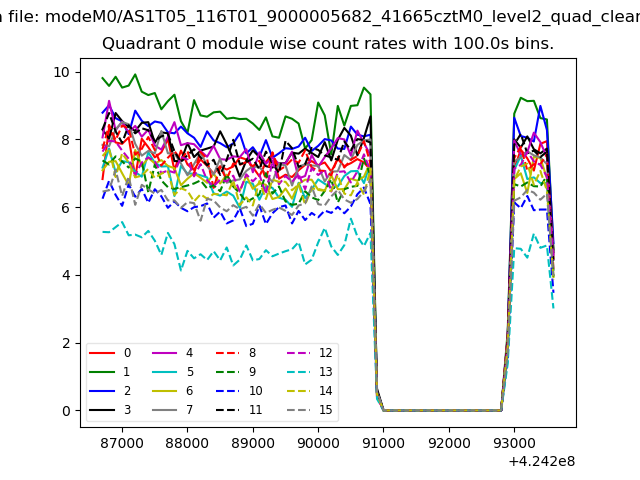 |
 |
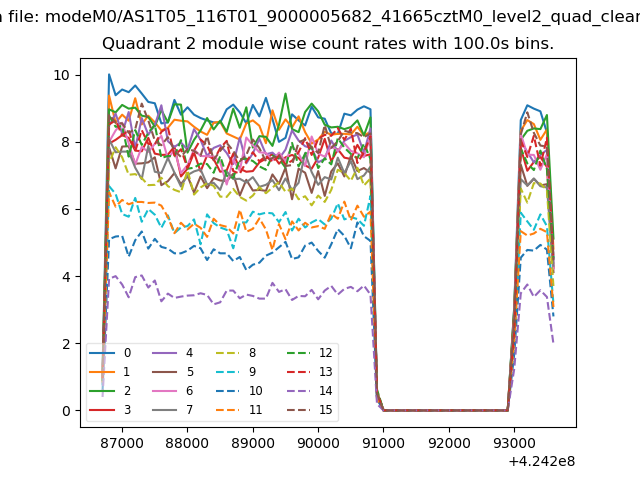
| Module-wise count rates for Quadrant B Data is divided into 100 sec bins |
 |
 |
| Module-wise count rates for Quadrant C Data is divided into 100 sec bins |
 |
 |
| Module-wise count rates for Quadrant D Data is divided into 100 sec bins |
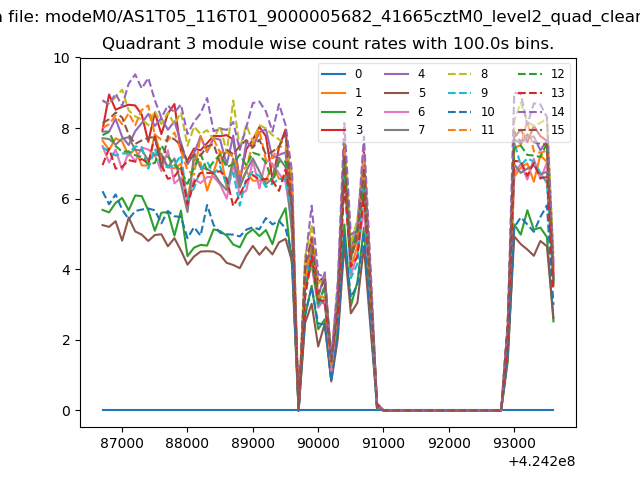 |
 |
| Parameter | Plot |
|---|---|
| CZT HV Monitor | 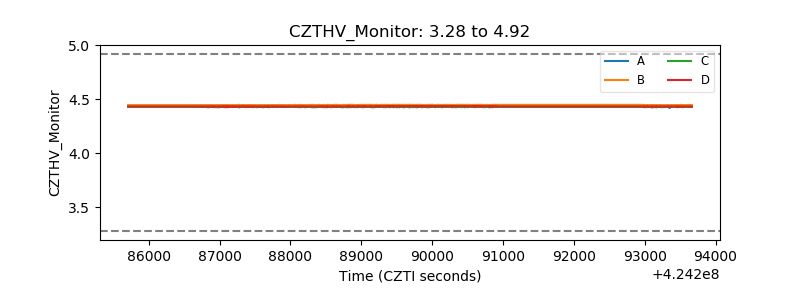 |
| D_VDD | 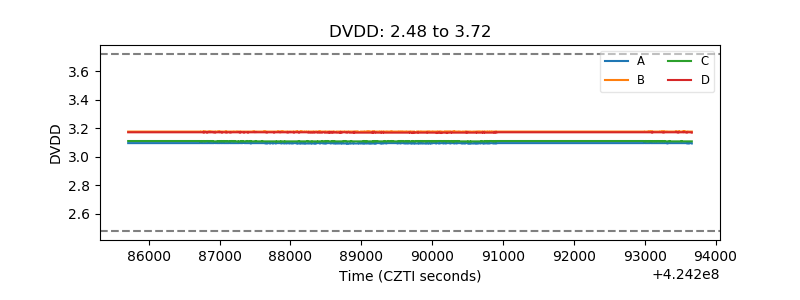 |
| Temperature 1 | 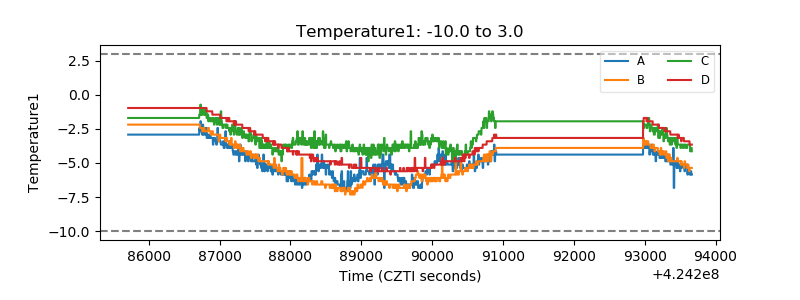 |
| Veto HV Monitor | 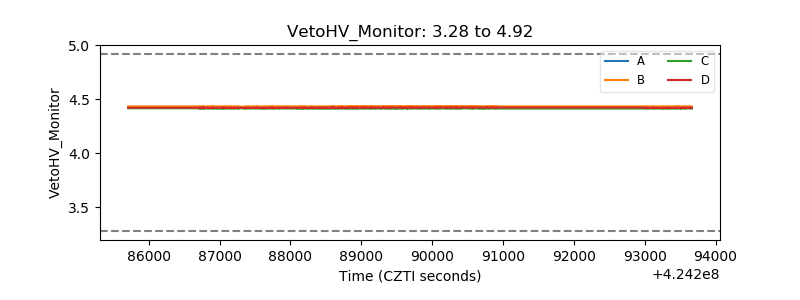 |
| Veto LLD | 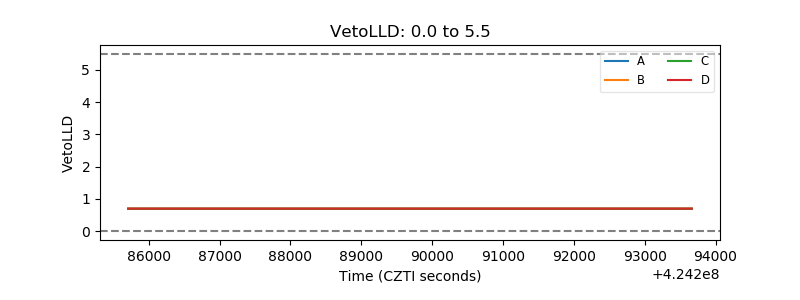 |
| Alpha Counter | 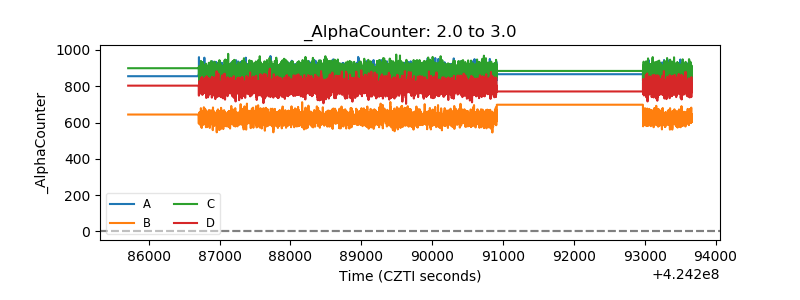 |
| _CPM_Rate | 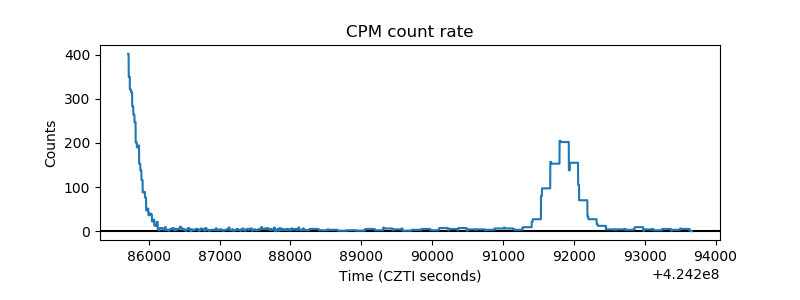 |
| CZT Counter | 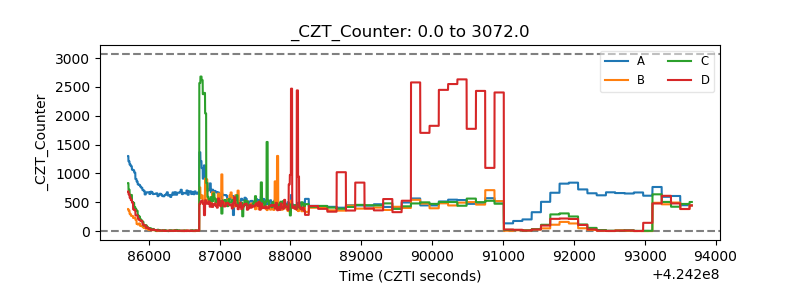 |
| +2.5 Volts monitor | 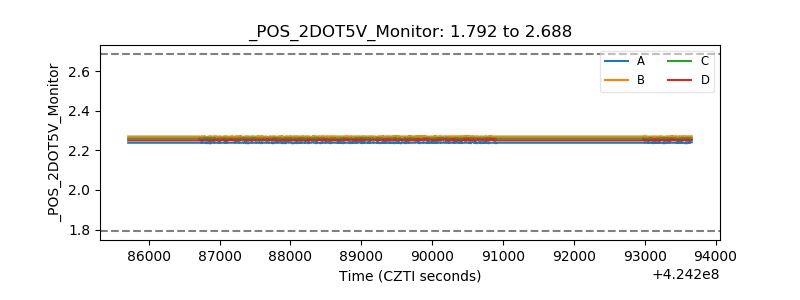 |
| +5 Volts monitor |  |
| _ROLL_ROT |  |
| _Roll_DEC | 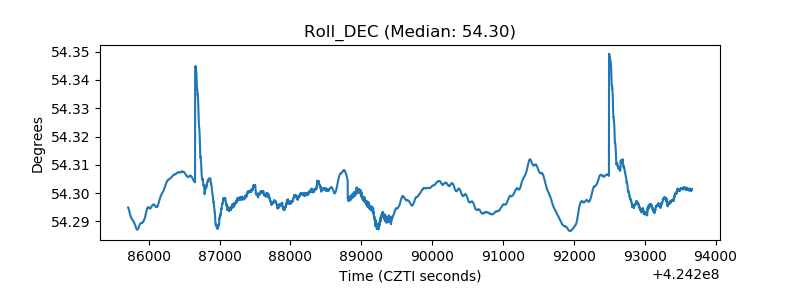 |
| _Roll_RA | 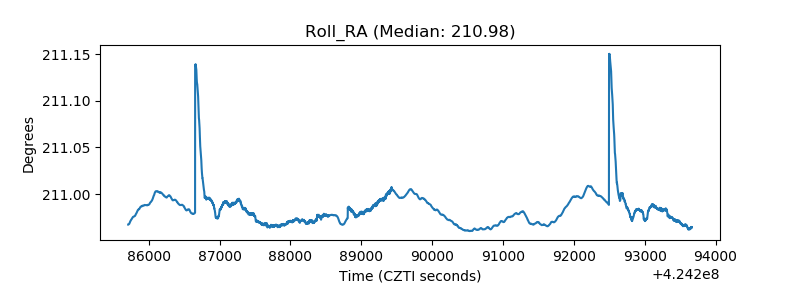 |
| Veto Counter |  |