| Param | Original file | Final file |
|---|---|---|
| Filename | modeM0/AS1T05_116T01_9000005682_41666cztM0_level2.fits | modeM0/AS1T05_116T01_9000005682_41666cztM0_level2_quad_clean.evt |
| Size (bytes) | 334,811,520 | 85,288,320 |
| Size | 319.3 MB | 81.3 MB |
| Events in quadrant A | 2,760,400 | 575,130 |
| Events in quadrant B | 2,351,534 | 585,495 |
| Events in quadrant C | 2,901,603 | 548,402 |
| Events in quadrant D | 3,969,108 | 504,080 |
| Mode M0 | |||
|---|---|---|---|
| Quadrant | BADHDUFLAG | Total packets | Discarded packets |
| A | 0 | 11559 | 2 |
| B | 0 | 10875 | 2 |
| C | 0 | 12075 | 2 |
| D | 0 | 15582 | 2 |
| Mode M9 | |||
|---|---|---|---|
| Quadrant | BADHDUFLAG | Total packets | Discarded packets |
| A | 0 | 28 | 0 |
| B | 0 | 29 | 0 |
| C | 0 | 29 | 0 |
| D | 0 | 29 | 0 |
| Mode SS | |||
|---|---|---|---|
| Quadrant | BADHDUFLAG | Total packets | Discarded packets |
| A | 0 | 108 | 0 |
| B | 0 | 108 | 0 |
| C | 0 | 108 | 0 |
| D | 0 | 108 | 0 |
| Quadrant | Total seconds | Saturated seconds | Saturation percentage |
|---|---|---|---|
| A | 5272 | 16 | 0.303490% |
| B | 5272 | 37 | 0.701821% |
| C | 5272 | 203 | 3.850531% |
| D | 5272 | 349 | 6.619879% |
Noise dominated data is calculated using 1-second bins in cleaned event files. If a bin has >2000 counts, and if more than 50% of those come from <1% of pixels, then it is considered to be noise-dominated and hence unusable.
| Quadrant | # 1 sec bins | Bins with >0 counts | Bins with >2000 counts | High rate bins dominated by noise | Noise dominated (total time) | Noise dominated (detector-on time) | Marked lightcurve |
|---|---|---|---|---|---|---|---|
| A | 7096 | 5273 | 12 | 12 | 0.17% | 0.23% | 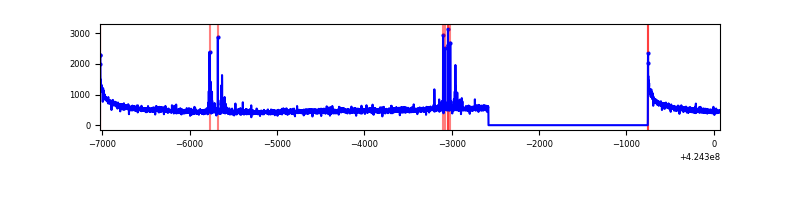 |
| B | 7096 | 5273 | 27 | 27 | 0.38% | 0.51% | 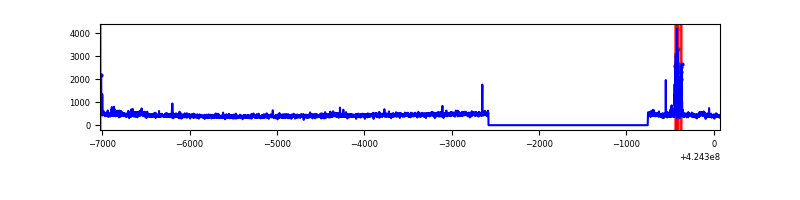 |
| C | 7096 | 5273 | 202 | 202 | 2.85% | 3.83% | 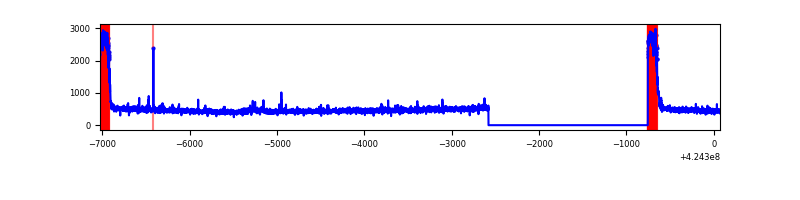 |
| D | 7096 | 5273 | 344 | 344 | 4.85% | 6.52% | 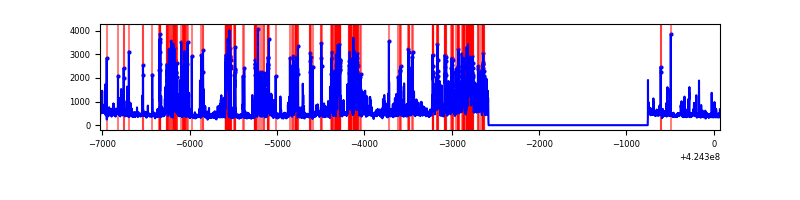 |
Top three noisy pixels from each quadrant. If the there are fewer than three noisy pixels in the level2.evt file, extra rows are filled as -1
| Pixel properties | Quadrant properties | ||||||
|---|---|---|---|---|---|---|---|
| Quadrant | DetID | PixID | Counts | Sigma | Mean | Median | Sigma |
| A | 10 | 83 | 518867 | 4542.68 | 557 | 545 | 114.1 |
| A | 13 | 248 | 71154 | 618.83 | 557 | 545 | 114.1 |
| A | 2 | 79 | 7712 | 62.81 | 557 | 545 | 114.1 |
| B | 4 | 141 | 103492 | 957.82 | 554 | 538 | 107.5 |
| B | 0 | 190 | 34961 | 320.25 | 554 | 538 | 107.5 |
| B | 0 | 245 | 27175 | 247.81 | 554 | 538 | 107.5 |
| C | 0 | 10 | 556103 | 4426.38 | 537 | 540 | 125.5 |
| C | 15 | 214 | 209850 | 1667.65 | 537 | 540 | 125.5 |
| C | 14 | 17 | 32703 | 256.25 | 537 | 540 | 125.5 |
| D | 13 | 249 | 1346299 | 10259.63 | 534 | 520 | 131.2 |
| D | 2 | 249 | 260100 | 1978.93 | 534 | 520 | 131.2 |
| D | 12 | 217 | 89478 | 678.18 | 534 | 520 | 131.2 |
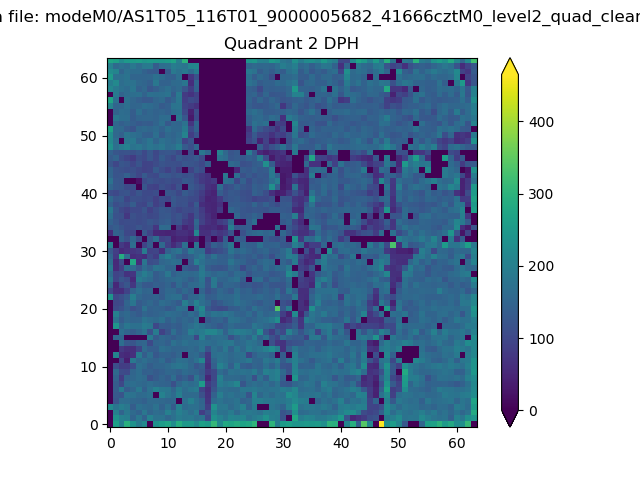
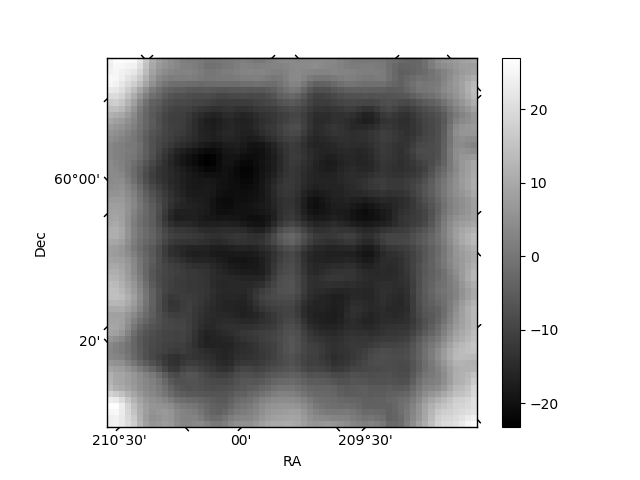
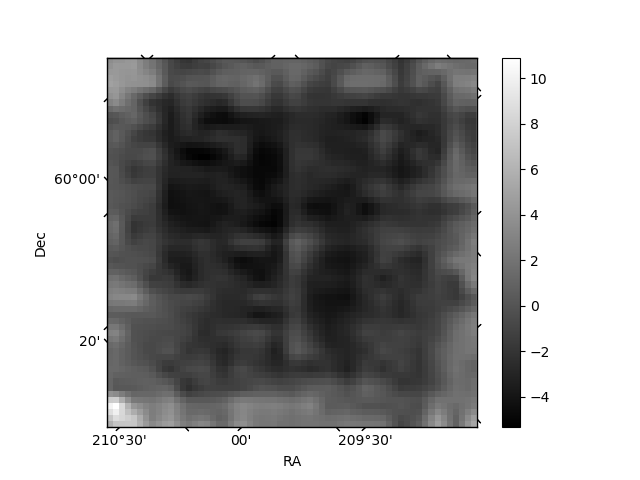
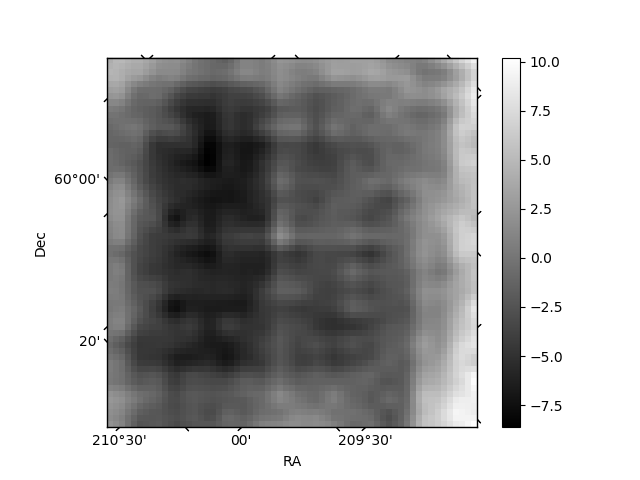
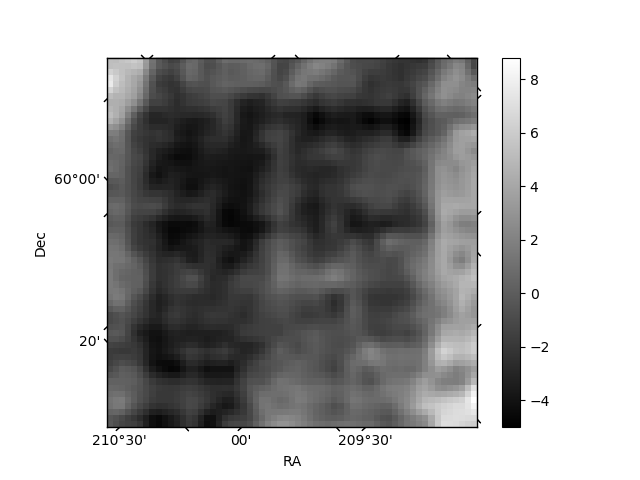
Histogram calculated using DETX and DETY for each event in the final _common_clean file
| Quadrant A | 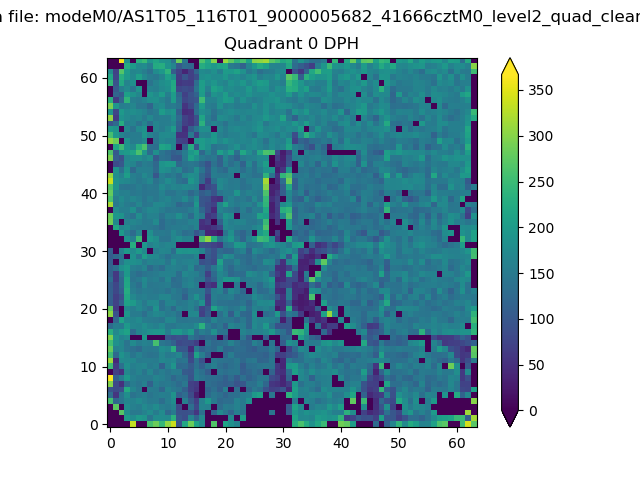 |
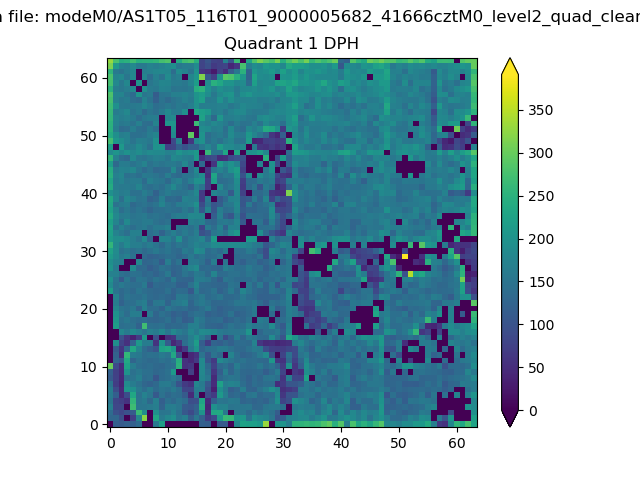 |
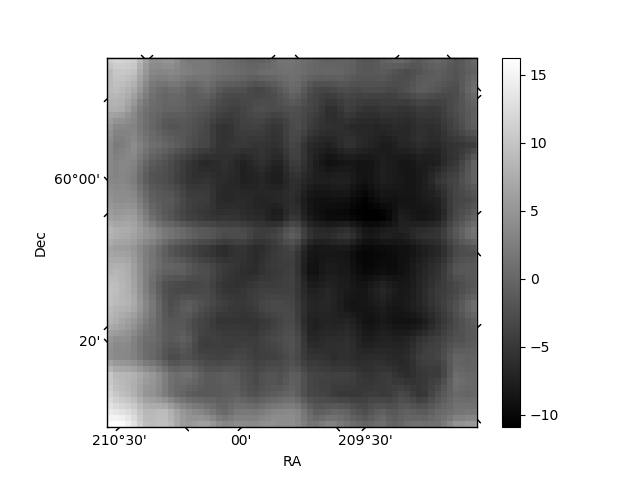
Quadrant B |
|---|---|---|---|
| Quadrant D | 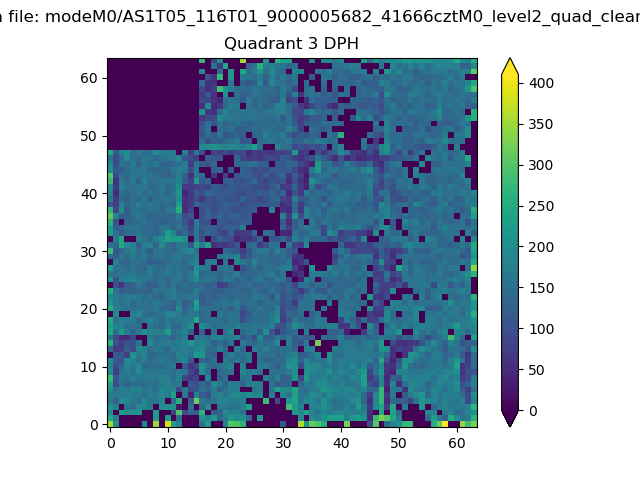 |
 |
Quadrant C |
| Plot type | Count rate plots | Images |
|---|---|---|
| Comparison with Poisson distribution Blue bars denote a histogram of data divided into 1 sec bins. Red curve is a Poisson curve with rate = median count rate of data. |
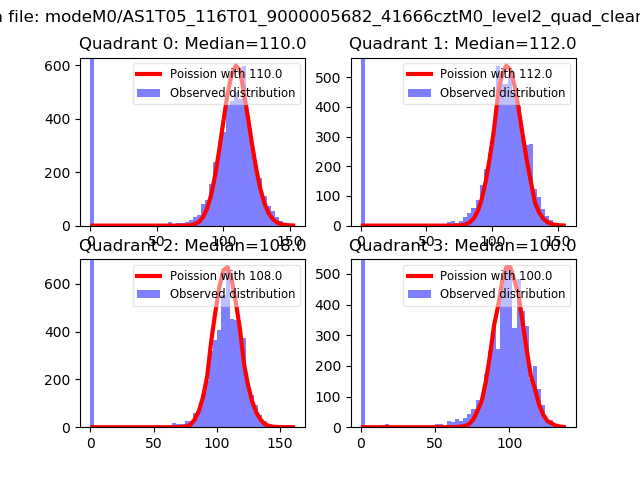 |
 |
| Quadrant-wise count rates Data is divided into 100 sec bins |
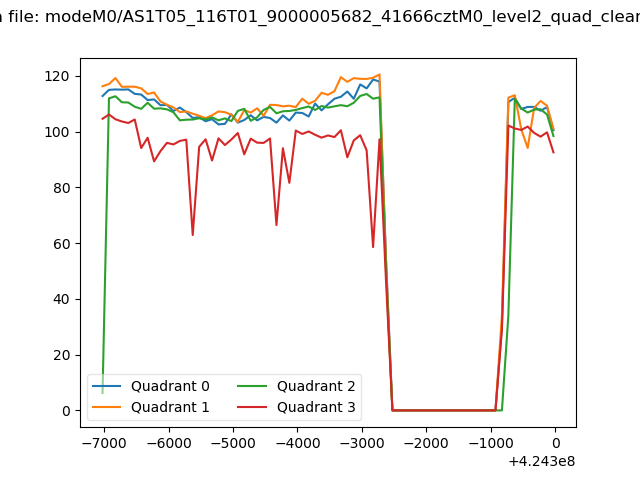 |
|
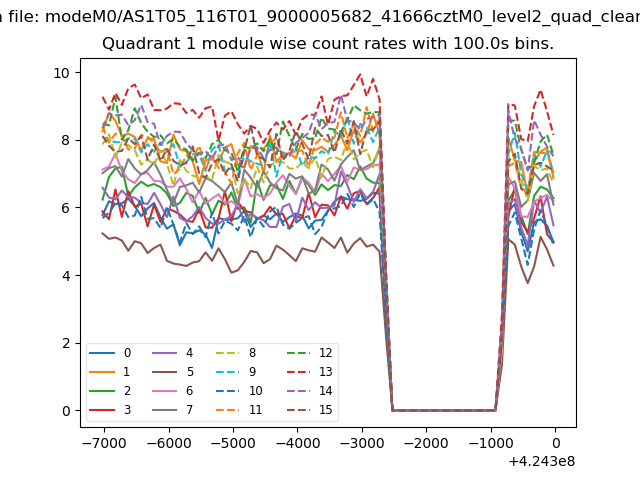
| Module-wise count rates for Quadrant A Data is divided into 100 sec bins |
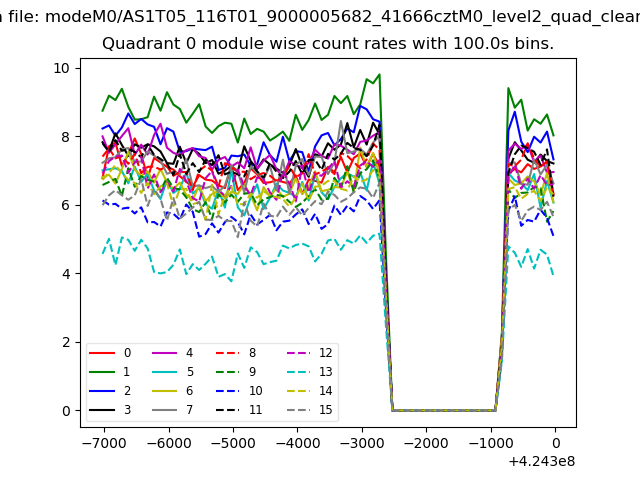 |
 |
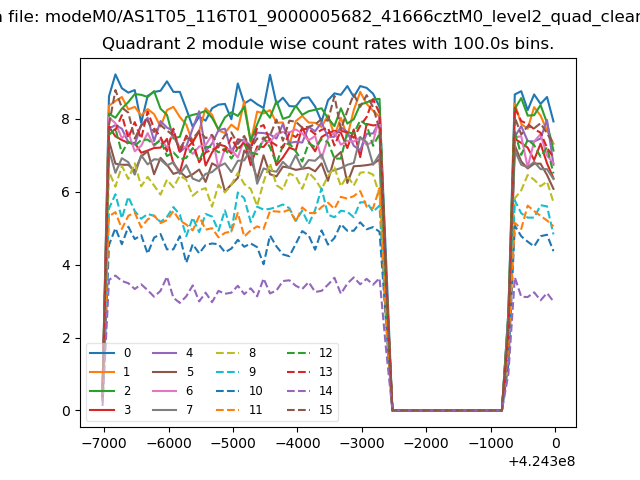
| Module-wise count rates for Quadrant B Data is divided into 100 sec bins |
 |
 |
| Module-wise count rates for Quadrant C Data is divided into 100 sec bins |
 |
 |
| Module-wise count rates for Quadrant D Data is divided into 100 sec bins |
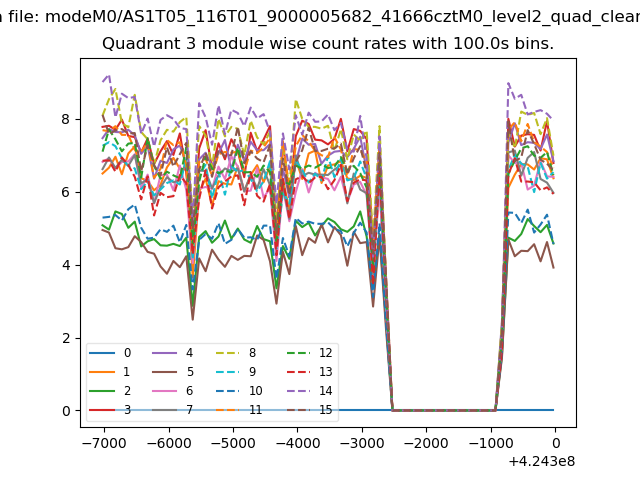 |
 |
| Parameter | Plot |
|---|---|
| CZT HV Monitor | 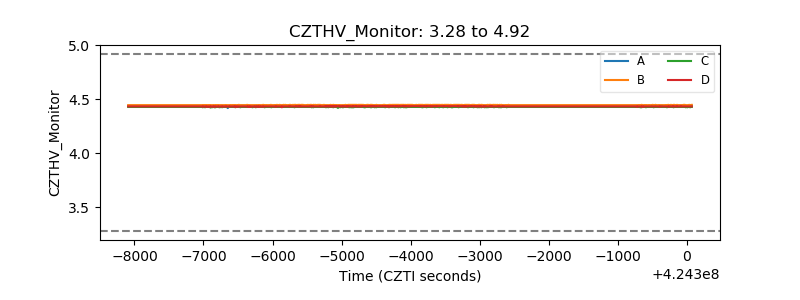 |
| D_VDD | 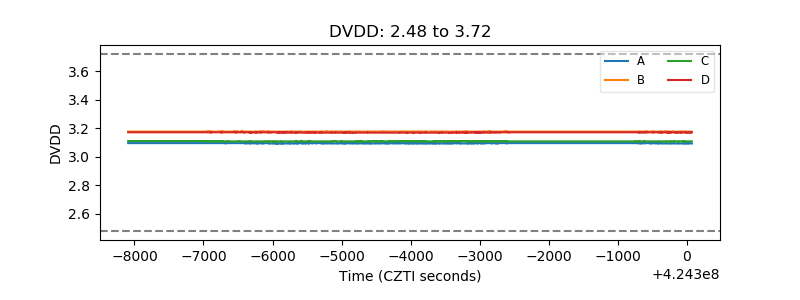 |
| Temperature 1 | 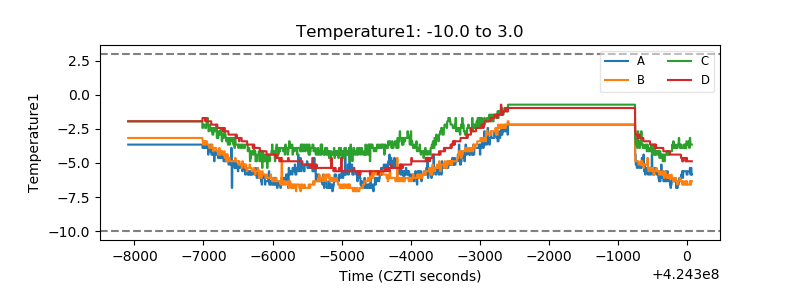 |
| Veto HV Monitor | 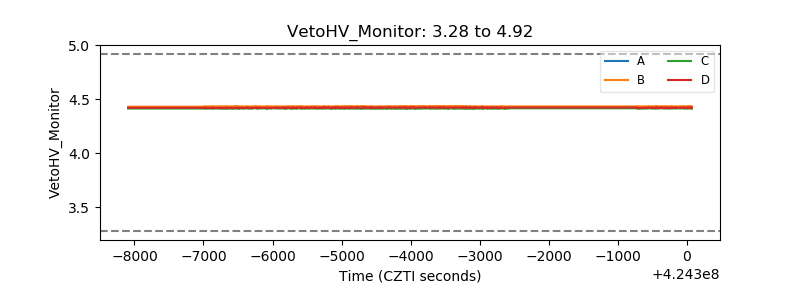 |
| Veto LLD | 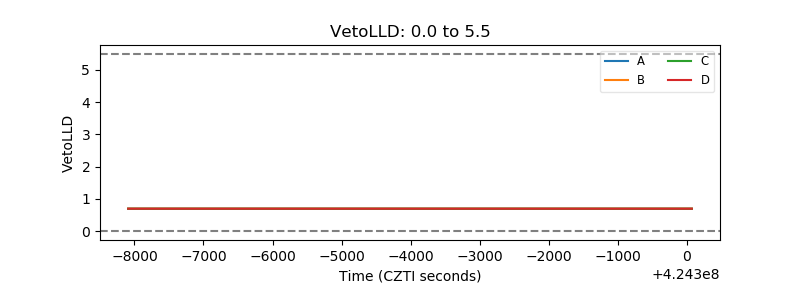 |
| Alpha Counter | 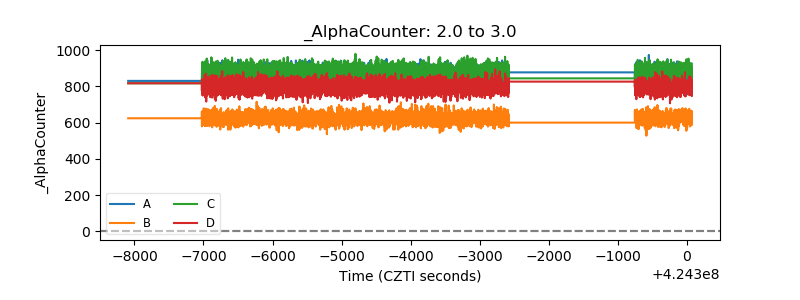 |
| _CPM_Rate | 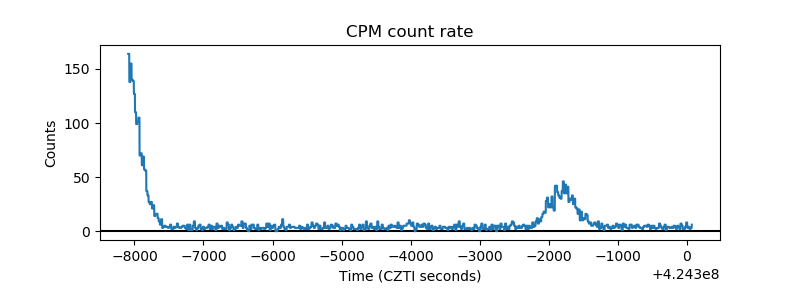 |
| CZT Counter | 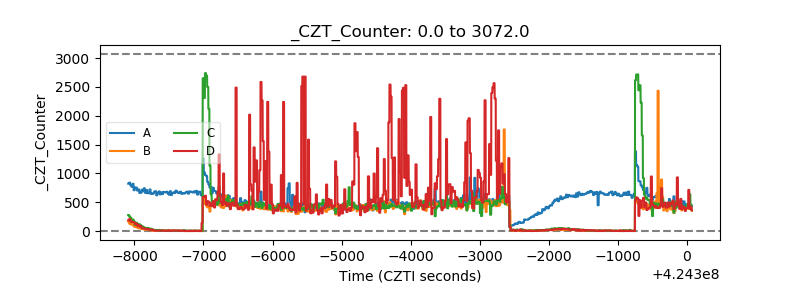 |
| +2.5 Volts monitor | 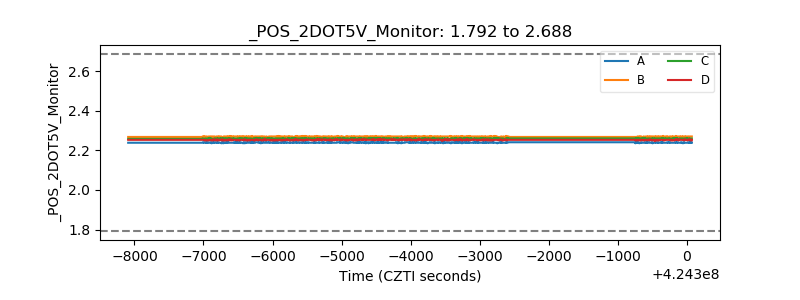 |
| +5 Volts monitor | 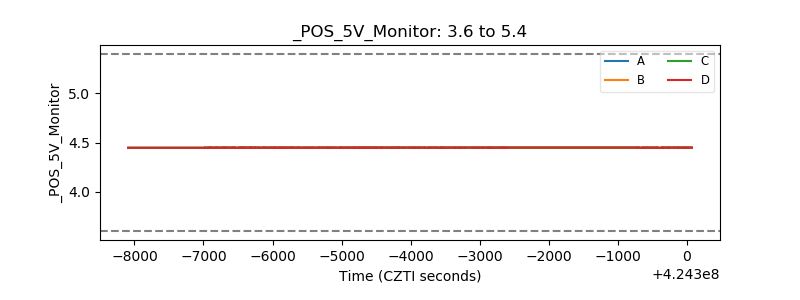 |
| _ROLL_ROT | 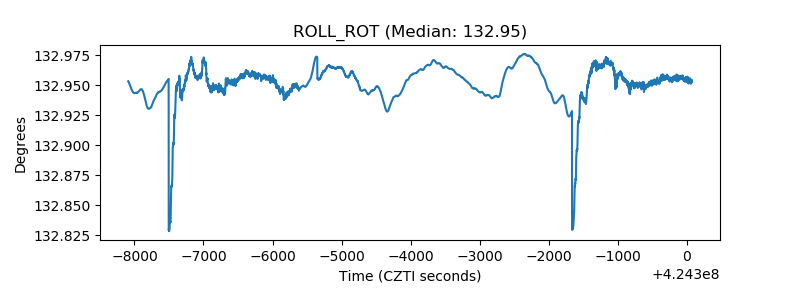 |
| _Roll_DEC | 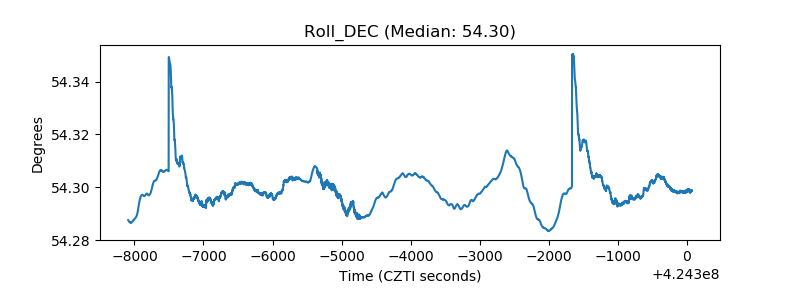 |
| _Roll_RA | 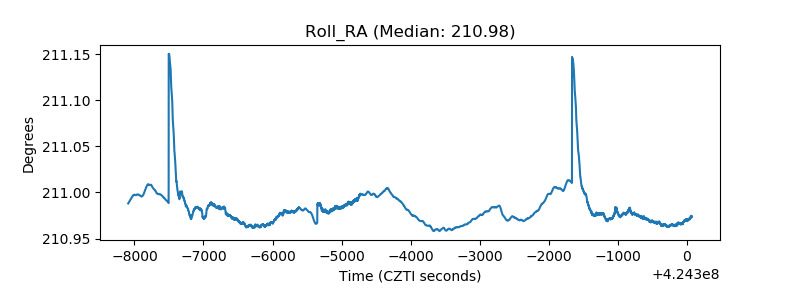 |
| Veto Counter |  |