| Param | Original file | Final file |
|---|---|---|
| Filename | modeM0/AS1T05_116T01_9000005682_41667cztM0_level2.fits | modeM0/AS1T05_116T01_9000005682_41667cztM0_level2_quad_clean.evt |
| Size (bytes) | 73,837,440 | 18,944,640 |
| Size | 70.4 MB | 18.1 MB |
| Events in quadrant A | 641,059 | 127,423 |
| Events in quadrant B | 579,033 | 126,338 |
| Events in quadrant C | 779,016 | 115,167 |
| Events in quadrant D | 639,249 | 115,704 |
| Mode M0 | |||
|---|---|---|---|
| Quadrant | BADHDUFLAG | Total packets | Discarded packets |
| A | 0 | 2700 | 1 |
| B | 0 | 2623 | 1 |
| C | 0 | 3106 | 1 |
| D | 0 | 2776 | 1 |
| Mode M9 | |||
|---|---|---|---|
| Quadrant | BADHDUFLAG | Total packets | Discarded packets |
| A | 0 | 11 | 0 |
| B | 0 | 12 | 0 |
| C | 0 | 12 | 0 |
| D | 0 | 12 | 0 |
| Mode SS | |||
|---|---|---|---|
| Quadrant | BADHDUFLAG | Total packets | Discarded packets |
| A | 0 | 24 | 0 |
| B | 0 | 24 | 0 |
| C | 0 | 24 | 0 |
| D | 0 | 24 | 0 |
| Quadrant | Total seconds | Saturated seconds | Saturation percentage |
|---|---|---|---|
| A | 1180 | 4 | 0.338983% |
| B | 1180 | 33 | 2.796610% |
| C | 1180 | 101 | 8.559322% |
| D | 1180 | 23 | 1.949153% |
Noise dominated data is calculated using 1-second bins in cleaned event files. If a bin has >2000 counts, and if more than 50% of those come from <1% of pixels, then it is considered to be noise-dominated and hence unusable.
| Quadrant | # 1 sec bins | Bins with >0 counts | Bins with >2000 counts | High rate bins dominated by noise | Noise dominated (total time) | Noise dominated (detector-on time) | Marked lightcurve |
|---|---|---|---|---|---|---|---|
| A | 1180 | 1180 | 2 | 2 | 0.17% | 0.17% | 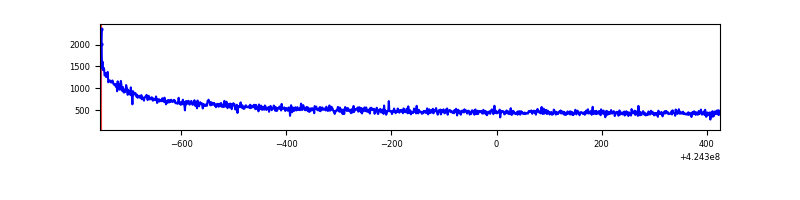 |
| B | 1180 | 1180 | 26 | 26 | 2.20% | 2.20% | 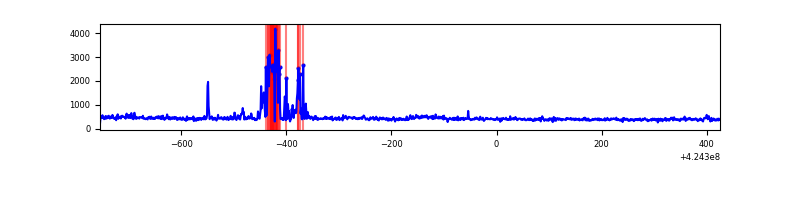 |
| C | 1180 | 1180 | 101 | 101 | 8.56% | 8.56% | 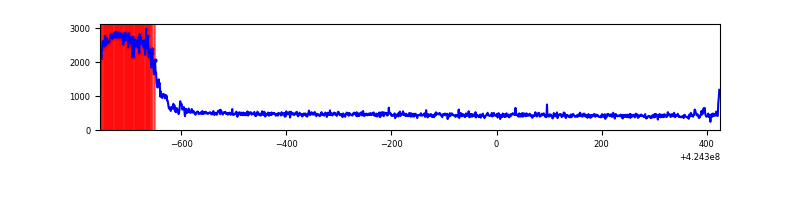 |
| D | 1180 | 1180 | 18 | 18 | 1.53% | 1.53% | 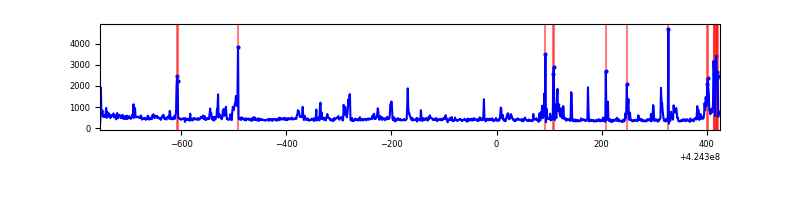 |
Top three noisy pixels from each quadrant. If the there are fewer than three noisy pixels in the level2.evt file, extra rows are filled as -1
| Pixel properties | Quadrant properties | ||||||
|---|---|---|---|---|---|---|---|
| Quadrant | DetID | PixID | Counts | Sigma | Mean | Median | Sigma |
| A | 10 | 83 | 174175 | 6618.91 | 119 | 117 | 26.3 |
| A | 13 | 6 | 2118 | 76.09 | 119 | 117 | 26.3 |
| A | 10 | 67 | 2061 | 73.92 | 119 | 117 | 26.3 |
| B | 4 | 141 | 96580 | 3973.85 | 118 | 114 | 24.3 |
| B | 0 | 190 | 7632 | 309.7 | 118 | 114 | 24.3 |
| B | 0 | 245 | 7502 | 304.34 | 118 | 114 | 24.3 |
| C | 0 | 10 | 274108 | 9677.56 | 114 | 114 | 28.3 |
| C | 15 | 214 | 49682 | 1750.76 | 114 | 114 | 28.3 |
| C | 14 | 17 | 8799 | 306.76 | 114 | 114 | 28.3 |
| D | 13 | 249 | 126386 | 4066.75 | 118 | 115 | 31.0 |
| D | 2 | 249 | 30654 | 983.55 | 118 | 115 | 31.0 |
| D | 10 | 199 | 6491 | 205.35 | 118 | 115 | 31.0 |
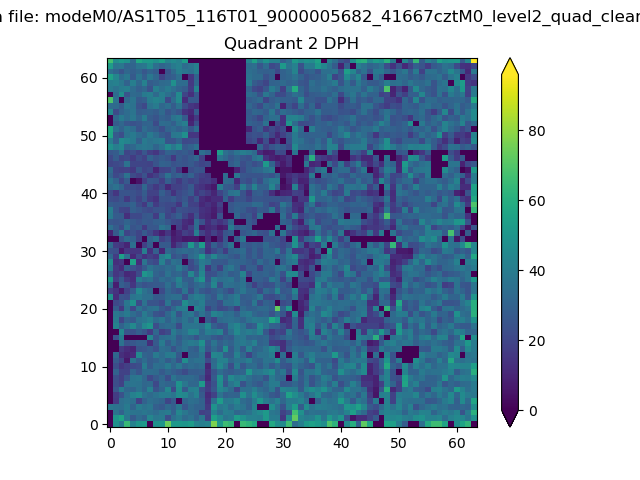
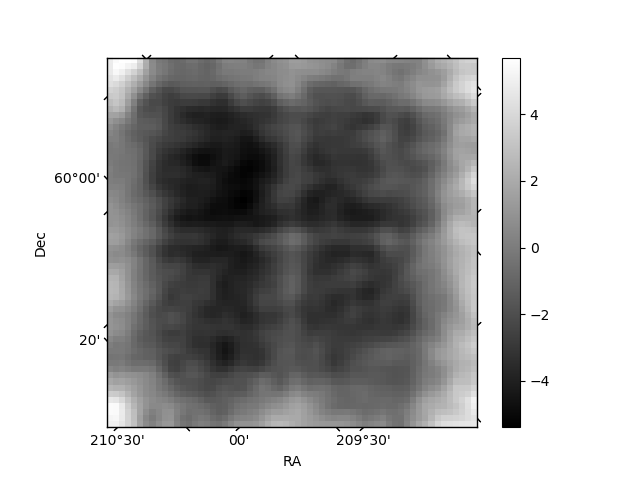
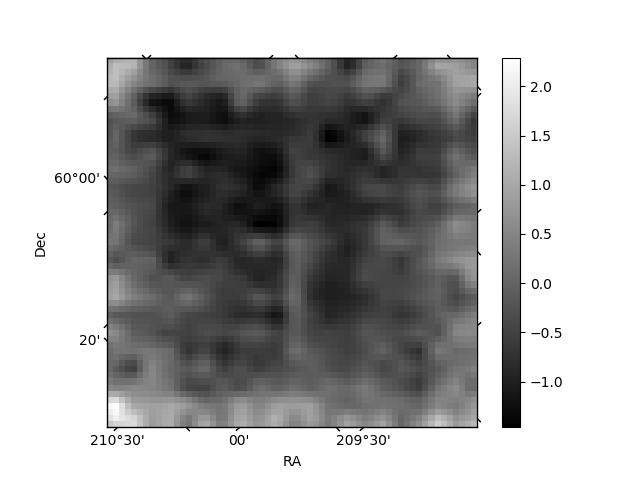
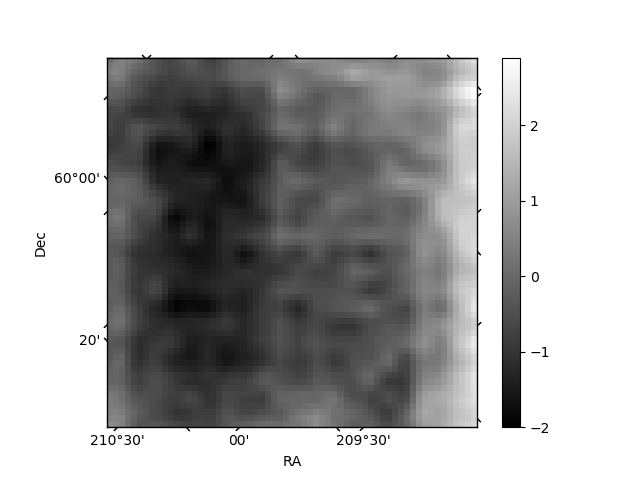
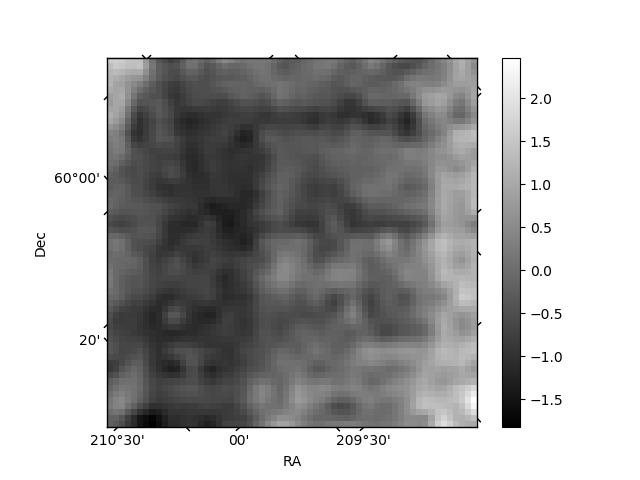
Histogram calculated using DETX and DETY for each event in the final _common_clean file
| Quadrant A | 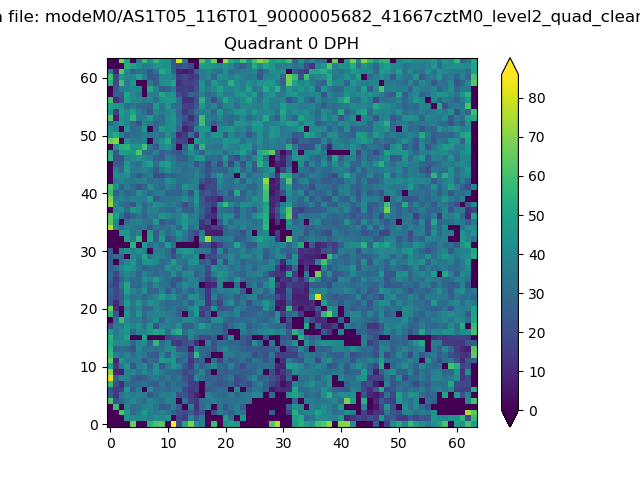 |
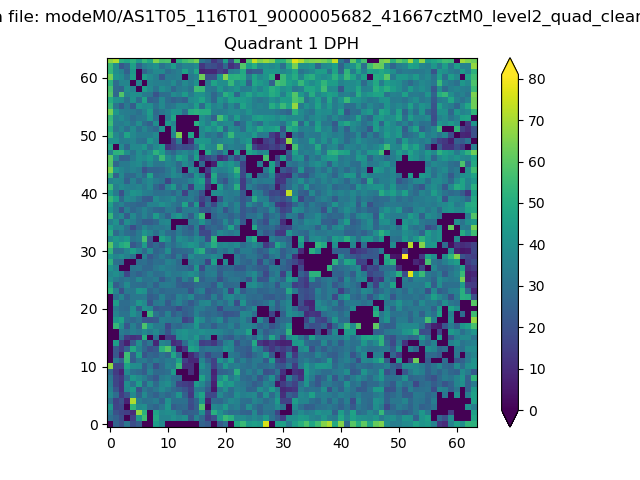 |
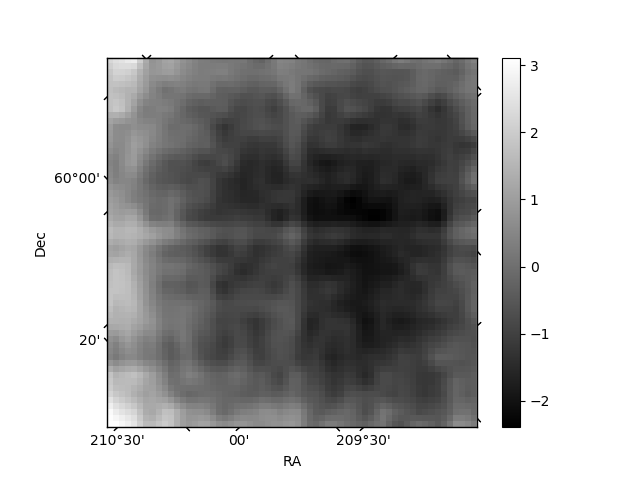
Quadrant B |
|---|---|---|---|
| Quadrant D | 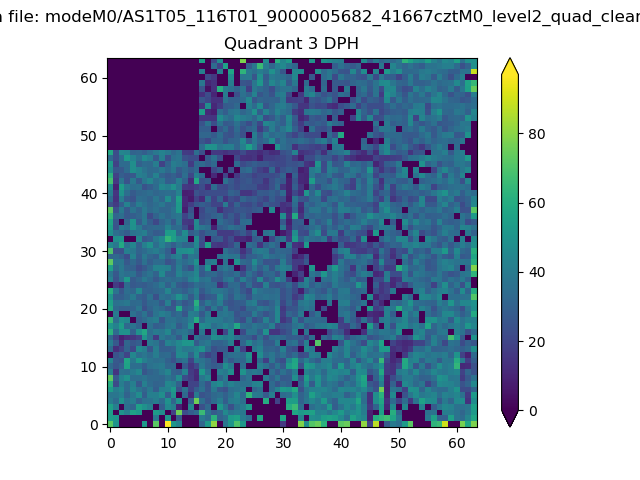 |
 |
Quadrant C |
| Plot type | Count rate plots | Images |
|---|---|---|
| Comparison with Poisson distribution Blue bars denote a histogram of data divided into 1 sec bins. Red curve is a Poisson curve with rate = median count rate of data. |
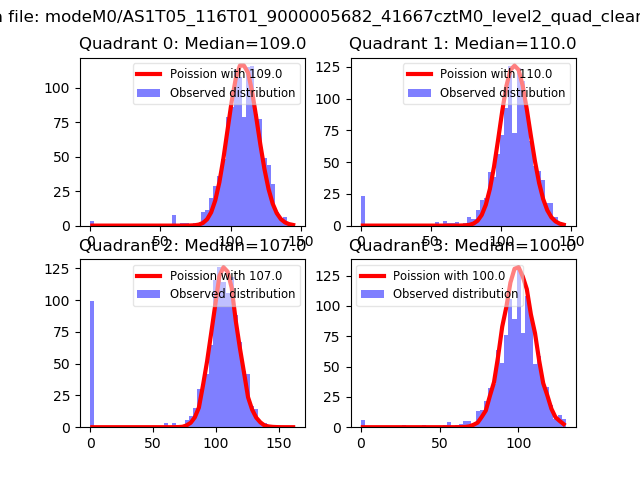 |
 |
| Quadrant-wise count rates Data is divided into 100 sec bins |
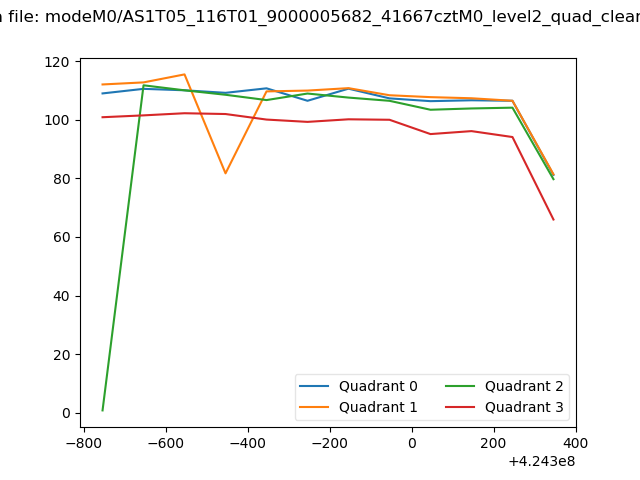 |
|
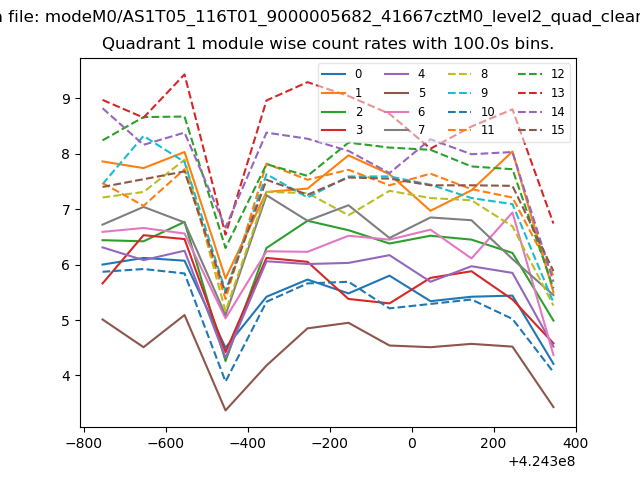
| Module-wise count rates for Quadrant A Data is divided into 100 sec bins |
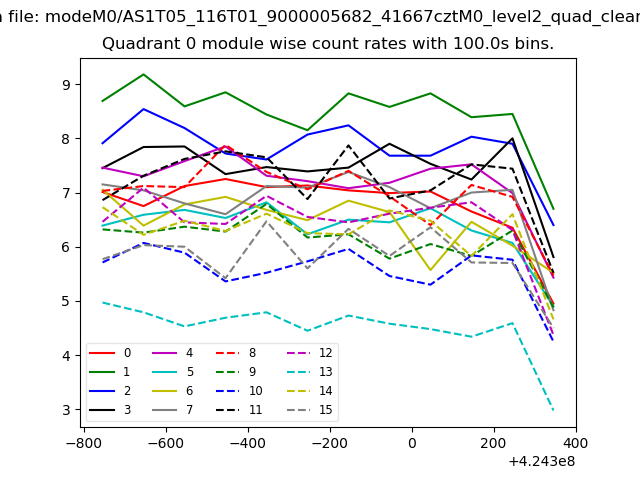 |
 |
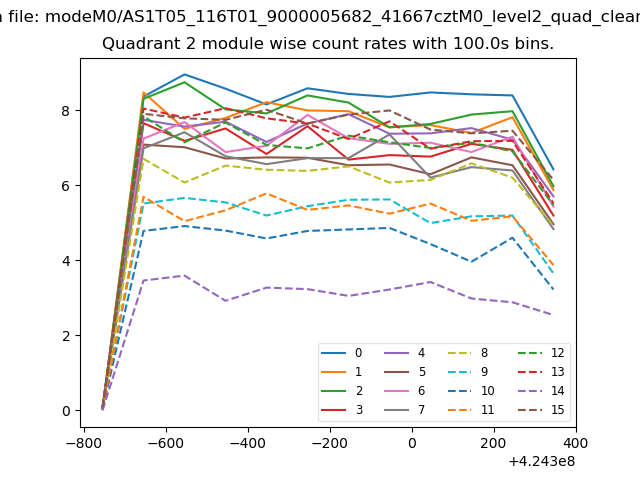
| Module-wise count rates for Quadrant B Data is divided into 100 sec bins |
 |
 |
| Module-wise count rates for Quadrant C Data is divided into 100 sec bins |
 |
 |
| Module-wise count rates for Quadrant D Data is divided into 100 sec bins |
 |
 |
| Parameter | Plot |
|---|---|
| CZT HV Monitor |  |
| D_VDD | 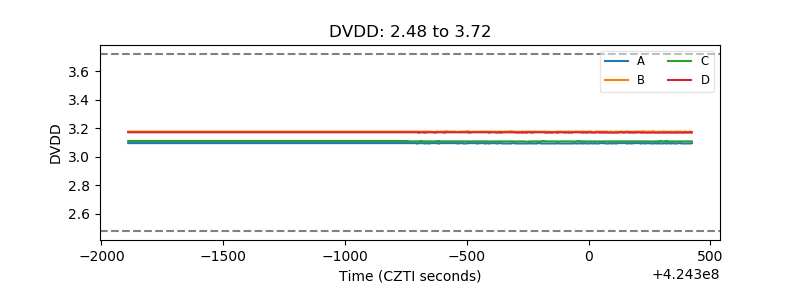 |
| Temperature 1 | 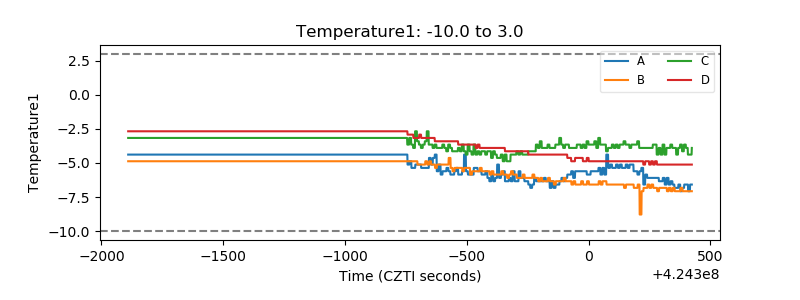 |
| Veto HV Monitor | 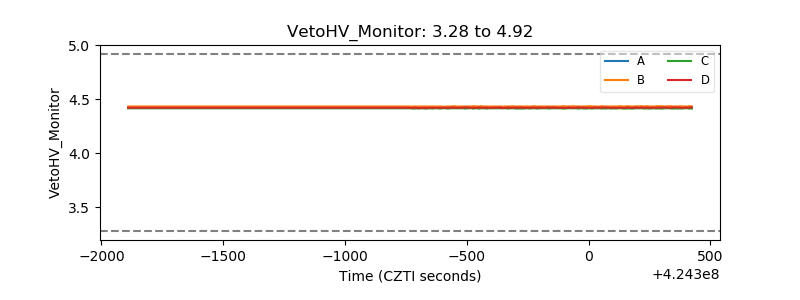 |
| Veto LLD | 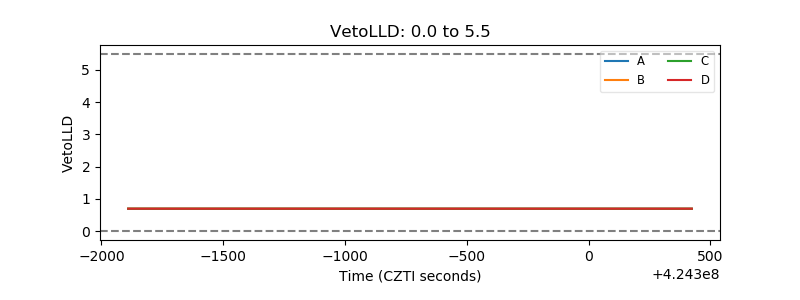 |
| Alpha Counter | 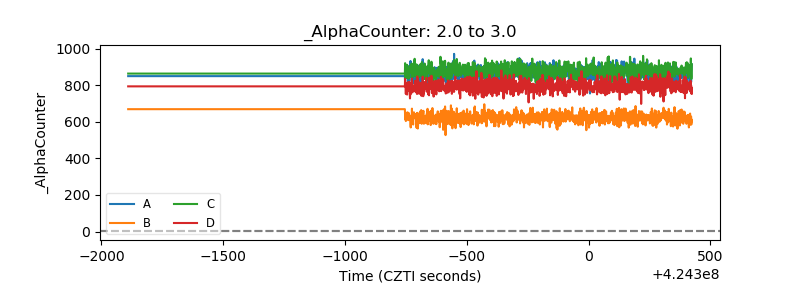 |
| _CPM_Rate | 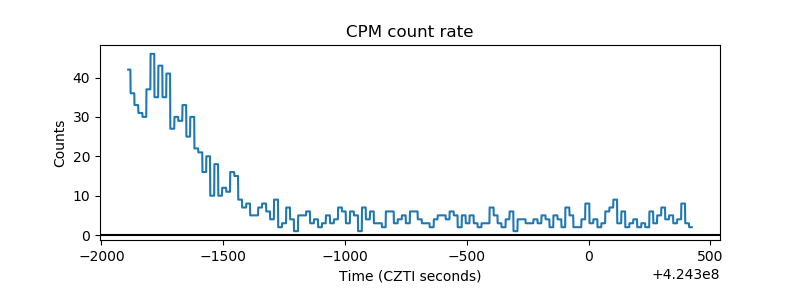 |
| CZT Counter | 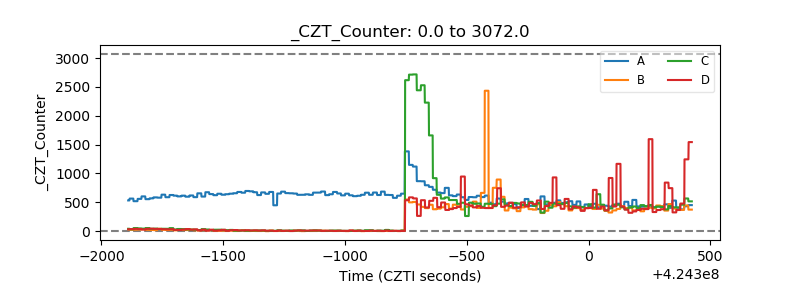 |
| +2.5 Volts monitor | 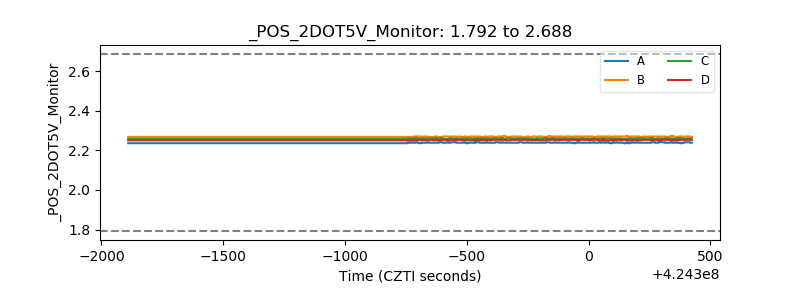 |
| +5 Volts monitor |  |
| _ROLL_ROT | 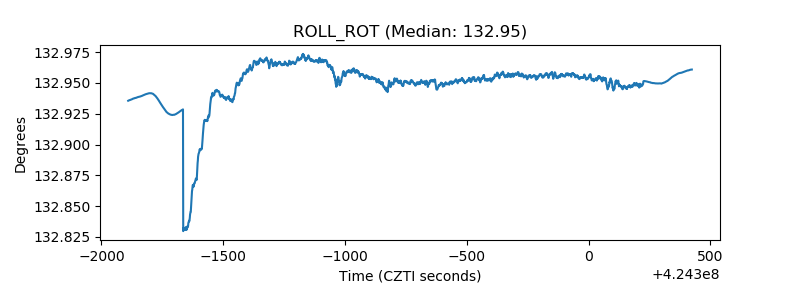 |
| _Roll_DEC | 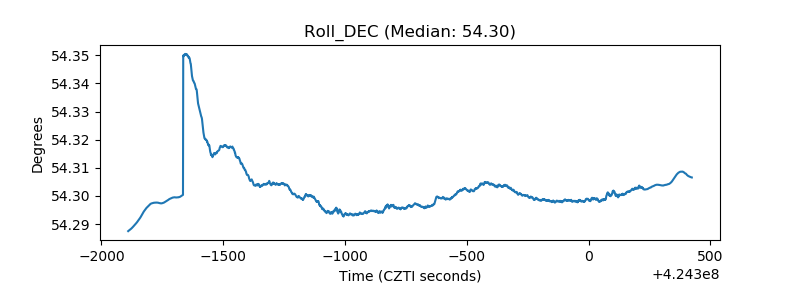 |
| _Roll_RA | 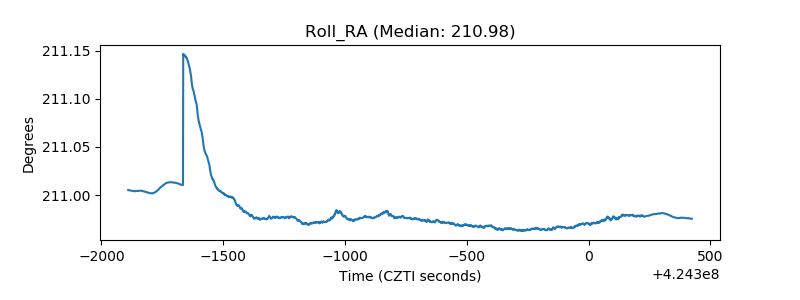 |
| Veto Counter | 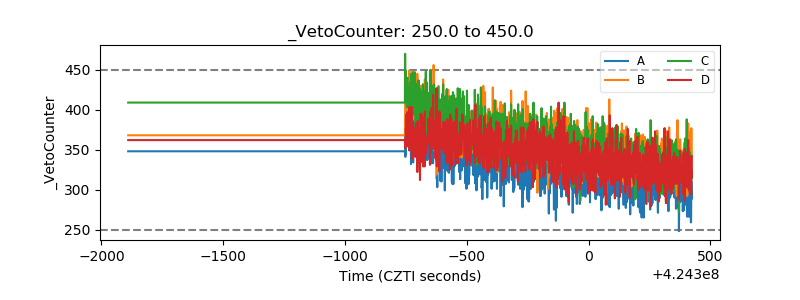 |