| Param | Original file | Final file |
|---|---|---|
| Filename | modeM0/AS1T05_117T01_9000005684_41667cztM0_level2.fits | modeM0/AS1T05_117T01_9000005684_41667cztM0_level2_quad_clean.evt |
| Size (bytes) | 246,965,760 | 68,618,880 |
| Size | 235.5 MB | 65.4 MB |
| Events in quadrant A | 2,150,527 | 456,528 |
| Events in quadrant B | 1,870,056 | 467,199 |
| Events in quadrant C | 2,211,478 | 445,410 |
| Events in quadrant D | 2,580,658 | 411,449 |
| Mode SS | |||
|---|---|---|---|
| Quadrant | BADHDUFLAG | Total packets | Discarded packets |
| A | 0 | 88 | 0 |
| B | 0 | 88 | 0 |
| C | 0 | 88 | 0 |
| D | 0 | 88 | 0 |
| Mode M9 | |||
|---|---|---|---|
| Quadrant | BADHDUFLAG | Total packets | Discarded packets |
| A | 0 | 14 | 0 |
| B | 0 | 14 | 0 |
| C | 0 | 14 | 0 |
| D | 0 | 14 | 0 |
| Mode M0 | |||
|---|---|---|---|
| Quadrant | BADHDUFLAG | Total packets | Discarded packets |
| A | 0 | 8992 | 1 |
| B | 0 | 8557 | 1 |
| C | 0 | 9342 | 1 |
| D | 0 | 10642 | 1 |
| Quadrant | Total seconds | Saturated seconds | Saturation percentage |
|---|---|---|---|
| A | 4212 | 7 | 0.166192% |
| B | 4212 | 5 | 0.118708% |
| C | 4212 | 73 | 1.733143% |
| D | 4212 | 87 | 2.065527% |
Noise dominated data is calculated using 1-second bins in cleaned event files. If a bin has >2000 counts, and if more than 50% of those come from <1% of pixels, then it is considered to be noise-dominated and hence unusable.
| Quadrant | # 1 sec bins | Bins with >0 counts | Bins with >2000 counts | High rate bins dominated by noise | Noise dominated (total time) | Noise dominated (detector-on time) | Marked lightcurve |
|---|---|---|---|---|---|---|---|
| A | 5675 | 4213 | 1 | 1 | 0.02% | 0.02% | 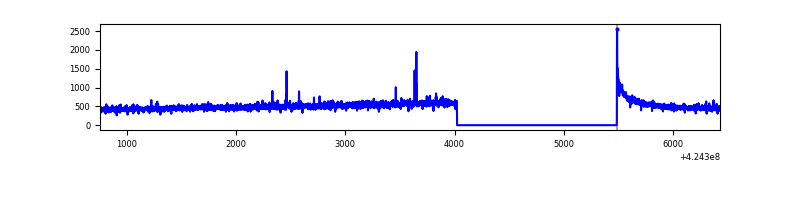 |
| B | 5675 | 4213 | 0 | 0 | 0.00% | 0.00% | 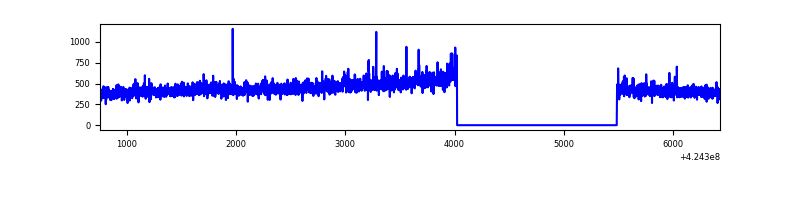 |
| C | 5675 | 4213 | 80 | 80 | 1.41% | 1.90% | 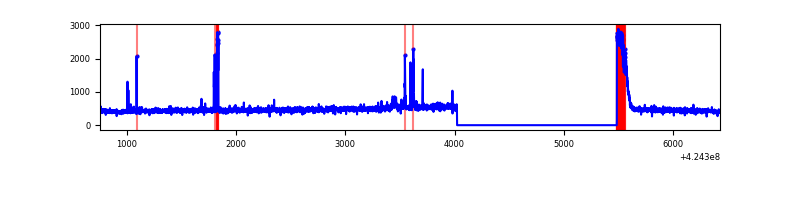 |
| D | 5675 | 4213 | 95 | 95 | 1.67% | 2.25% | 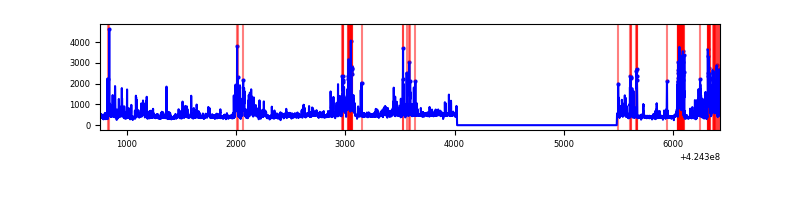 |
Top three noisy pixels from each quadrant. If the there are fewer than three noisy pixels in the level2.evt file, extra rows are filled as -1
| Pixel properties | Quadrant properties | ||||||
|---|---|---|---|---|---|---|---|
| Quadrant | DetID | PixID | Counts | Sigma | Mean | Median | Sigma |
| A | 10 | 83 | 348066 | 3625.57 | 458 | 447 | 95.9 |
| A | 2 | 79 | 13097 | 131.94 | 458 | 447 | 95.9 |
| A | 13 | 248 | 12334 | 123.98 | 458 | 447 | 95.9 |
| B | 0 | 245 | 37291 | 411.77 | 455 | 442 | 89.5 |
| B | 0 | 190 | 21312 | 233.21 | 455 | 442 | 89.5 |
| B | 12 | 111 | 11506 | 123.64 | 455 | 442 | 89.5 |
| C | 0 | 10 | 217265 | 2082.24 | 443 | 445 | 104.1 |
| C | 15 | 214 | 167921 | 1608.36 | 443 | 445 | 104.1 |
| C | 14 | 17 | 47919 | 455.92 | 443 | 445 | 104.1 |
| D | 13 | 249 | 603880 | 5466.91 | 443 | 430 | 110.4 |
| D | 2 | 249 | 214606 | 1940.31 | 443 | 430 | 110.4 |
| D | 10 | 199 | 21430 | 190.25 | 443 | 430 | 110.4 |
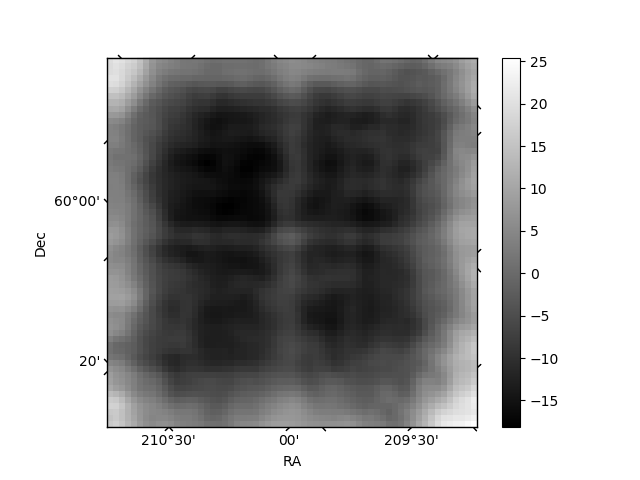
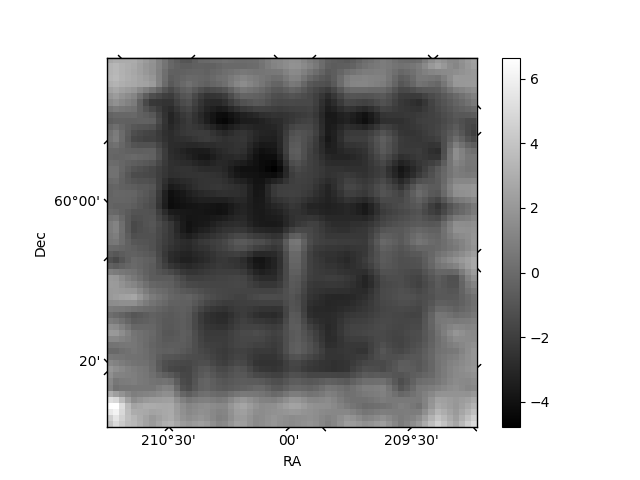
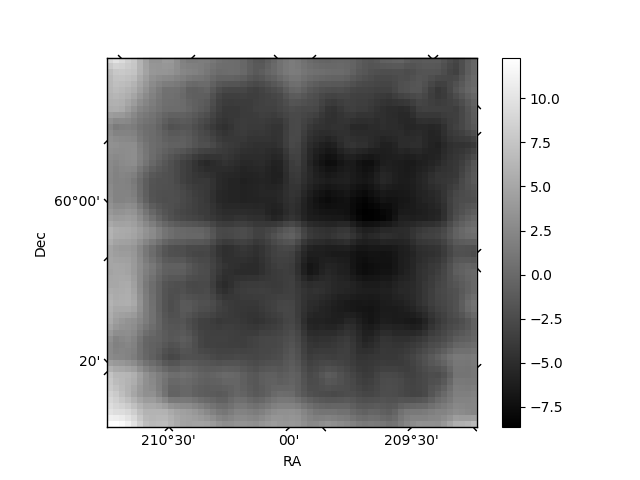
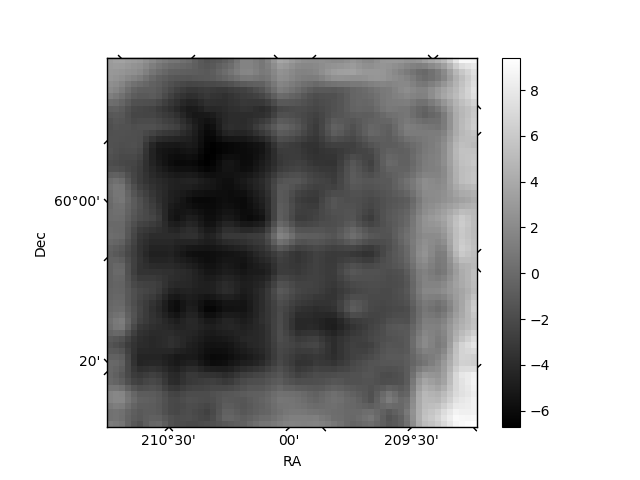
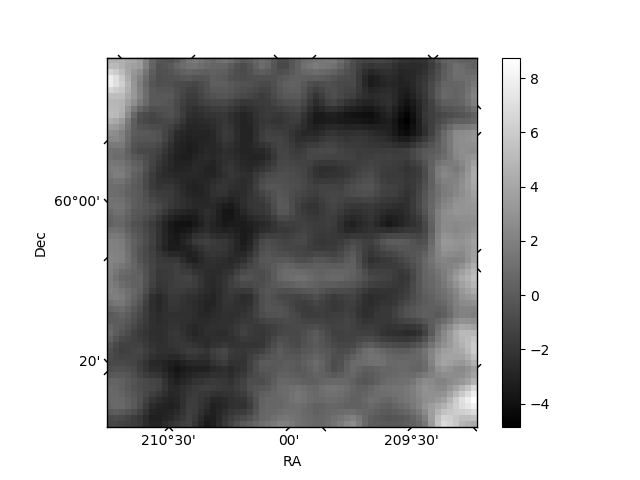
Histogram calculated using DETX and DETY for each event in the final _common_clean file
| Quadrant A | 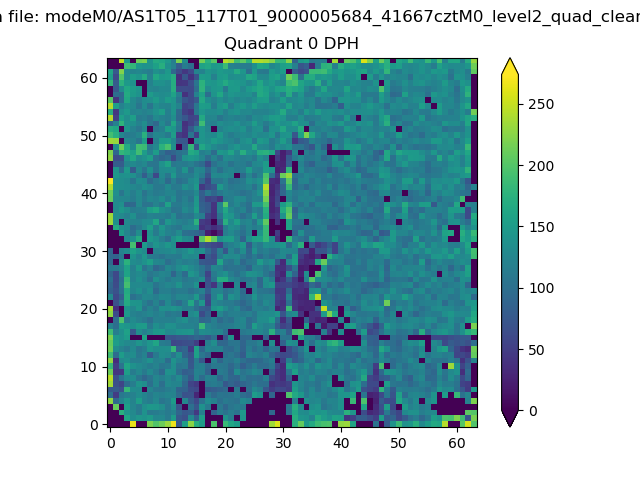 |
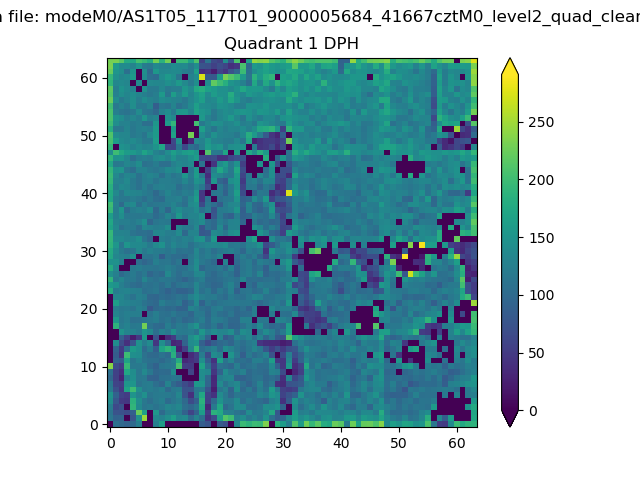 |
Quadrant B |
|---|---|---|---|
| Quadrant D | 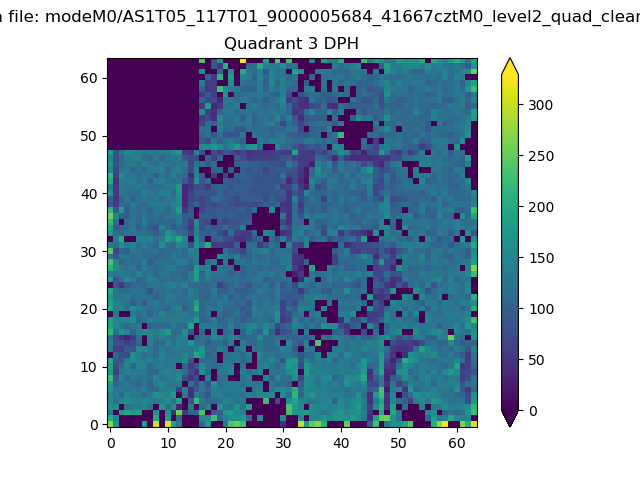 |
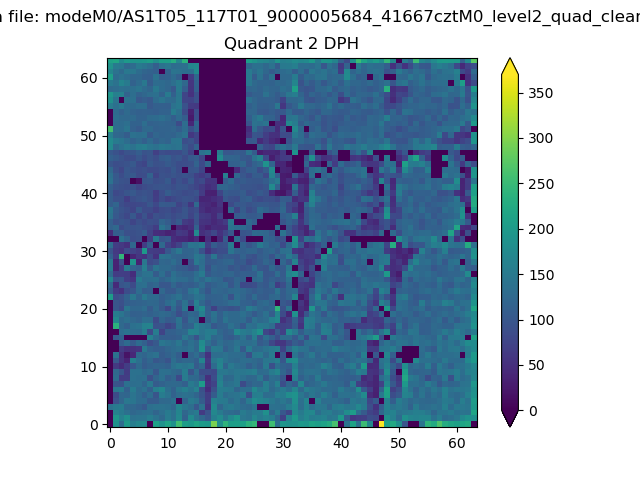 |
Quadrant C |
| Plot type | Count rate plots | Images |
|---|---|---|
| Comparison with Poisson distribution Blue bars denote a histogram of data divided into 1 sec bins. Red curve is a Poisson curve with rate = median count rate of data. |
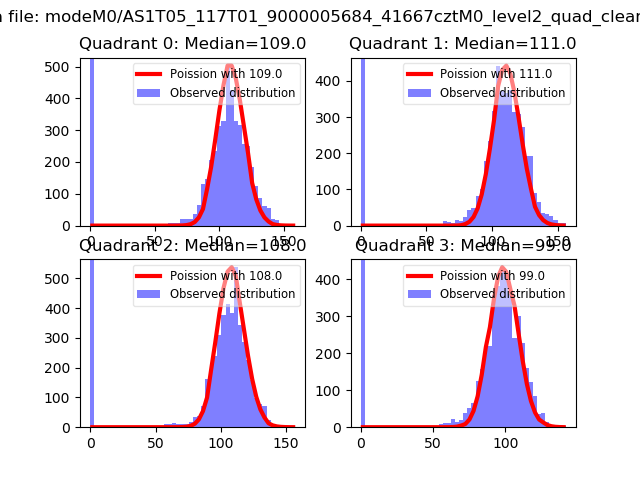 |
 |
| Quadrant-wise count rates Data is divided into 100 sec bins |
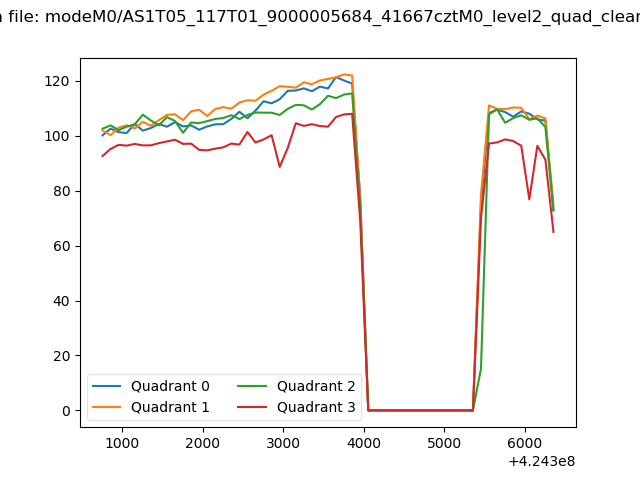 |
|
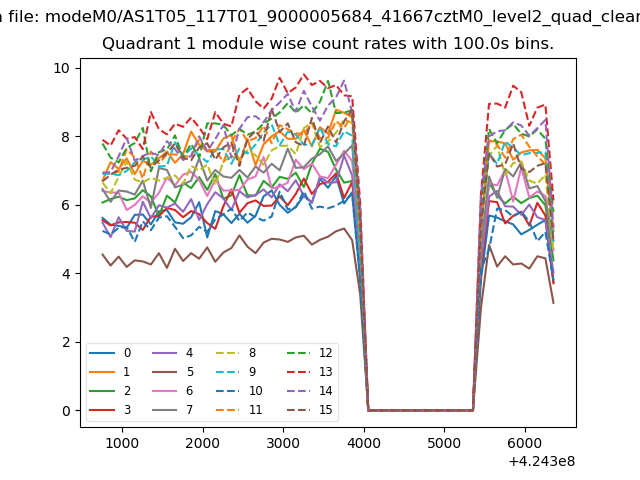
| Module-wise count rates for Quadrant A Data is divided into 100 sec bins |
 |
 |
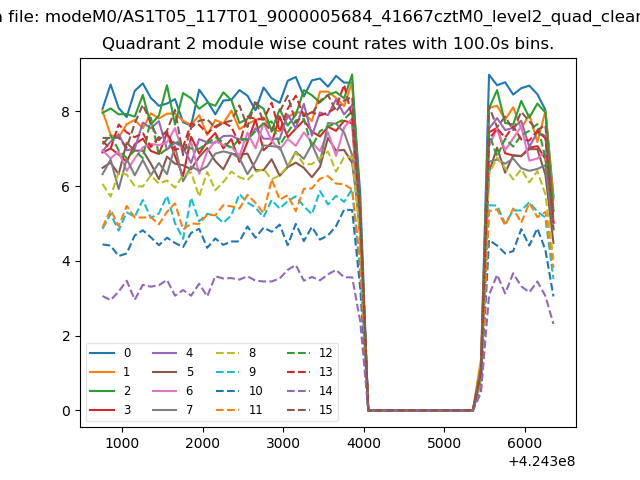
| Module-wise count rates for Quadrant B Data is divided into 100 sec bins |
 |
 |
| Module-wise count rates for Quadrant C Data is divided into 100 sec bins |
 |
 |
| Module-wise count rates for Quadrant D Data is divided into 100 sec bins |
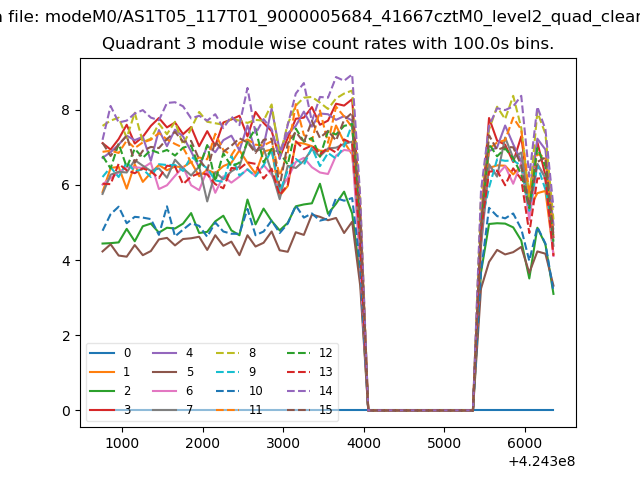 |
 |
| Parameter | Plot |
|---|---|
| CZT HV Monitor | 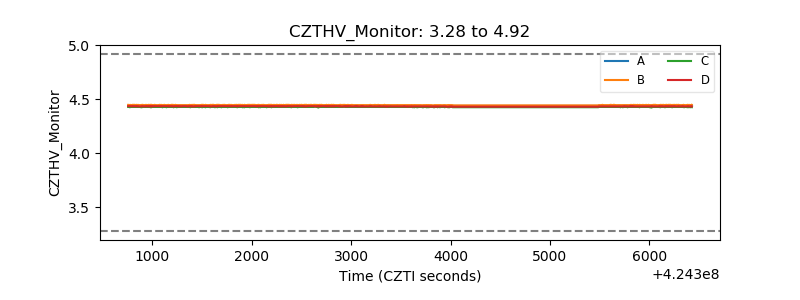 |
| D_VDD | 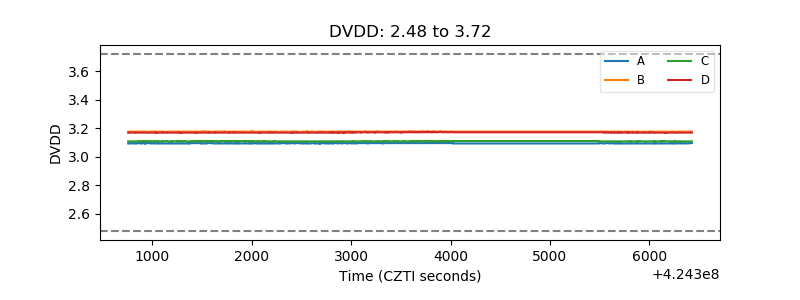 |
| Temperature 1 | 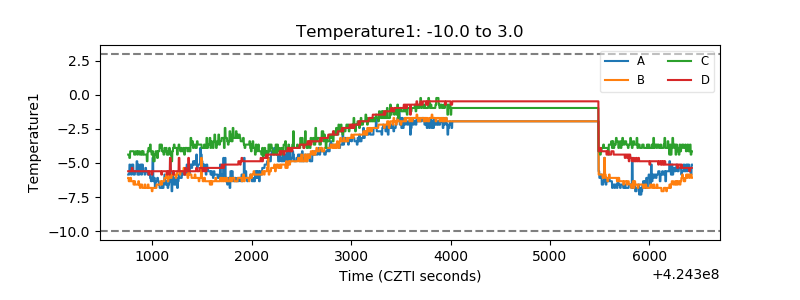 |
| Veto HV Monitor | 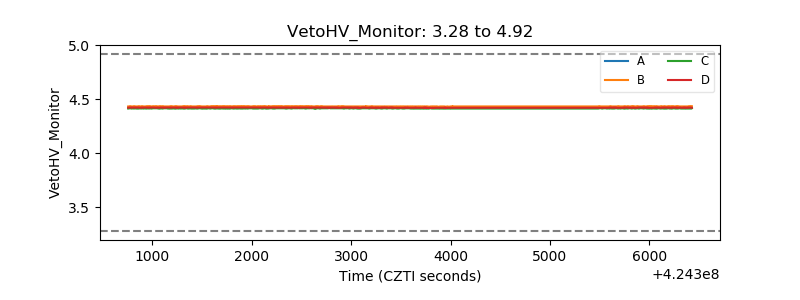 |
| Veto LLD | 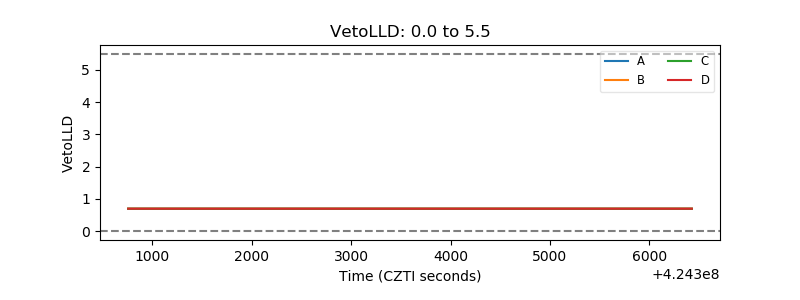 |
| Alpha Counter | 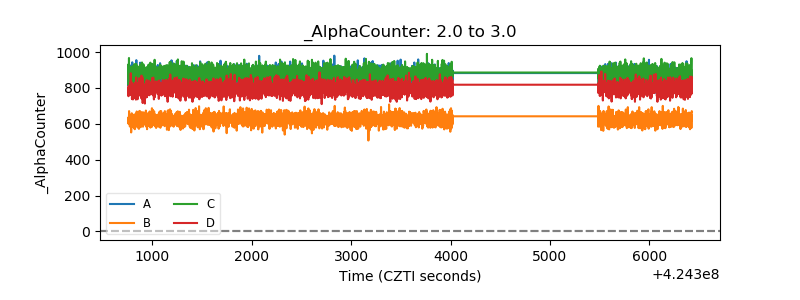 |
| _CPM_Rate | 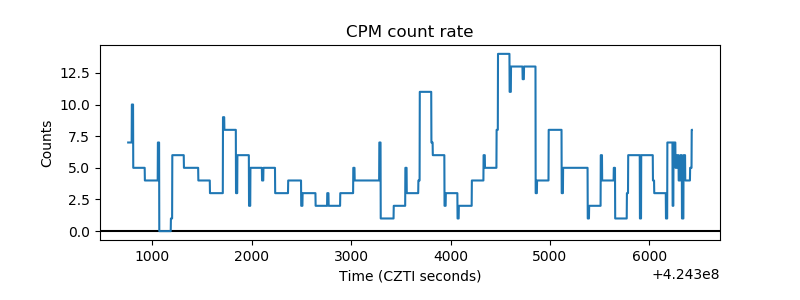 |
| CZT Counter | 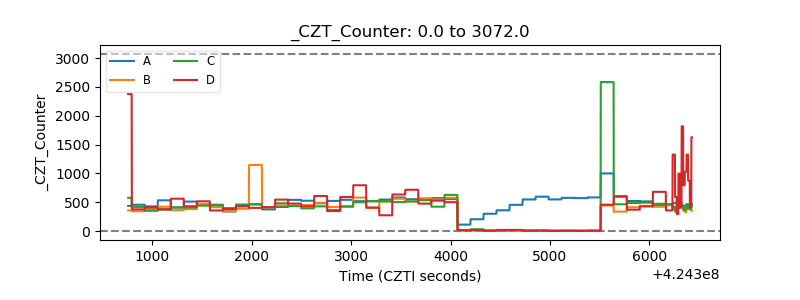 |
| +2.5 Volts monitor | 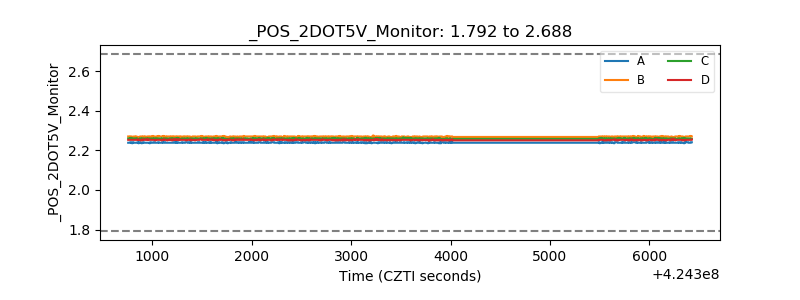 |
| +5 Volts monitor | 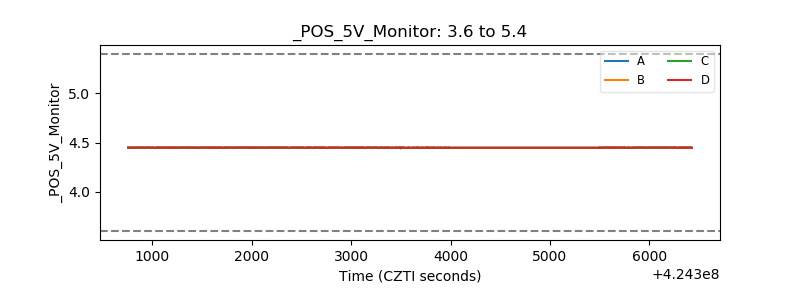 |
| _ROLL_ROT | 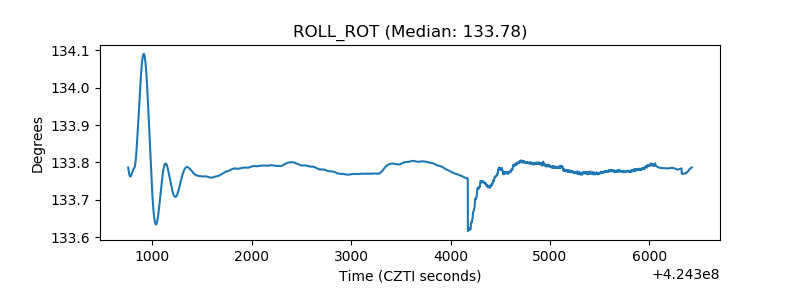 |
| _Roll_DEC | 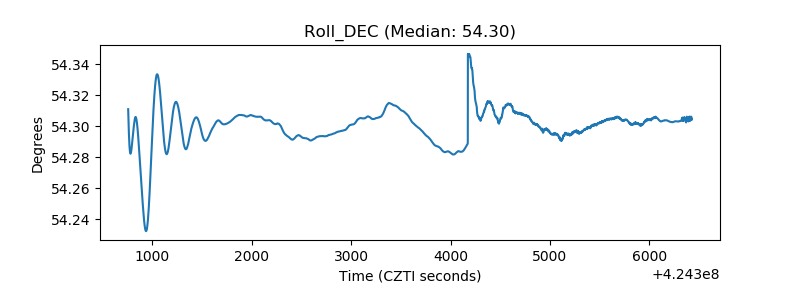 |
| _Roll_RA | 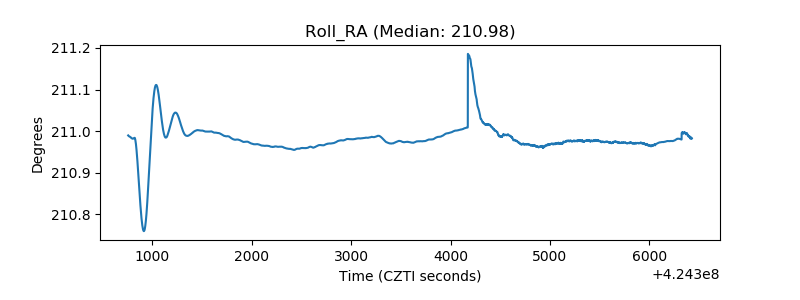 |
| Veto Counter | 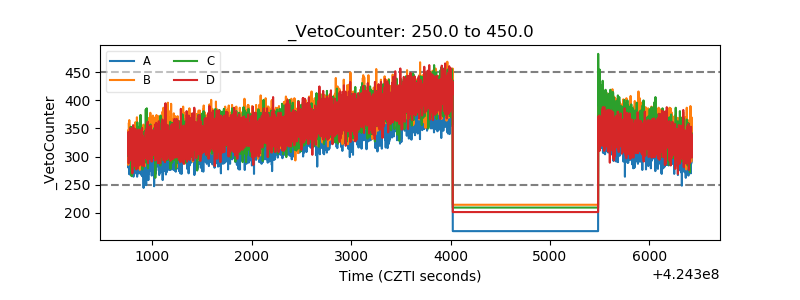 |