| Param | Original file | Final file |
|---|---|---|
| Filename | modeM0/AS1T05_117T01_9000005684_41672cztM0_level2.fits | modeM0/AS1T05_117T01_9000005684_41672cztM0_level2_quad_clean.evt |
| Size (bytes) | 371,090,880 | 91,906,560 |
| Size | 353.9 MB | 87.6 MB |
| Events in quadrant A | 3,196,311 | 616,968 |
| Events in quadrant B | 2,515,232 | 636,615 |
| Events in quadrant C | 3,220,051 | 596,073 |
| Events in quadrant D | 4,358,665 | 532,033 |
| Mode SS | |||
|---|---|---|---|
| Quadrant | BADHDUFLAG | Total packets | Discarded packets |
| A | 0 | 118 | 0 |
| B | 0 | 118 | 0 |
| C | 0 | 118 | 0 |
| D | 0 | 118 | 0 |
| Mode M9 | |||
|---|---|---|---|
| Quadrant | BADHDUFLAG | Total packets | Discarded packets |
| A | 0 | 22 | 0 |
| B | 0 | 23 | 0 |
| C | 0 | 23 | 0 |
| D | 0 | 23 | 0 |
| Mode M0 | |||
|---|---|---|---|
| Quadrant | BADHDUFLAG | Total packets | Discarded packets |
| A | 0 | 12926 | 2 |
| B | 0 | 11497 | 2 |
| C | 0 | 13224 | 2 |
| D | 0 | 16909 | 2 |
| Quadrant | Total seconds | Saturated seconds | Saturation percentage |
|---|---|---|---|
| A | 5732 | 22 | 0.383810% |
| B | 5732 | 4 | 0.069784% |
| C | 5732 | 129 | 2.250523% |
| D | 5732 | 389 | 6.786462% |
Noise dominated data is calculated using 1-second bins in cleaned event files. If a bin has >2000 counts, and if more than 50% of those come from <1% of pixels, then it is considered to be noise-dominated and hence unusable.
| Quadrant | # 1 sec bins | Bins with >0 counts | Bins with >2000 counts | High rate bins dominated by noise | Noise dominated (total time) | Noise dominated (detector-on time) | Marked lightcurve |
|---|---|---|---|---|---|---|---|
| A | 7316 | 5733 | 10 | 10 | 0.14% | 0.17% | 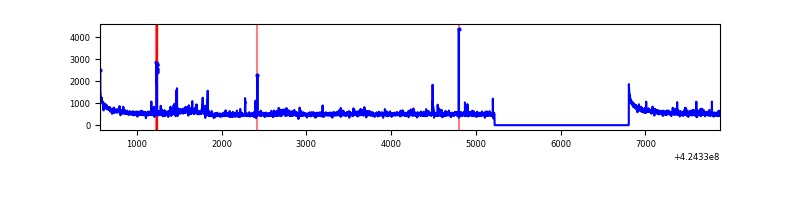 |
| B | 7316 | 5733 | 0 | 0 | 0.00% | 0.00% | 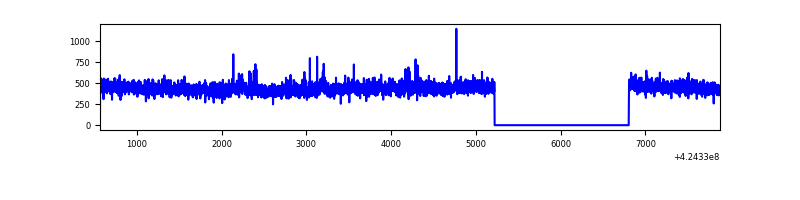 |
| C | 7316 | 5733 | 124 | 124 | 1.69% | 2.16% | 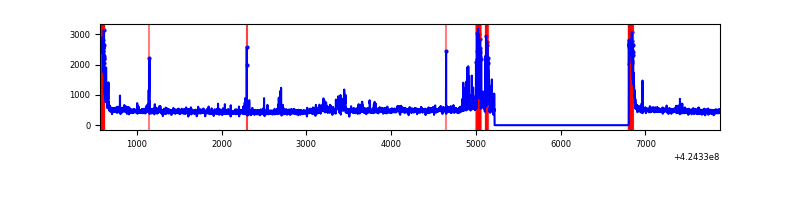 |
| D | 7316 | 5733 | 379 | 379 | 5.18% | 6.61% | 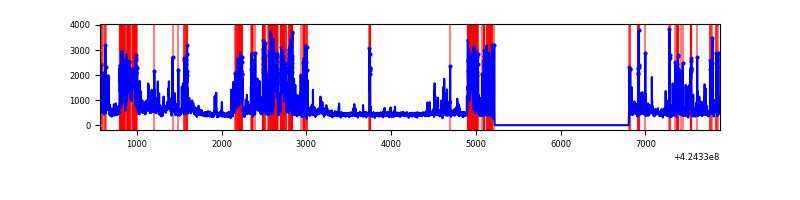 |
Top three noisy pixels from each quadrant. If the there are fewer than three noisy pixels in the level2.evt file, extra rows are filled as -1
| Pixel properties | Quadrant properties | ||||||
|---|---|---|---|---|---|---|---|
| Quadrant | DetID | PixID | Counts | Sigma | Mean | Median | Sigma |
| A | 10 | 83 | 560487 | 4292.3 | 631 | 617 | 130.4 |
| A | 15 | 223 | 120419 | 918.47 | 631 | 617 | 130.4 |
| A | 13 | 248 | 25678 | 192.13 | 631 | 617 | 130.4 |
| B | 0 | 190 | 33084 | 264.93 | 626 | 609 | 122.6 |
| B | 12 | 111 | 15911 | 124.83 | 626 | 609 | 122.6 |
| B | 11 | 111 | 14872 | 116.36 | 626 | 609 | 122.6 |
| C | 14 | 254 | 309309 | 2146.59 | 606 | 608 | 143.8 |
| C | 0 | 10 | 286090 | 1985.14 | 606 | 608 | 143.8 |
| C | 15 | 214 | 233546 | 1619.76 | 606 | 608 | 143.8 |
| D | 13 | 249 | 953146 | 6477.03 | 601 | 585 | 147.1 |
| D | 2 | 249 | 588361 | 3996.64 | 601 | 585 | 147.1 |
| D | 2 | 120 | 342195 | 2322.81 | 601 | 585 | 147.1 |
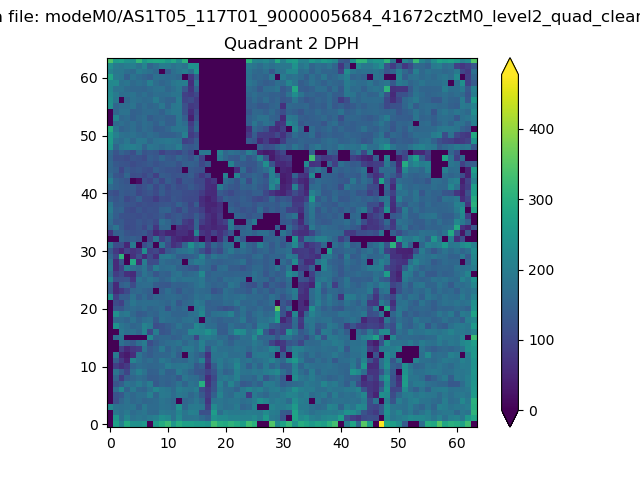
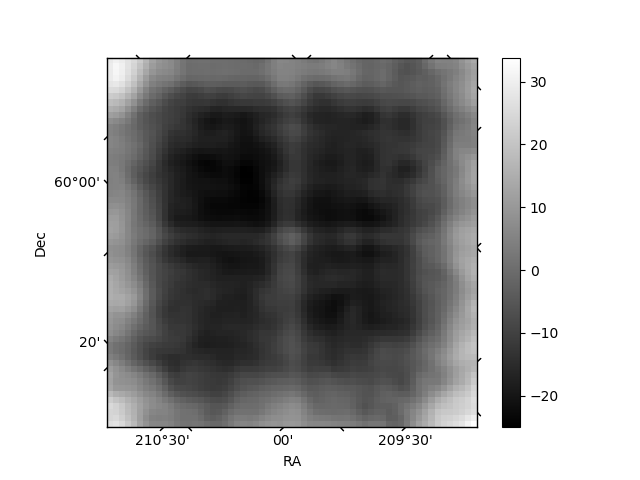
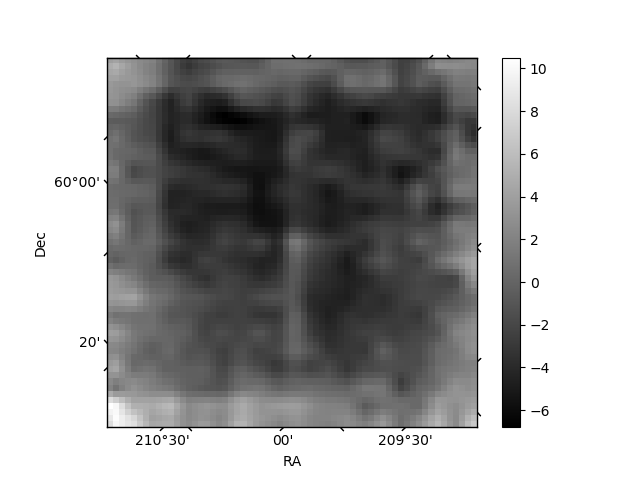
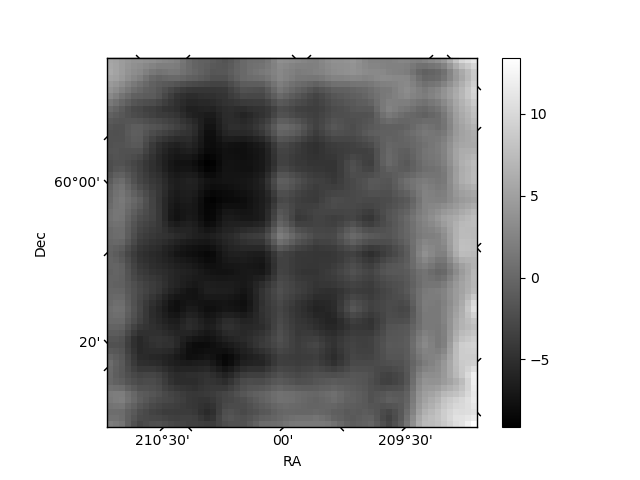
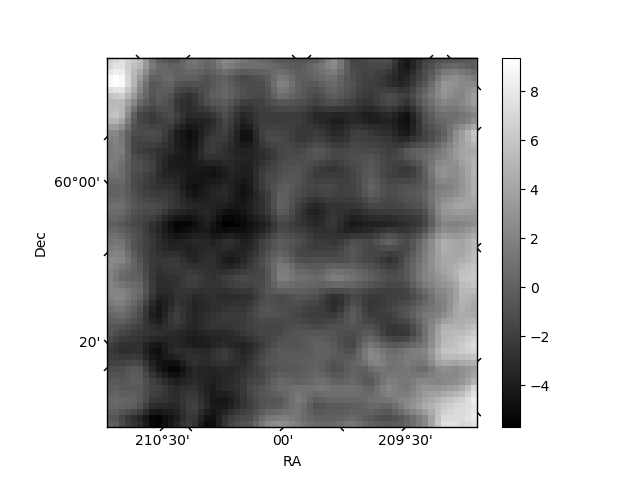
Histogram calculated using DETX and DETY for each event in the final _common_clean file
| Quadrant A | 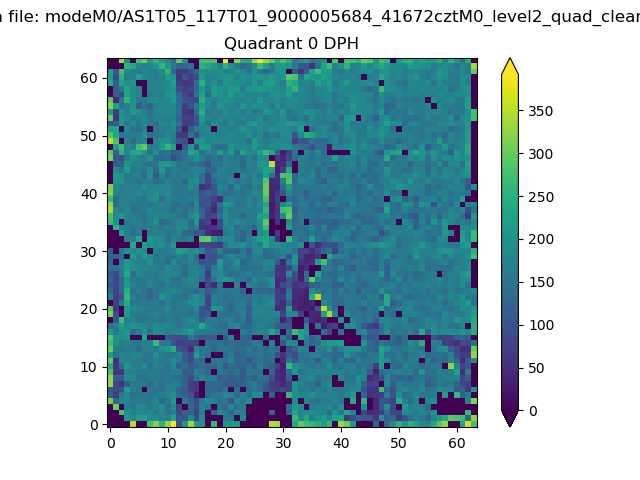 |
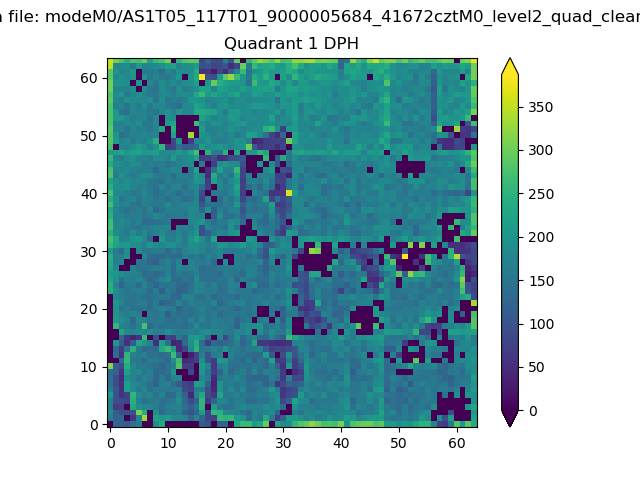 |
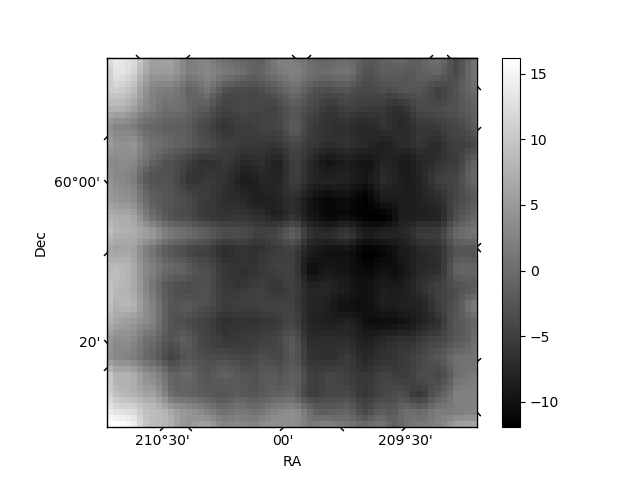
Quadrant B |
|---|---|---|---|
| Quadrant D | 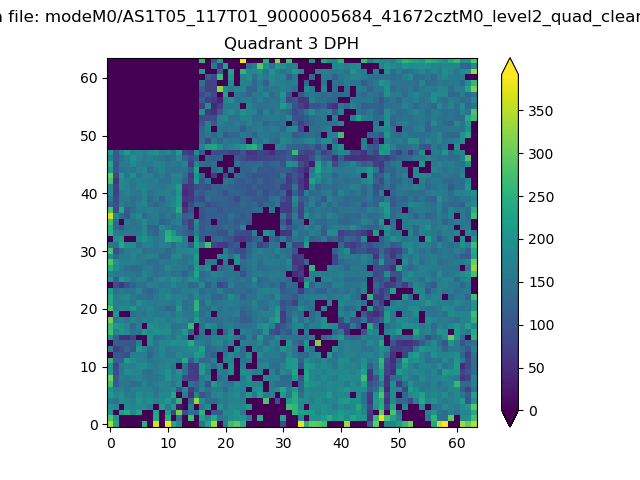 |
 |
Quadrant C |
| Plot type | Count rate plots | Images |
|---|---|---|
| Comparison with Poisson distribution Blue bars denote a histogram of data divided into 1 sec bins. Red curve is a Poisson curve with rate = median count rate of data. |
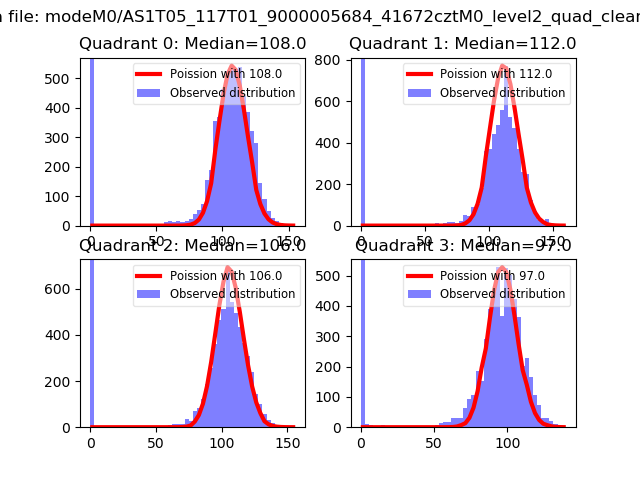 |
 |
| Quadrant-wise count rates Data is divided into 100 sec bins |
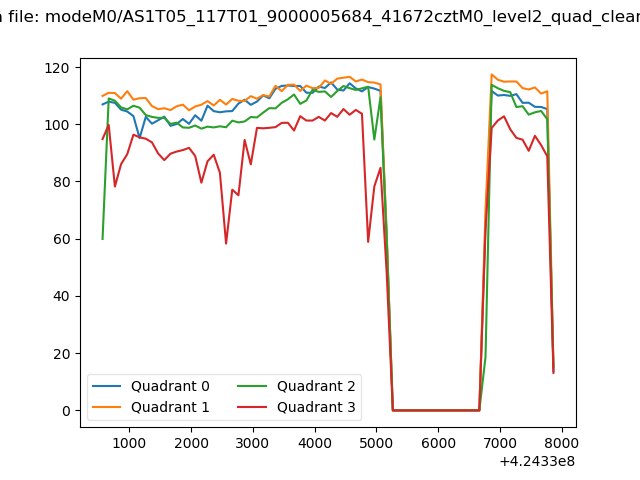 |
|
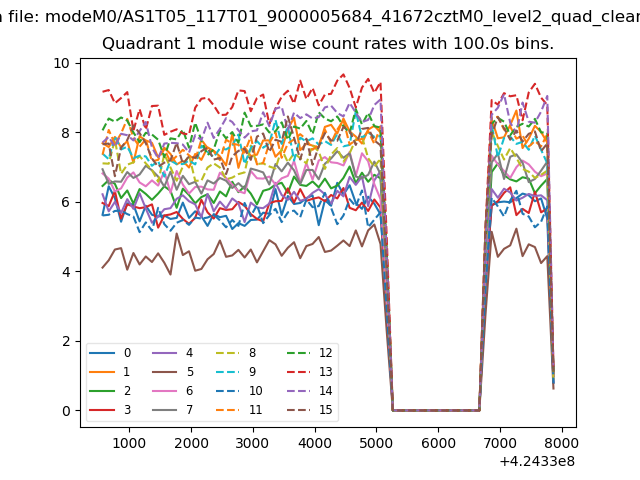
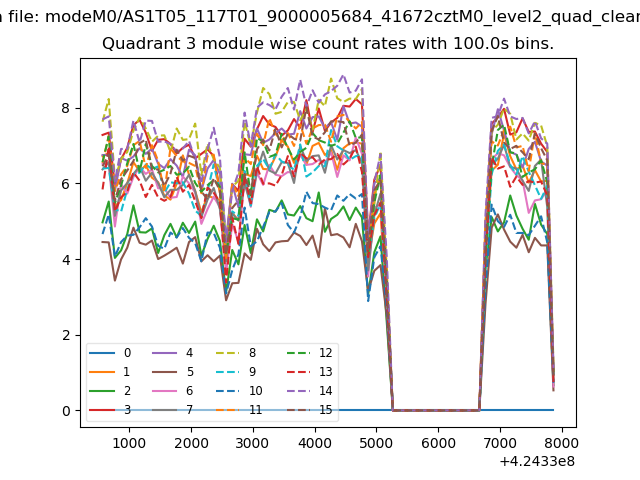
| Module-wise count rates for Quadrant A Data is divided into 100 sec bins |
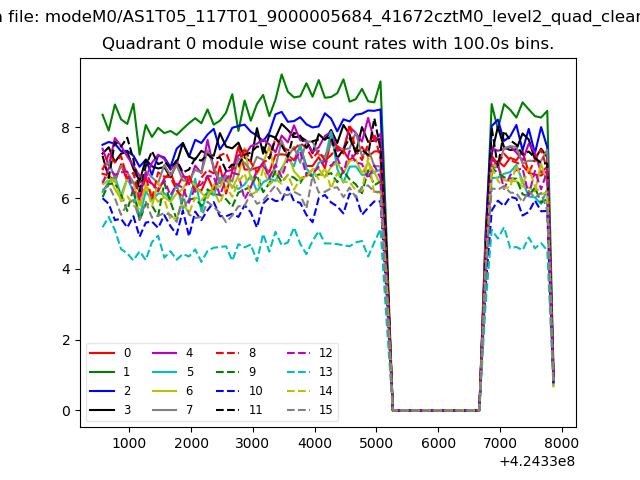 |
 |
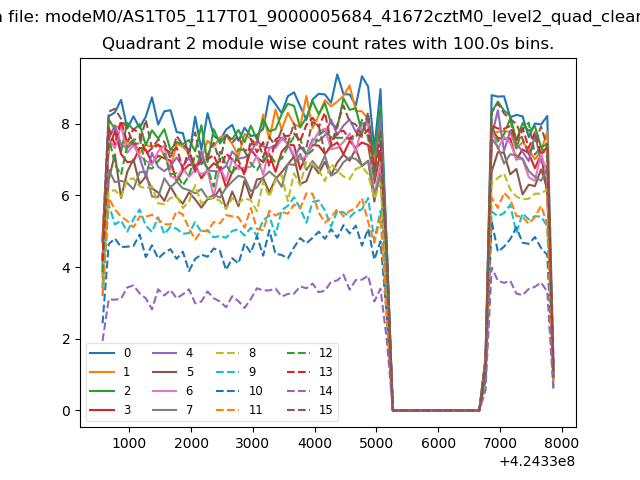
| Module-wise count rates for Quadrant B Data is divided into 100 sec bins |
 |
 |
| Module-wise count rates for Quadrant C Data is divided into 100 sec bins |
 |
 |
| Module-wise count rates for Quadrant D Data is divided into 100 sec bins |
 |
 |
| Parameter | Plot |
|---|---|
| CZT HV Monitor | 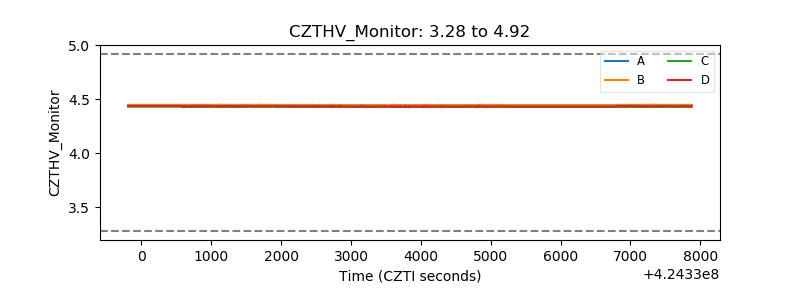 |
| D_VDD | 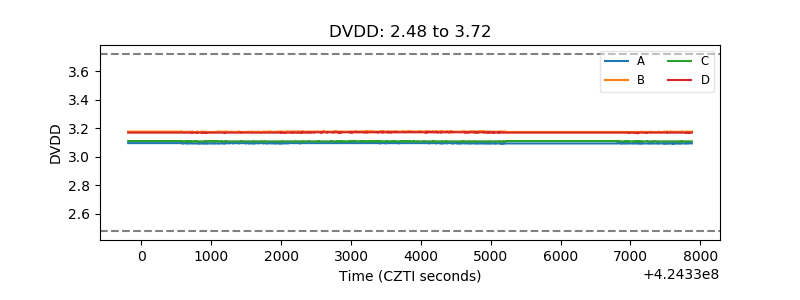 |
| Temperature 1 | 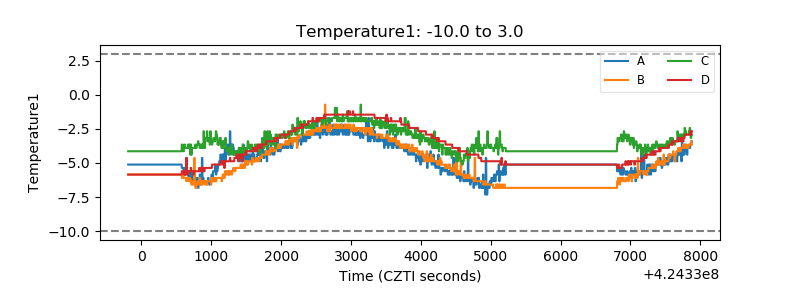 |
| Veto HV Monitor | 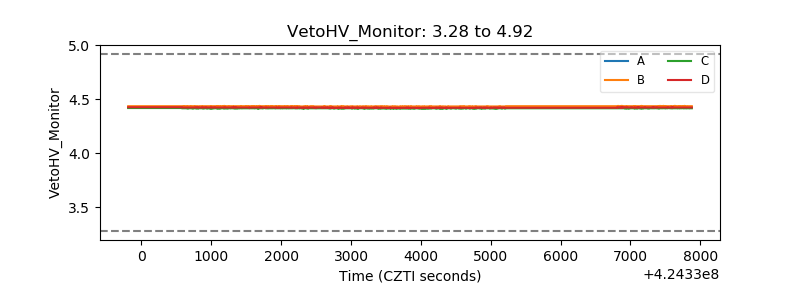 |
| Veto LLD | 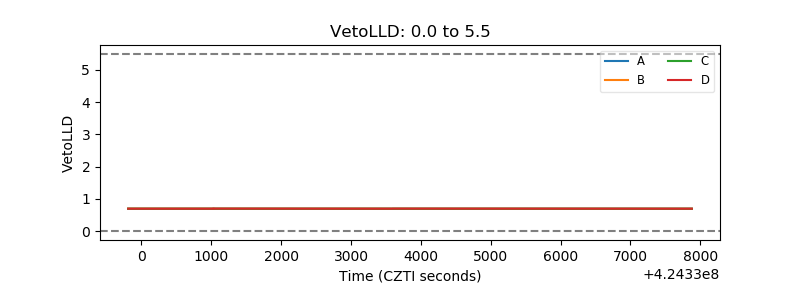 |
| Alpha Counter | 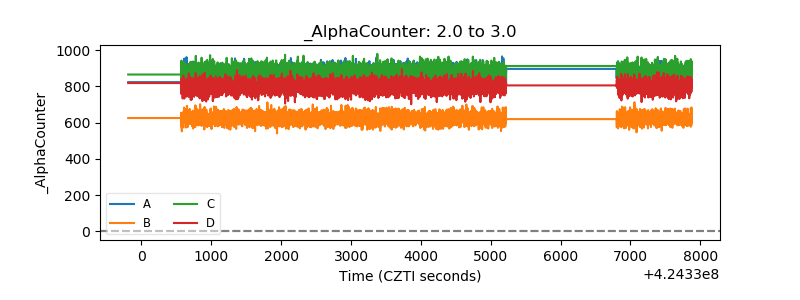 |
| _CPM_Rate | 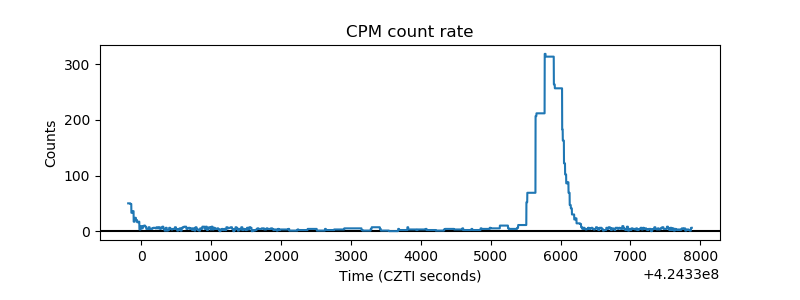 |
| CZT Counter | 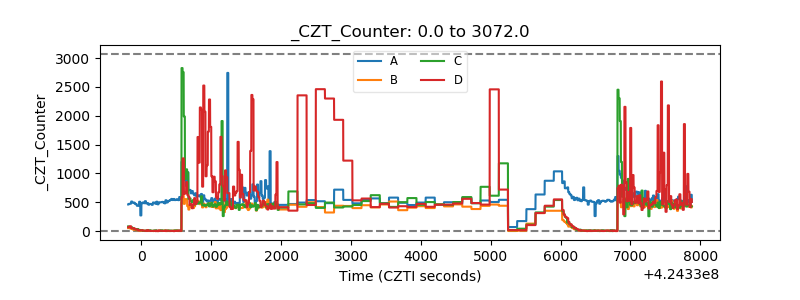 |
| +2.5 Volts monitor | 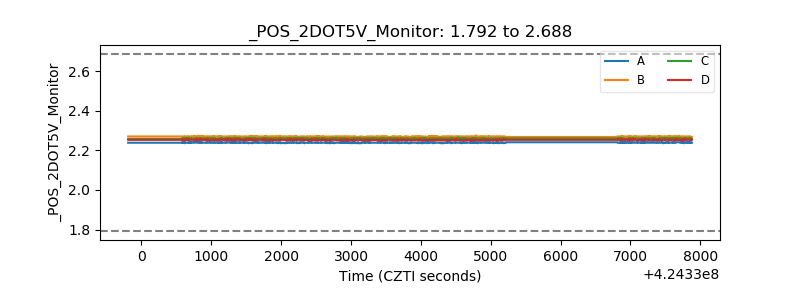 |
| +5 Volts monitor | 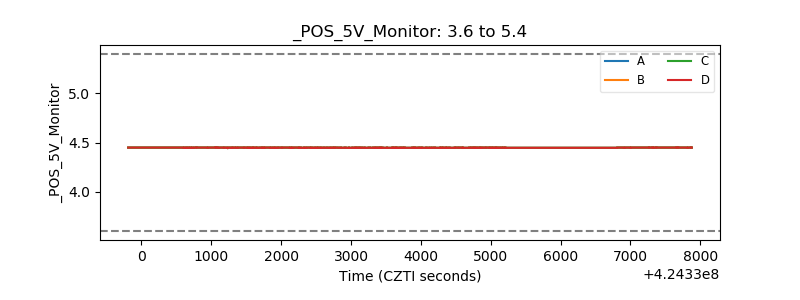 |
| _ROLL_ROT | 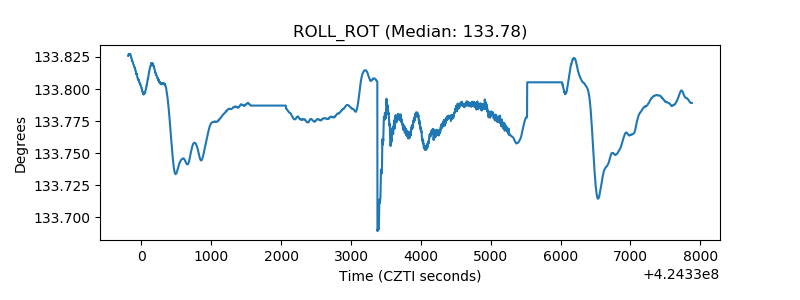 |
| _Roll_DEC | 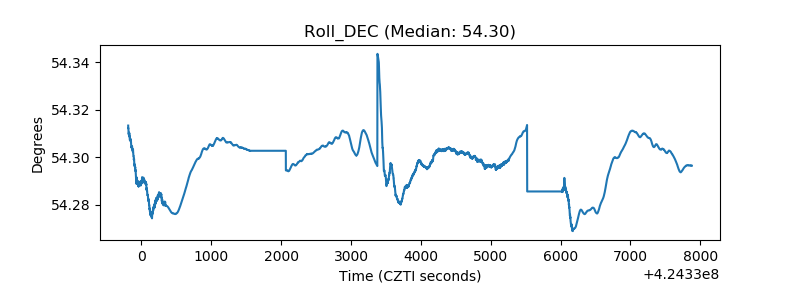 |
| _Roll_RA | 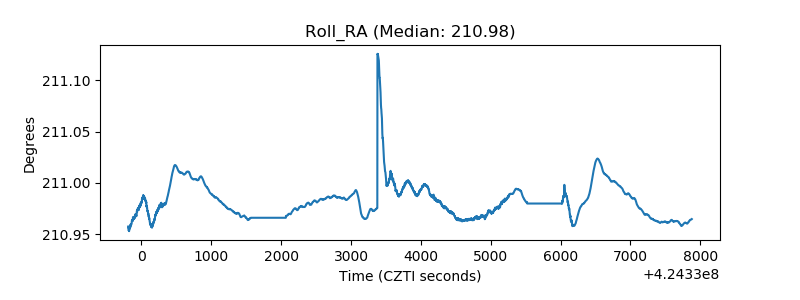 |
| Veto Counter | 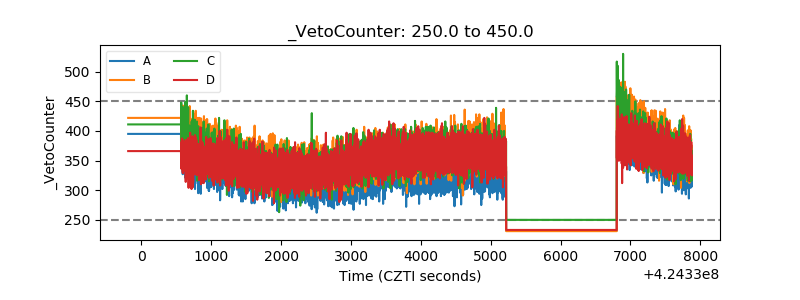 |