| Param | Original file | Final file |
|---|---|---|
| Filename | modeM0/AS1T05_117T01_9000005684_41675cztM0_level2.fits | modeM0/AS1T05_117T01_9000005684_41675cztM0_level2_quad_clean.evt |
| Size (bytes) | 242,645,760 | 64,742,400 |
| Size | 231.4 MB | 61.7 MB |
| Events in quadrant A | 2,055,572 | 440,221 |
| Events in quadrant B | 1,986,713 | 449,911 |
| Events in quadrant C | 2,022,292 | 417,316 |
| Events in quadrant D | 2,616,319 | 380,695 |
| Mode SS | |||
|---|---|---|---|
| Quadrant | BADHDUFLAG | Total packets | Discarded packets |
| A | 0 | 78 | 0 |
| B | 0 | 78 | 0 |
| C | 0 | 78 | 0 |
| D | 0 | 78 | 0 |
| Mode M9 | |||
|---|---|---|---|
| Quadrant | BADHDUFLAG | Total packets | Discarded packets |
| A | 0 | 8 | 0 |
| B | 0 | 9 | 0 |
| C | 0 | 9 | 0 |
| D | 0 | 9 | 0 |
| Mode M0 | |||
|---|---|---|---|
| Quadrant | BADHDUFLAG | Total packets | Discarded packets |
| A | 0 | 8351 | 1 |
| B | 0 | 8455 | 1 |
| C | 0 | 8457 | 1 |
| D | 0 | 10482 | 1 |
| Quadrant | Total seconds | Saturated seconds | Saturation percentage |
|---|---|---|---|
| A | 3852 | 6 | 0.155763% |
| B | 3852 | 10 | 0.259605% |
| C | 3852 | 64 | 1.661475% |
| D | 3852 | 168 | 4.361371% |
Noise dominated data is calculated using 1-second bins in cleaned event files. If a bin has >2000 counts, and if more than 50% of those come from <1% of pixels, then it is considered to be noise-dominated and hence unusable.
| Quadrant | # 1 sec bins | Bins with >0 counts | Bins with >2000 counts | High rate bins dominated by noise | Noise dominated (total time) | Noise dominated (detector-on time) | Marked lightcurve |
|---|---|---|---|---|---|---|---|
| A | 3852 | 3852 | 1 | 1 | 0.03% | 0.03% | 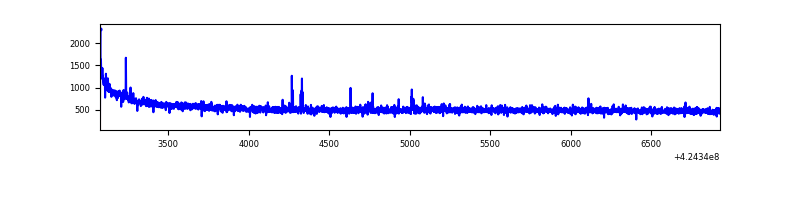 |
| B | 3852 | 3852 | 3 | 3 | 0.08% | 0.08% | 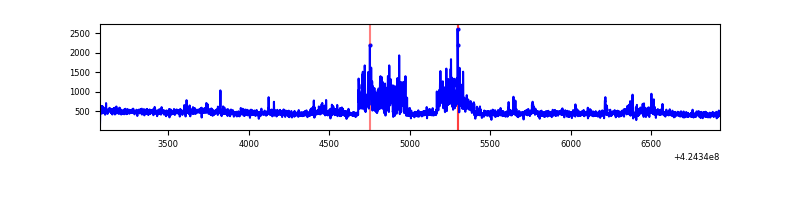 |
| C | 3852 | 3852 | 59 | 59 | 1.53% | 1.53% | 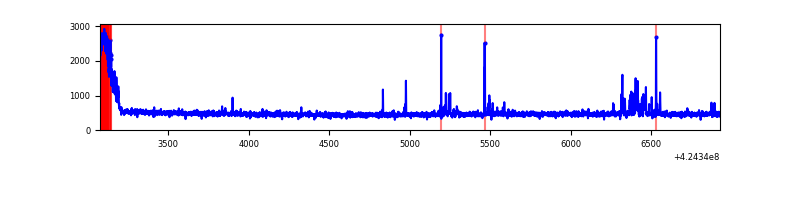 |
| D | 3852 | 3852 | 161 | 161 | 4.18% | 4.18% | 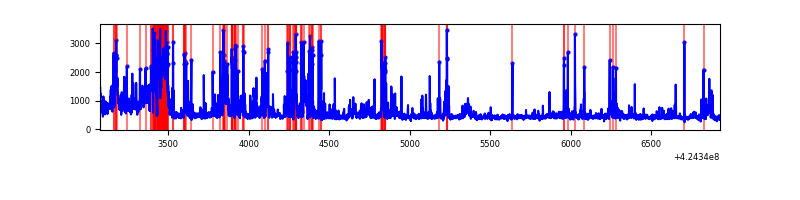 |
Top three noisy pixels from each quadrant. If the there are fewer than three noisy pixels in the level2.evt file, extra rows are filled as -1
| Pixel properties | Quadrant properties | ||||||
|---|---|---|---|---|---|---|---|
| Quadrant | DetID | PixID | Counts | Sigma | Mean | Median | Sigma |
| A | 10 | 83 | 366897 | 4142.57 | 429 | 421 | 88.5 |
| A | 13 | 248 | 14986 | 164.64 | 429 | 421 | 88.5 |
| A | 13 | 6 | 5811 | 60.93 | 429 | 421 | 88.5 |
| B | 0 | 186 | 227219 | 2749.49 | 423 | 411 | 82.5 |
| B | 0 | 190 | 53853 | 647.85 | 423 | 411 | 82.5 |
| B | 5 | 255 | 22632 | 269.37 | 423 | 411 | 82.5 |
| C | 0 | 10 | 184676 | 1908.27 | 412 | 415 | 96.6 |
| C | 15 | 214 | 154844 | 1599.32 | 412 | 415 | 96.6 |
| C | 15 | 111 | 67759 | 697.44 | 412 | 415 | 96.6 |
| D | 13 | 249 | 609062 | 5992.38 | 412 | 400 | 101.6 |
| D | 2 | 249 | 212256 | 2085.76 | 412 | 400 | 101.6 |
| D | 2 | 120 | 107787 | 1057.24 | 412 | 400 | 101.6 |
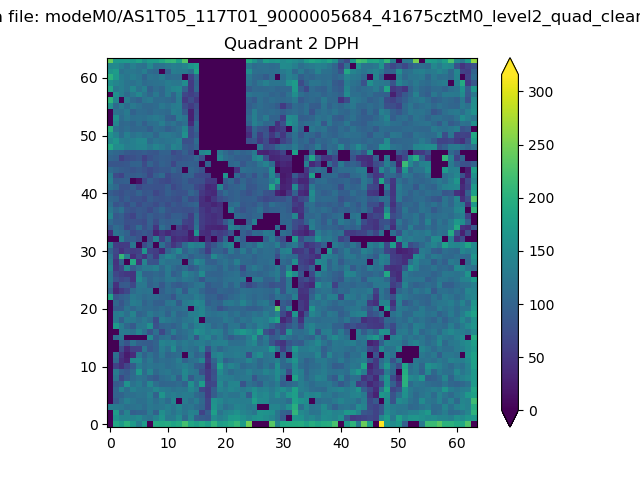
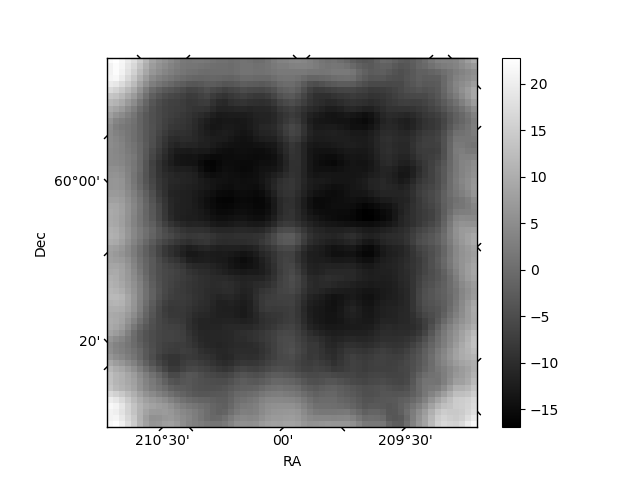
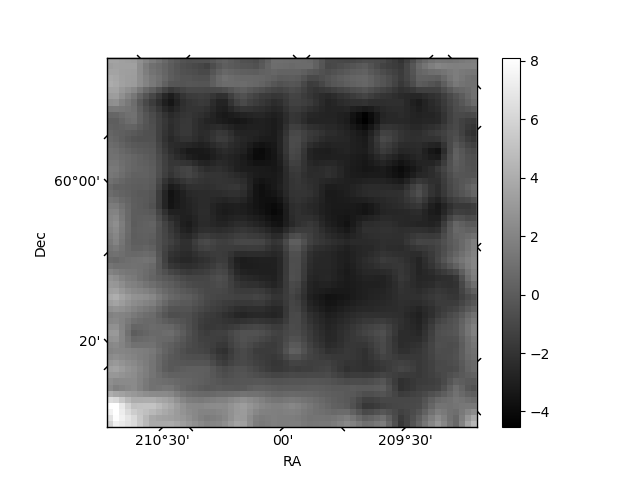
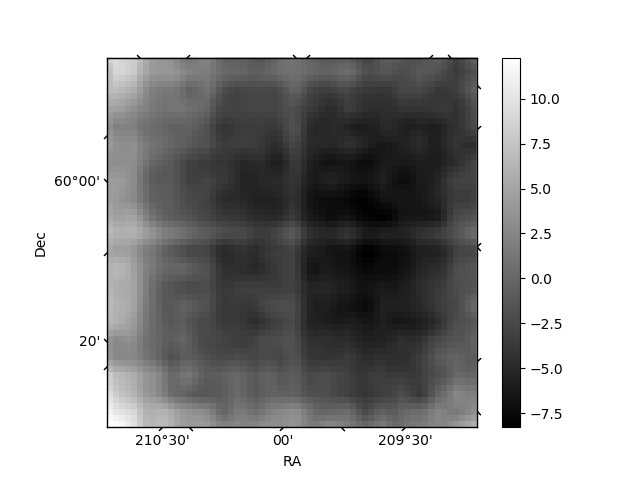
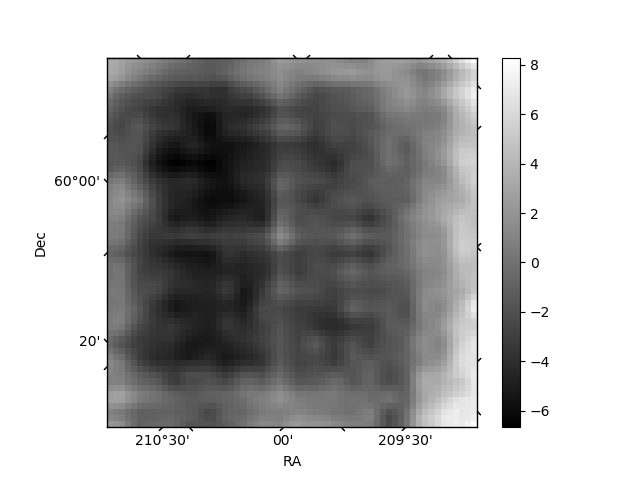
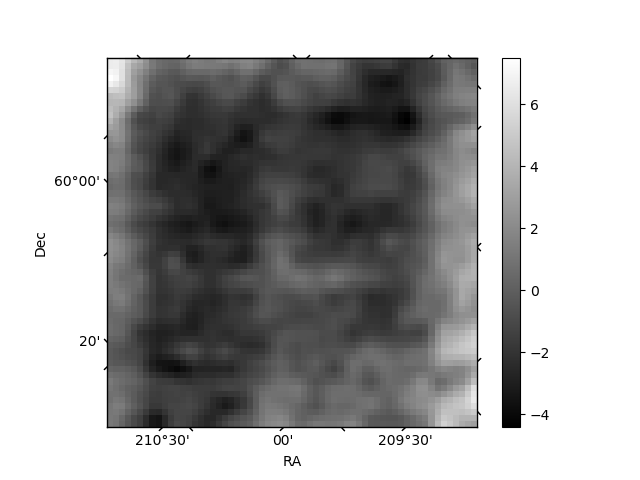
Histogram calculated using DETX and DETY for each event in the final _common_clean file
| Quadrant A | 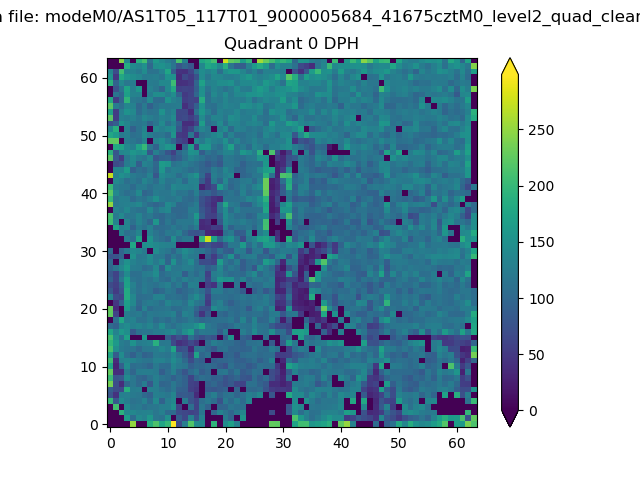 |
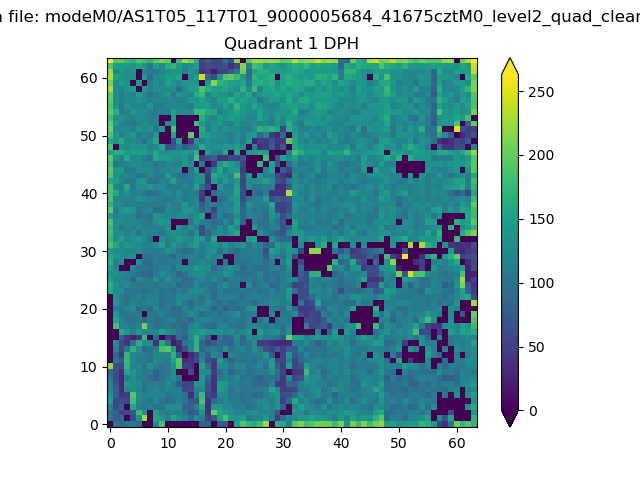 |
Quadrant B |
|---|---|---|---|
| Quadrant D | 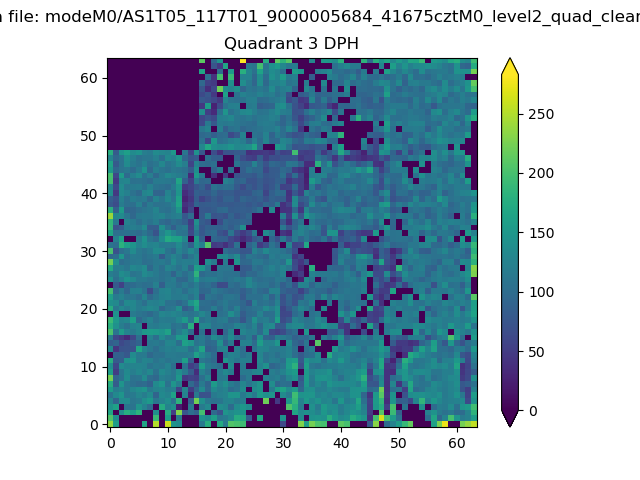 |
 |
Quadrant C |
| Plot type | Count rate plots | Images |
|---|---|---|
| Comparison with Poisson distribution Blue bars denote a histogram of data divided into 1 sec bins. Red curve is a Poisson curve with rate = median count rate of data. |
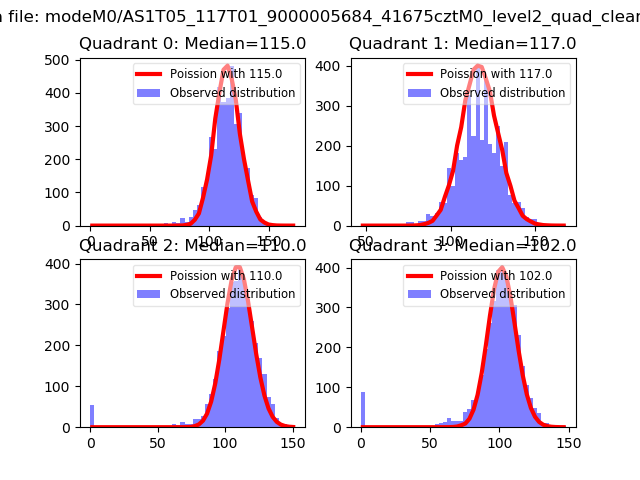 |
 |
| Quadrant-wise count rates Data is divided into 100 sec bins |
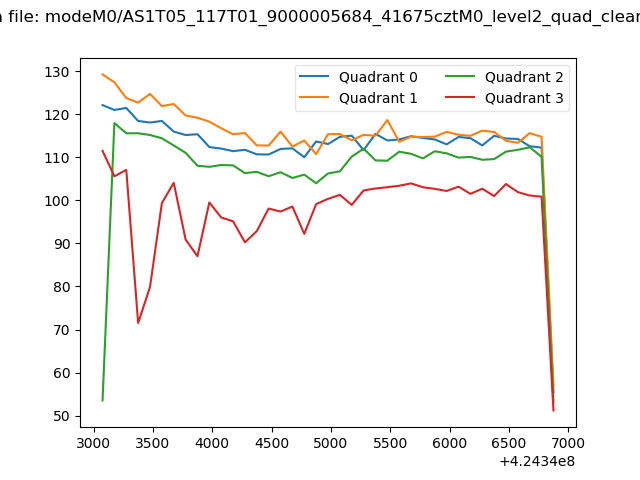 |
|
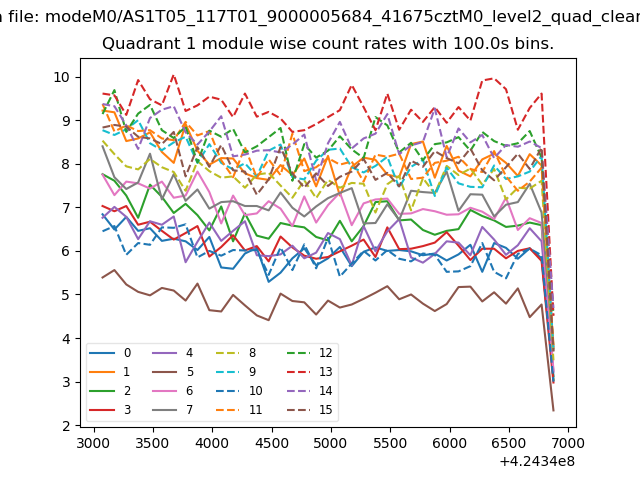
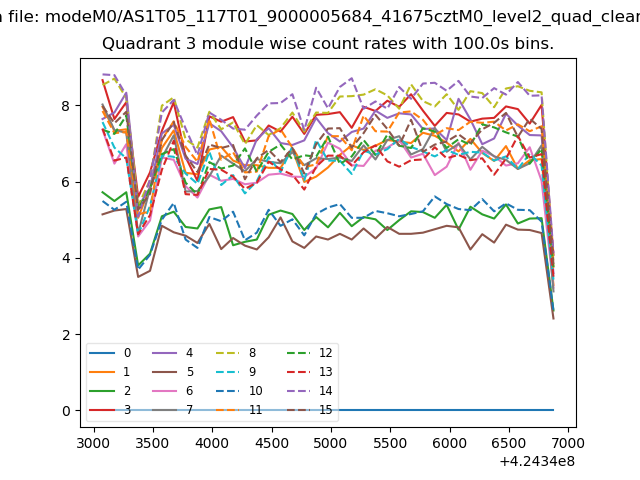
| Module-wise count rates for Quadrant A Data is divided into 100 sec bins |
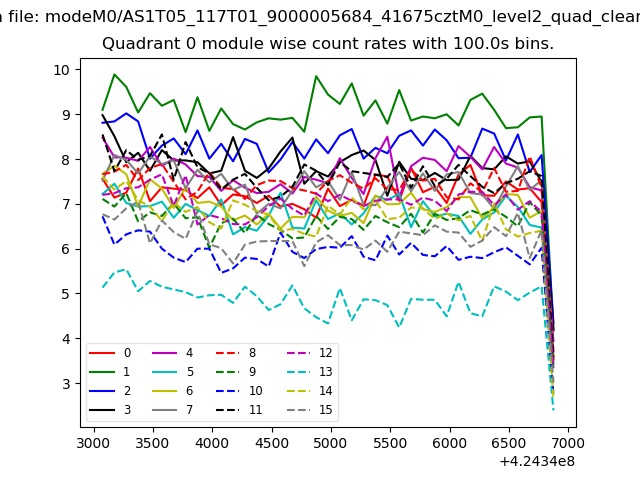 |
 |
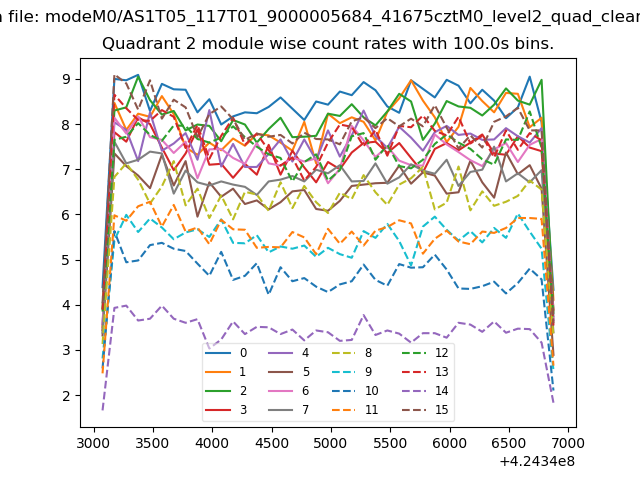
| Module-wise count rates for Quadrant B Data is divided into 100 sec bins |
 |
 |
| Module-wise count rates for Quadrant C Data is divided into 100 sec bins |
 |
 |
| Module-wise count rates for Quadrant D Data is divided into 100 sec bins |
 |
 |
| Parameter | Plot |
|---|---|
| CZT HV Monitor | 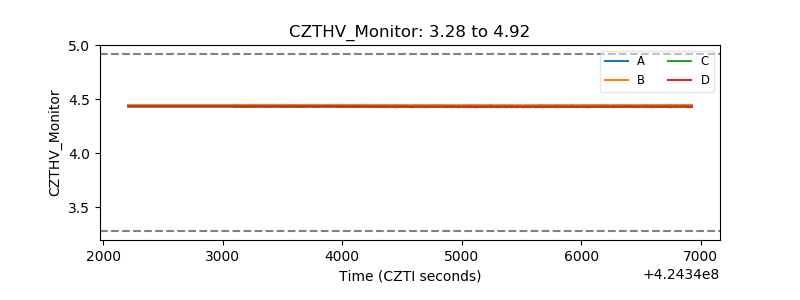 |
| D_VDD | 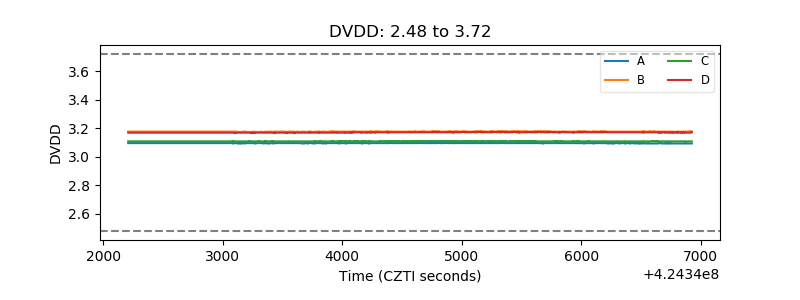 |
| Temperature 1 | 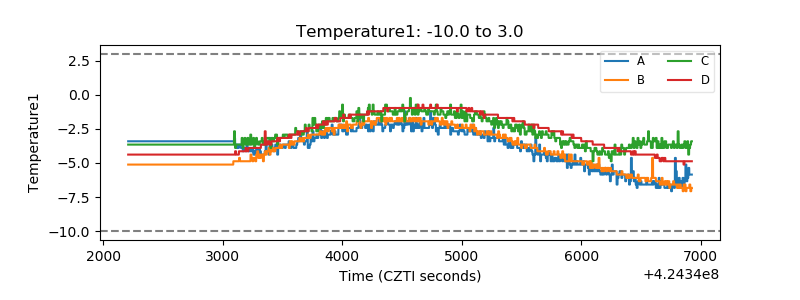 |
| Veto HV Monitor | 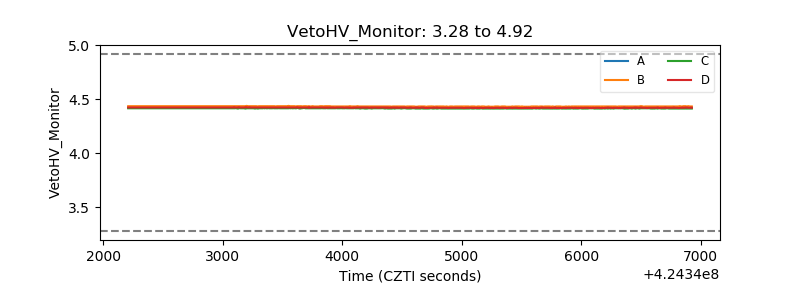 |
| Veto LLD | 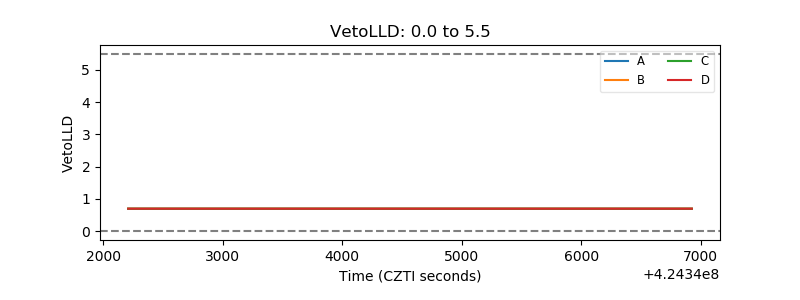 |
| Alpha Counter | 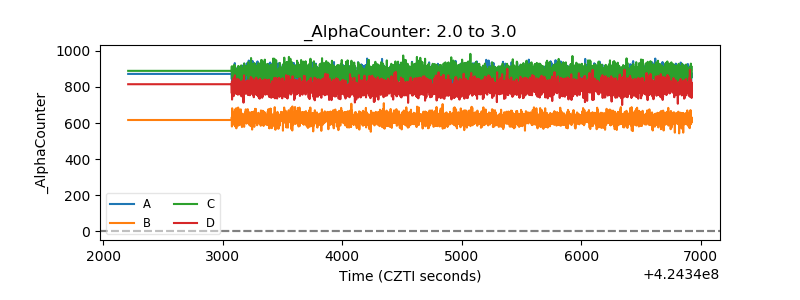 |
| _CPM_Rate | 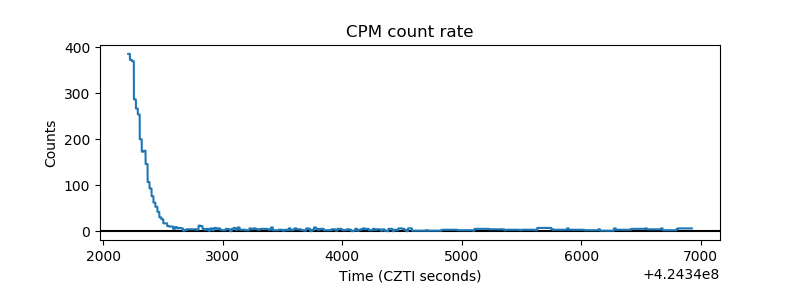 |
| CZT Counter | 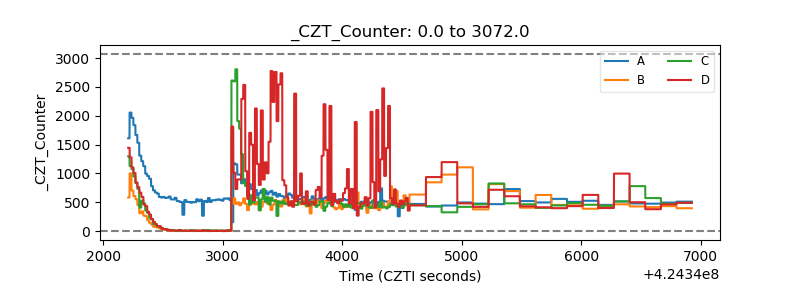 |
| +2.5 Volts monitor |  |
| +5 Volts monitor | 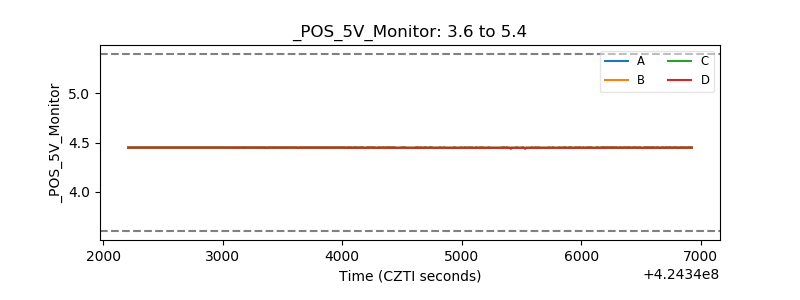 |
| _ROLL_ROT | 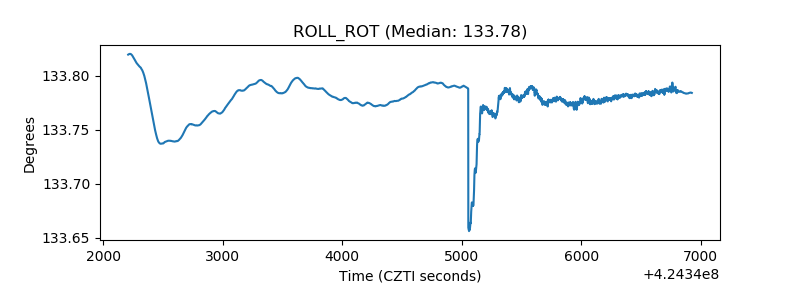 |
| _Roll_DEC | 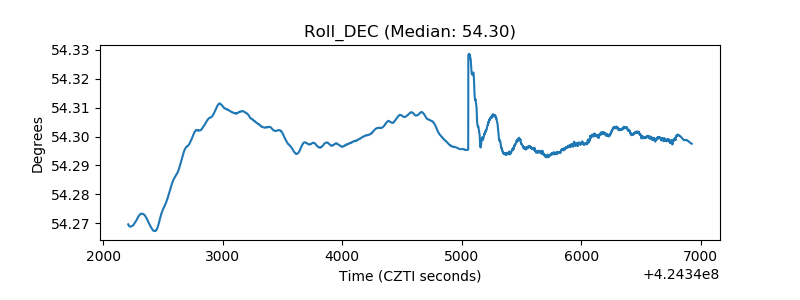 |
| _Roll_RA | 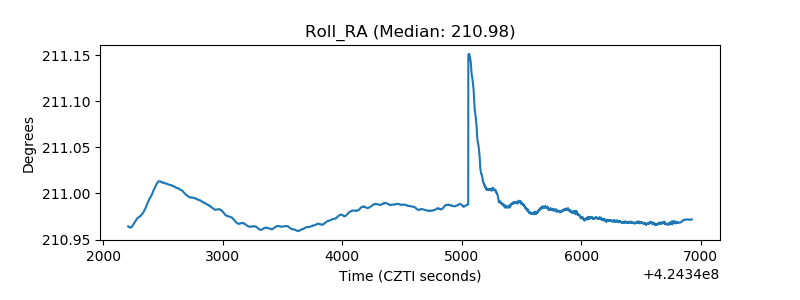 |
| Veto Counter | 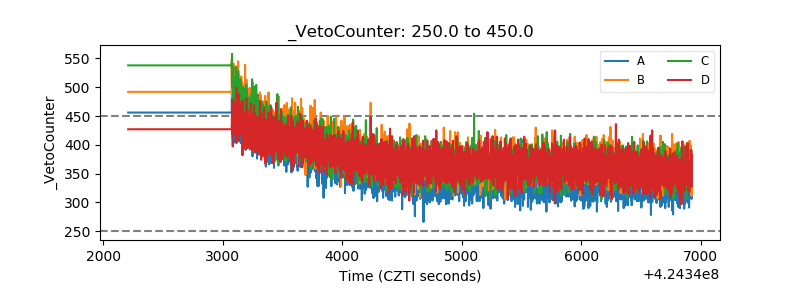 |