| Param | Original file | Final file |
|---|---|---|
| Filename | modeM0/AS1A12_044T21_9000005688_41679cztM0_level2.fits | modeM0/AS1A12_044T21_9000005688_41679cztM0_level2_quad_clean.evt |
| Size (bytes) | 177,252,480 | 52,583,040 |
| Size | 169.0 MB | 50.1 MB |
| Events in quadrant A | 1,776,137 | 352,394 |
| Events in quadrant B | 1,361,611 | 360,079 |
| Events in quadrant C | 1,555,366 | 340,833 |
| Events in quadrant D | 1,627,989 | 321,120 |
| Mode SS | |||
|---|---|---|---|
| Quadrant | BADHDUFLAG | Total packets | Discarded packets |
| A | 0 | 64 | 0 |
| B | 0 | 64 | 0 |
| C | 0 | 64 | 0 |
| D | 0 | 64 | 0 |
| Mode M9 | |||
|---|---|---|---|
| Quadrant | BADHDUFLAG | Total packets | Discarded packets |
| A | 0 | 21 | 0 |
| B | 0 | 21 | 0 |
| C | 0 | 21 | 0 |
| D | 0 | 21 | 0 |
| Mode M0 | |||
|---|---|---|---|
| Quadrant | BADHDUFLAG | Total packets | Discarded packets |
| A | 0 | 7235 | 1 |
| B | 0 | 6144 | 1 |
| C | 0 | 6545 | 1 |
| D | 0 | 7043 | 1 |
| Quadrant | Total seconds | Saturated seconds | Saturation percentage |
|---|---|---|---|
| A | 3059 | 8 | 0.261523% |
| B | 3059 | 5 | 0.163452% |
| C | 3059 | 47 | 1.536450% |
| D | 3059 | 24 | 0.784570% |
Noise dominated data is calculated using 1-second bins in cleaned event files. If a bin has >2000 counts, and if more than 50% of those come from <1% of pixels, then it is considered to be noise-dominated and hence unusable.
| Quadrant | # 1 sec bins | Bins with >0 counts | Bins with >2000 counts | High rate bins dominated by noise | Noise dominated (total time) | Noise dominated (detector-on time) | Marked lightcurve |
|---|---|---|---|---|---|---|---|
| A | 5182 | 3060 | 3 | 3 | 0.06% | 0.10% | 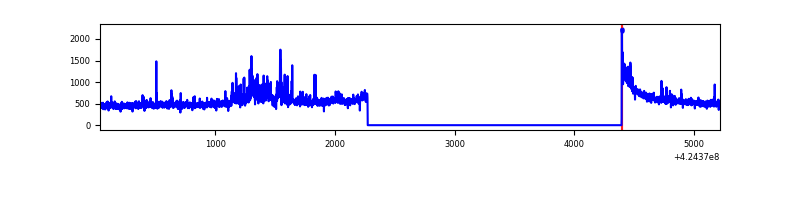 |
| B | 5182 | 3060 | 0 | 0 | 0.00% | 0.00% | 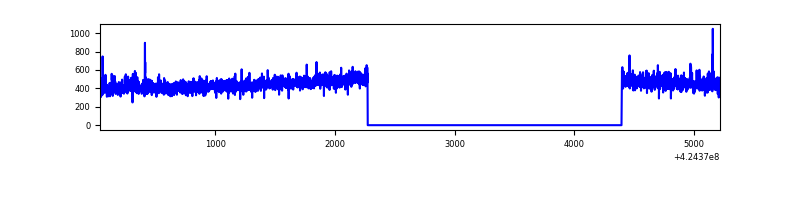 |
| C | 5182 | 3060 | 42 | 42 | 0.81% | 1.37% | 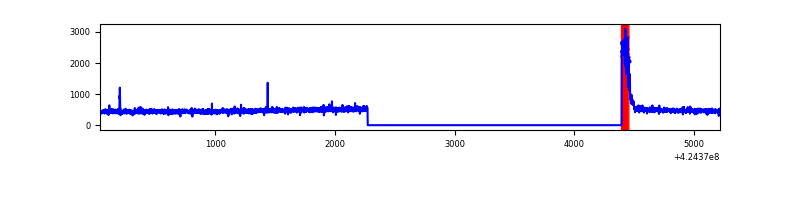 |
| D | 5182 | 3060 | 19 | 19 | 0.37% | 0.62% | 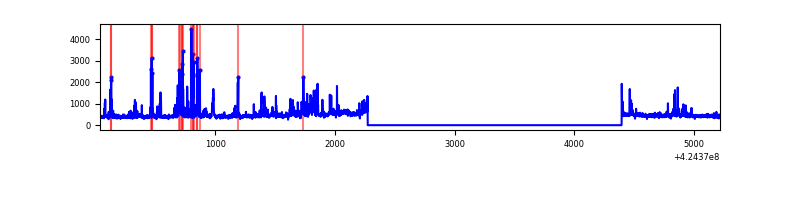 |
Top three noisy pixels from each quadrant. If the there are fewer than three noisy pixels in the level2.evt file, extra rows are filled as -1
| Pixel properties | Quadrant properties | ||||||
|---|---|---|---|---|---|---|---|
| Quadrant | DetID | PixID | Counts | Sigma | Mean | Median | Sigma |
| A | 10 | 83 | 292973 | 4115.93 | 339 | 333 | 71.1 |
| A | 15 | 223 | 144669 | 2030.06 | 339 | 333 | 71.1 |
| A | 2 | 79 | 20205 | 279.5 | 339 | 333 | 71.1 |
| B | 0 | 245 | 15117 | 221.05 | 338 | 330 | 66.9 |
| B | 0 | 190 | 13992 | 204.23 | 338 | 330 | 66.9 |
| B | 12 | 111 | 8275 | 118.77 | 338 | 330 | 66.9 |
| C | 0 | 10 | 134493 | 1697.2 | 331 | 333 | 79.0 |
| C | 15 | 214 | 123944 | 1563.75 | 331 | 333 | 79.0 |
| C | 15 | 111 | 5720 | 68.15 | 331 | 333 | 79.0 |
| D | 13 | 249 | 224142 | 2701.95 | 331 | 322 | 82.8 |
| D | 2 | 249 | 65841 | 790.94 | 331 | 322 | 82.8 |
| D | 12 | 6 | 35089 | 419.71 | 331 | 322 | 82.8 |
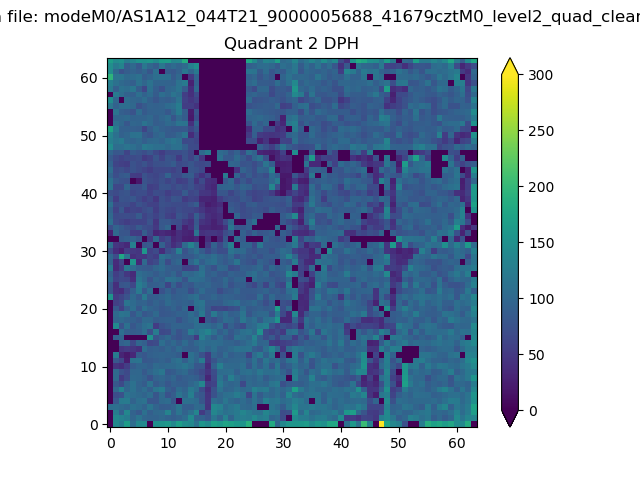
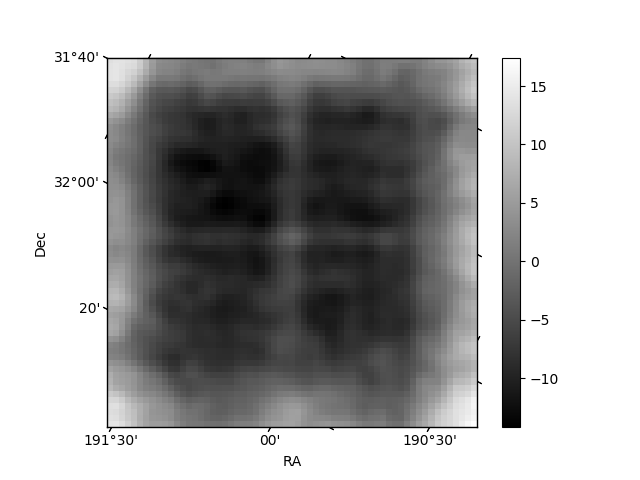
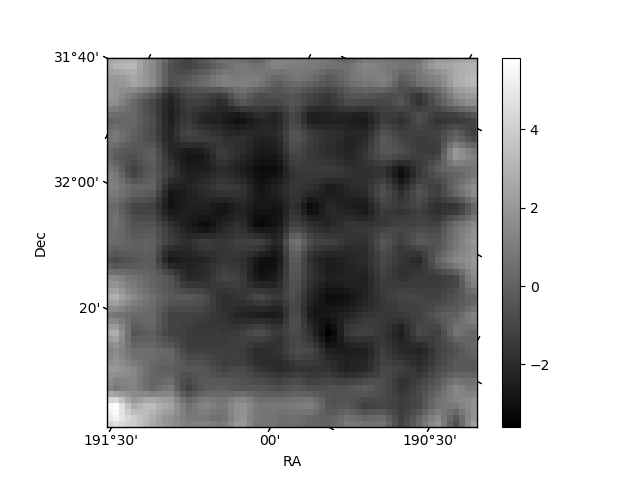
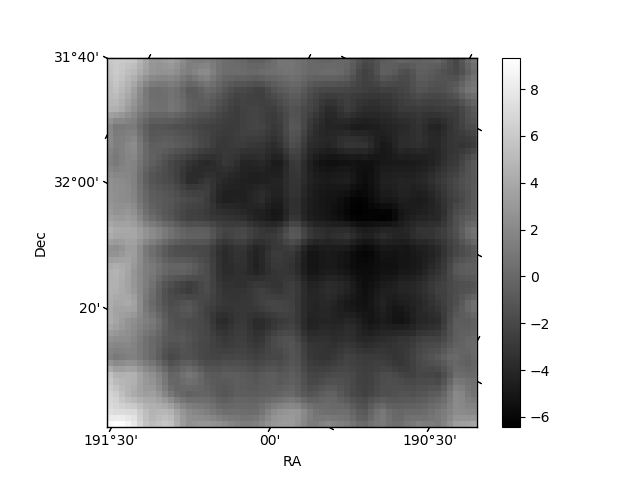
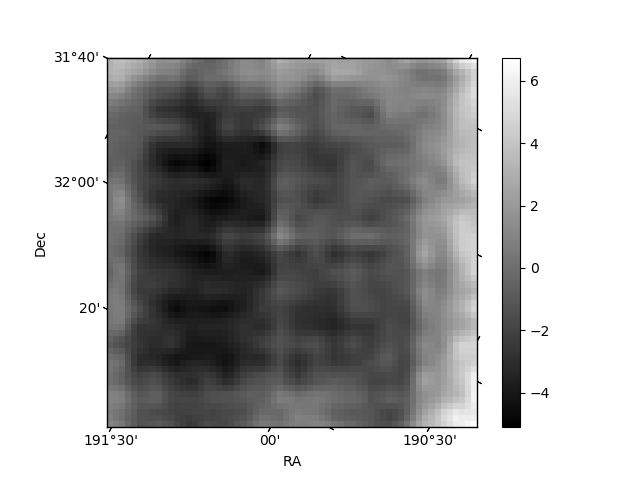
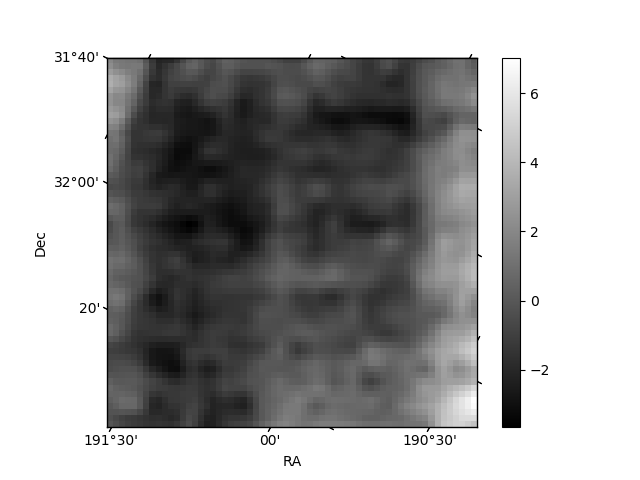
Histogram calculated using DETX and DETY for each event in the final _common_clean file
| Quadrant A | 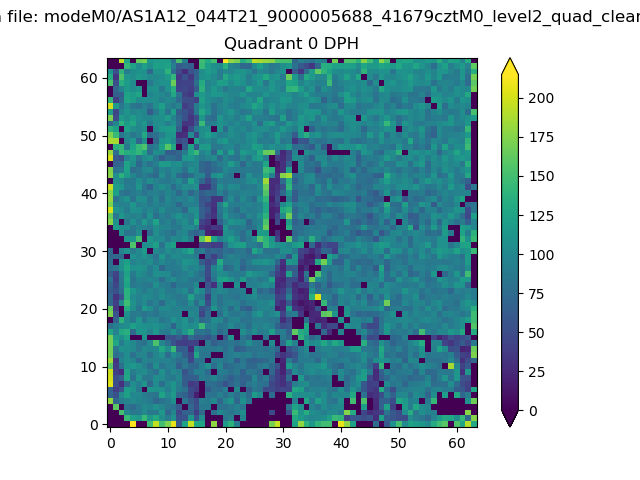 |
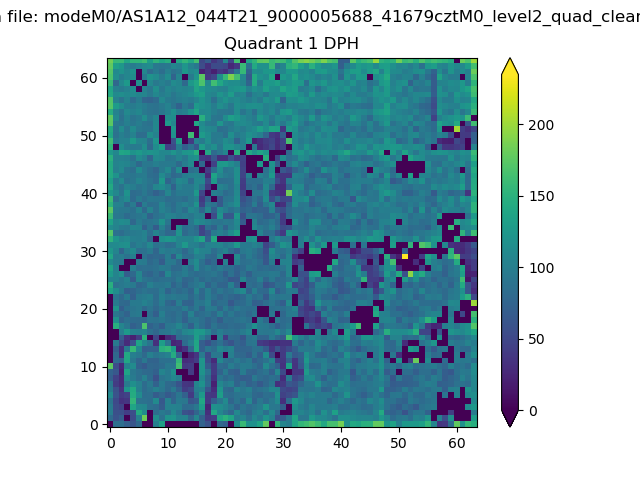 |
Quadrant B |
|---|---|---|---|
| Quadrant D | 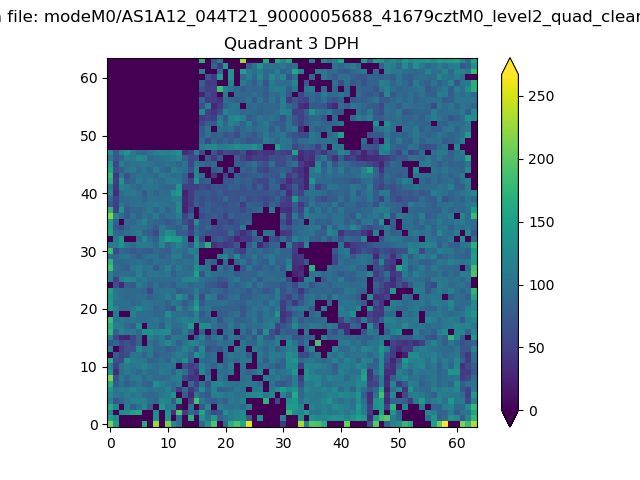 |
 |
Quadrant C |
| Plot type | Count rate plots | Images |
|---|---|---|
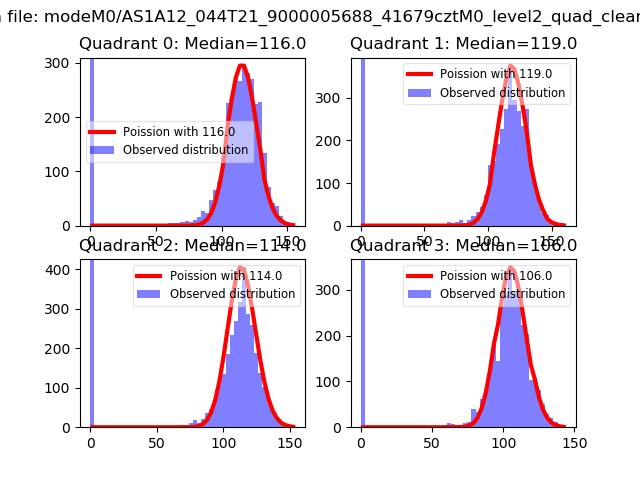
| Comparison with Poisson distribution Blue bars denote a histogram of data divided into 1 sec bins. Red curve is a Poisson curve with rate = median count rate of data. |
 |
 |
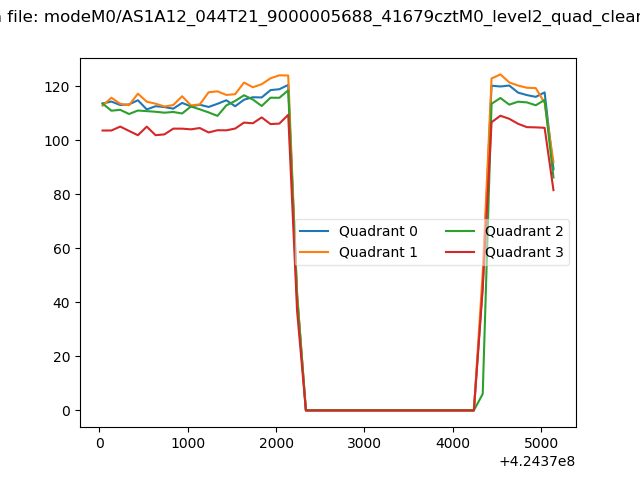
| Quadrant-wise count rates Data is divided into 100 sec bins |
 |
|
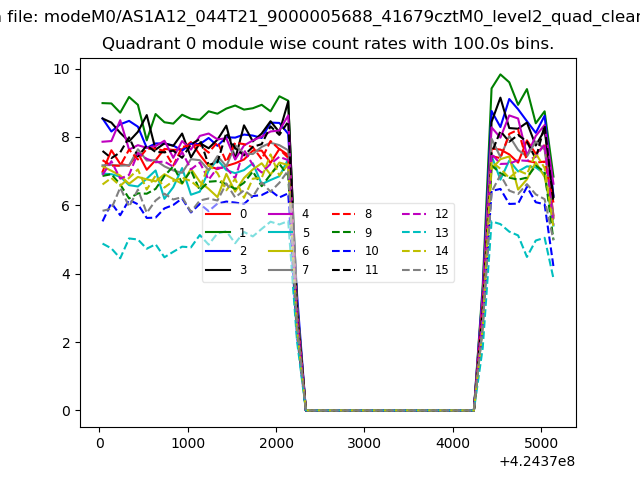
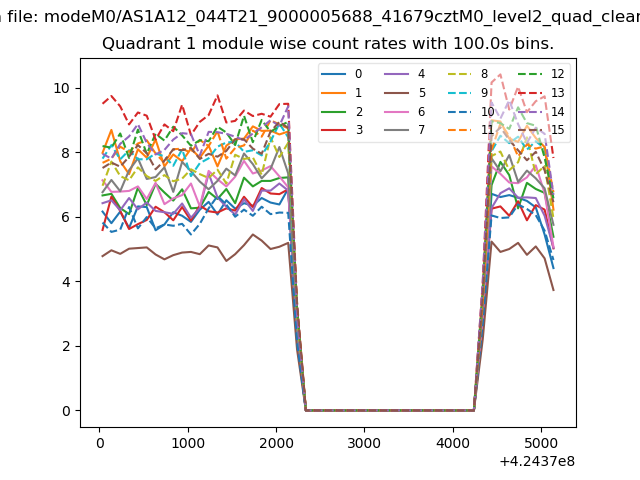
| Module-wise count rates for Quadrant A Data is divided into 100 sec bins |
 |
 |
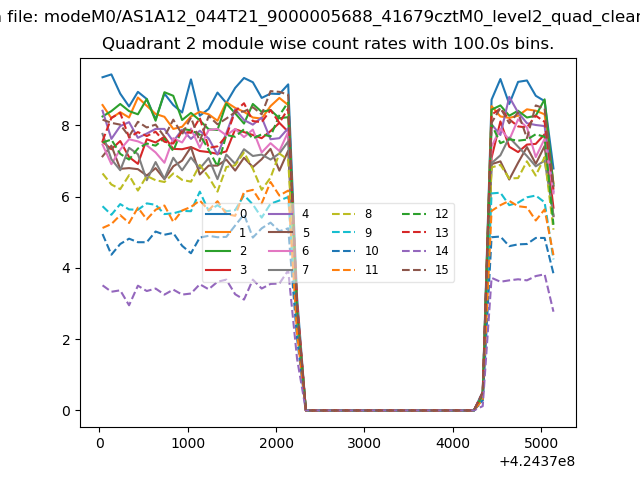
| Module-wise count rates for Quadrant B Data is divided into 100 sec bins |
 |
 |
| Module-wise count rates for Quadrant C Data is divided into 100 sec bins |
 |
 |
| Module-wise count rates for Quadrant D Data is divided into 100 sec bins |
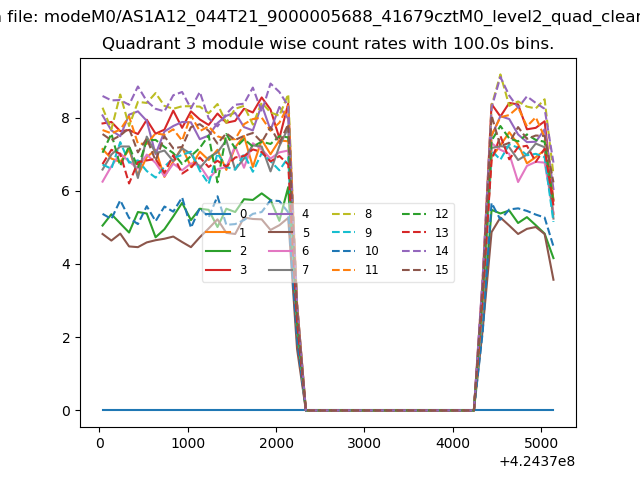 |
 |
| Parameter | Plot |
|---|---|
| CZT HV Monitor | 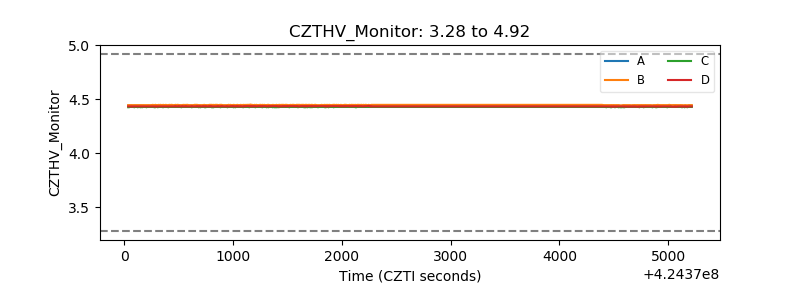 |
| D_VDD | 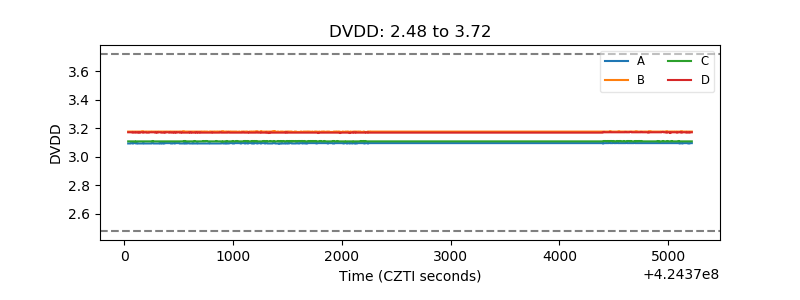 |
| Temperature 1 | 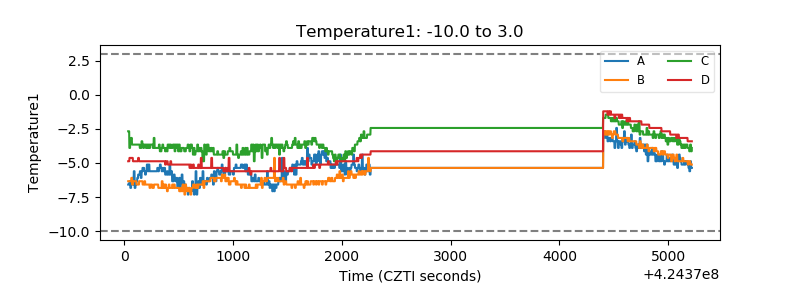 |
| Veto HV Monitor | 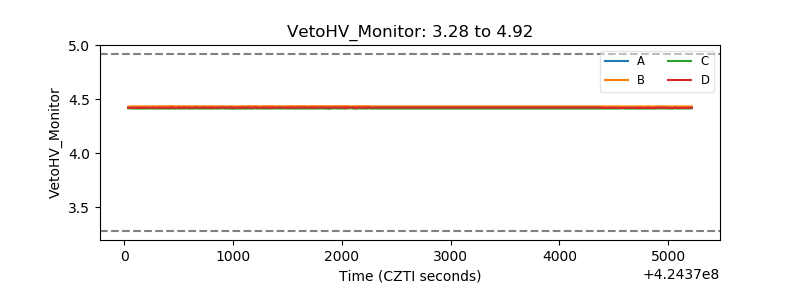 |
| Veto LLD | 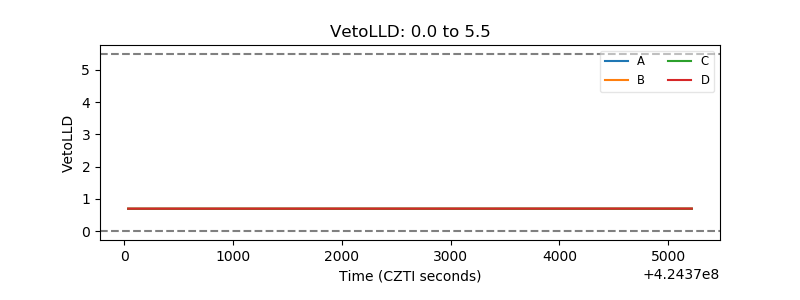 |
| Alpha Counter | 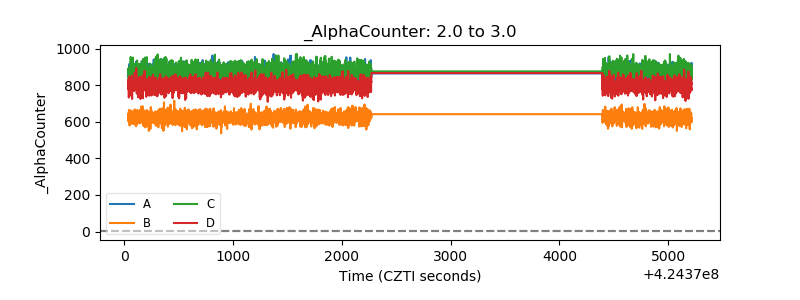 |
| _CPM_Rate | 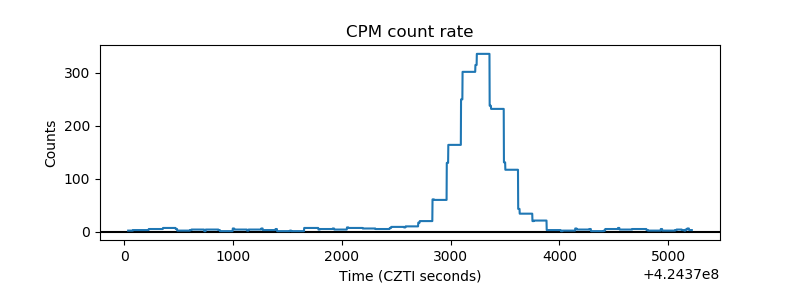 |
| CZT Counter | 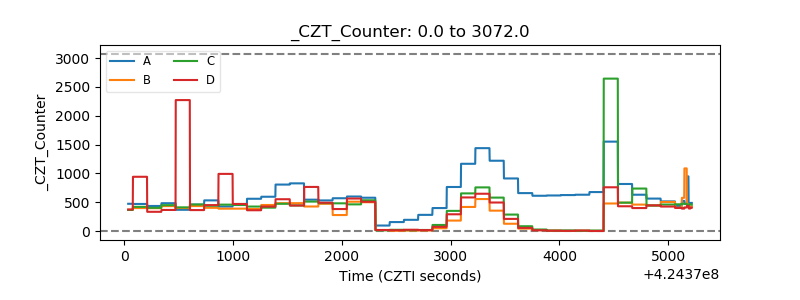 |
| +2.5 Volts monitor |  |
| +5 Volts monitor | 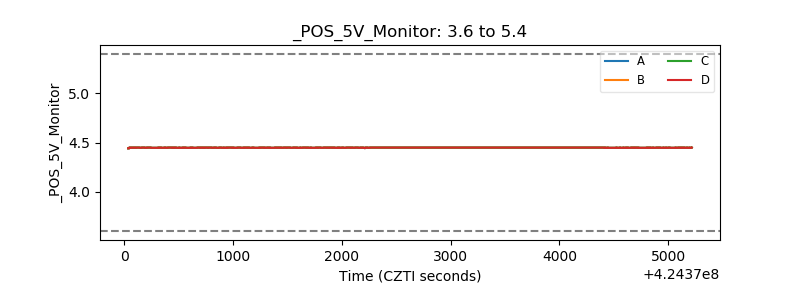 |
| _ROLL_ROT | 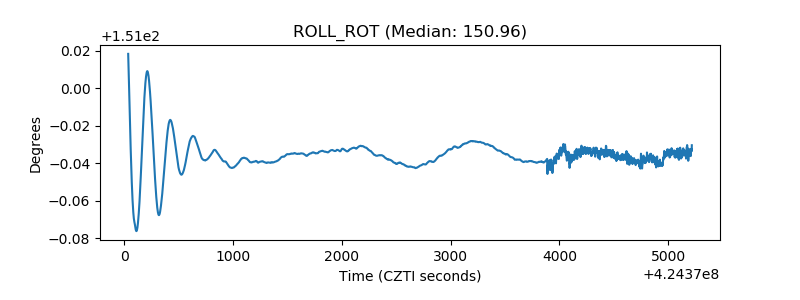 |
| _Roll_DEC | 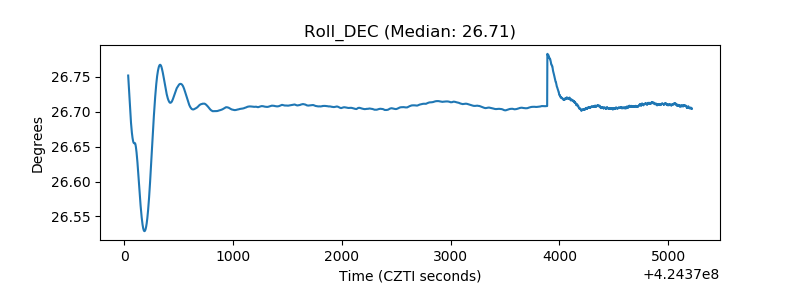 |
| _Roll_RA | 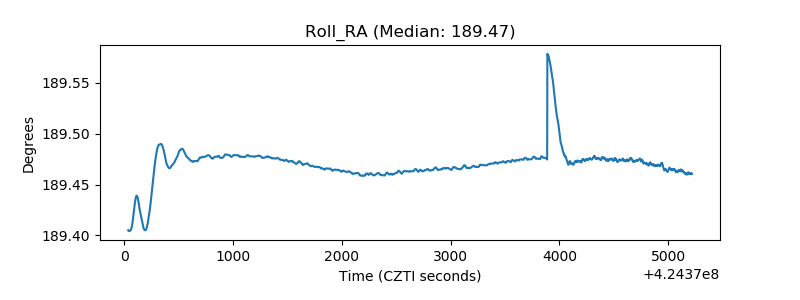 |
| Veto Counter | 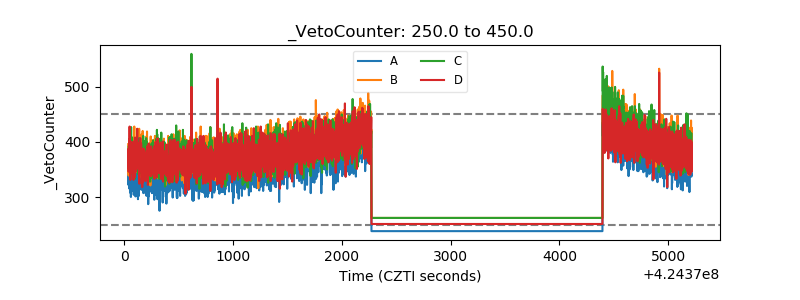 |