| Param | Original file | Final file |
|---|---|---|
| Filename | modeM0/AS1A12_044T21_9000005688_41680cztM0_level2.fits | modeM0/AS1A12_044T21_9000005688_41680cztM0_level2_quad_clean.evt |
| Size (bytes) | 286,395,840 | 83,606,400 |
| Size | 273.1 MB | 79.7 MB |
| Events in quadrant A | 2,678,689 | 561,214 |
| Events in quadrant B | 2,321,830 | 573,289 |
| Events in quadrant C | 2,549,318 | 541,305 |
| Events in quadrant D | 2,658,914 | 502,664 |
| Mode SS | |||
|---|---|---|---|
| Quadrant | BADHDUFLAG | Total packets | Discarded packets |
| A | 0 | 104 | 0 |
| B | 0 | 104 | 0 |
| C | 0 | 104 | 0 |
| D | 0 | 104 | 0 |
| Mode M9 | |||
|---|---|---|---|
| Quadrant | BADHDUFLAG | Total packets | Discarded packets |
| A | 0 | 27 | 0 |
| B | 0 | 28 | 0 |
| C | 0 | 28 | 0 |
| D | 0 | 28 | 0 |
| Mode M0 | |||
|---|---|---|---|
| Quadrant | BADHDUFLAG | Total packets | Discarded packets |
| A | 0 | 11085 | 2 |
| B | 0 | 10390 | 2 |
| C | 0 | 10863 | 2 |
| D | 0 | 11542 | 2 |
| Quadrant | Total seconds | Saturated seconds | Saturation percentage |
|---|---|---|---|
| A | 5032 | 15 | 0.298092% |
| B | 5032 | 30 | 0.596184% |
| C | 5032 | 85 | 1.689189% |
| D | 5032 | 87 | 1.728935% |
Noise dominated data is calculated using 1-second bins in cleaned event files. If a bin has >2000 counts, and if more than 50% of those come from <1% of pixels, then it is considered to be noise-dominated and hence unusable.
| Quadrant | # 1 sec bins | Bins with >0 counts | Bins with >2000 counts | High rate bins dominated by noise | Noise dominated (total time) | Noise dominated (detector-on time) | Marked lightcurve |
|---|---|---|---|---|---|---|---|
| A | 6975 | 5033 | 9 | 9 | 0.13% | 0.18% | 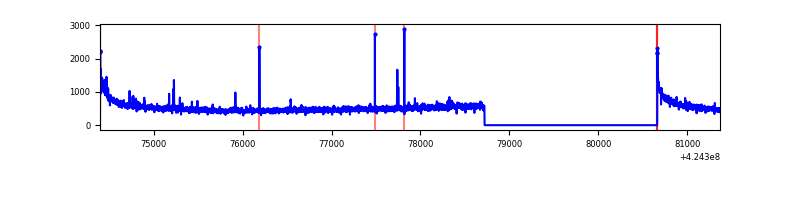 |
| B | 6975 | 5033 | 18 | 18 | 0.26% | 0.36% | 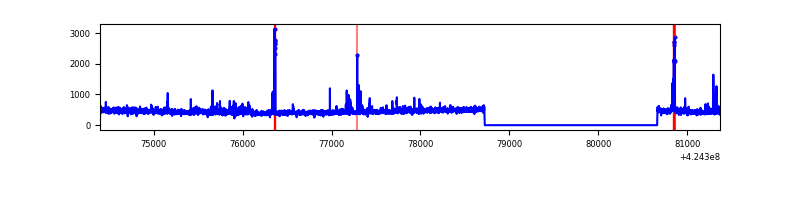 |
| C | 6975 | 5033 | 80 | 80 | 1.15% | 1.59% | 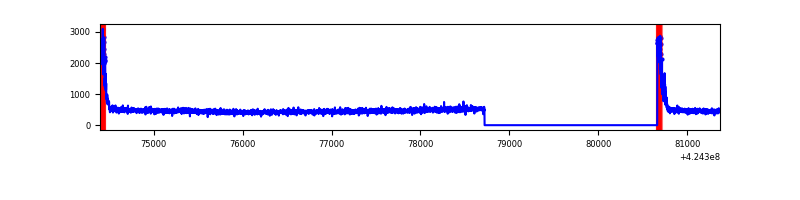 |
| D | 6975 | 5033 | 91 | 91 | 1.30% | 1.81% | 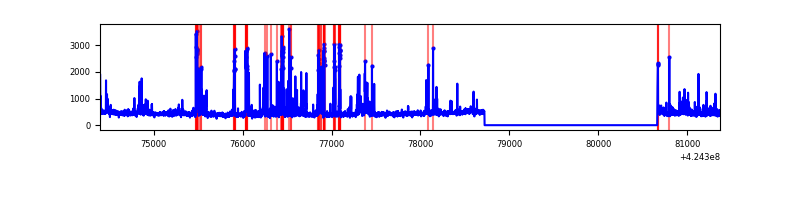 |
Top three noisy pixels from each quadrant. If the there are fewer than three noisy pixels in the level2.evt file, extra rows are filled as -1
| Pixel properties | Quadrant properties | ||||||
|---|---|---|---|---|---|---|---|
| Quadrant | DetID | PixID | Counts | Sigma | Mean | Median | Sigma |
| A | 10 | 83 | 516499 | 4563.48 | 546 | 535 | 113.1 |
| A | 2 | 79 | 41677 | 363.88 | 546 | 535 | 113.1 |
| A | 3 | 137 | 6170 | 49.84 | 546 | 535 | 113.1 |
| B | 0 | 245 | 71750 | 666.45 | 545 | 530 | 106.9 |
| B | 5 | 255 | 69950 | 649.6 | 545 | 530 | 106.9 |
| B | 0 | 190 | 20868 | 190.31 | 545 | 530 | 106.9 |
| C | 0 | 10 | 269231 | 2146.56 | 532 | 536 | 125.2 |
| C | 15 | 214 | 205318 | 1635.97 | 532 | 536 | 125.2 |
| C | 13 | 61 | 3464 | 23.39 | 532 | 536 | 125.2 |
| D | 13 | 249 | 386129 | 2942.41 | 531 | 516 | 131.1 |
| D | 2 | 249 | 68263 | 516.94 | 531 | 516 | 131.1 |
| D | 12 | 6 | 49912 | 376.91 | 531 | 516 | 131.1 |
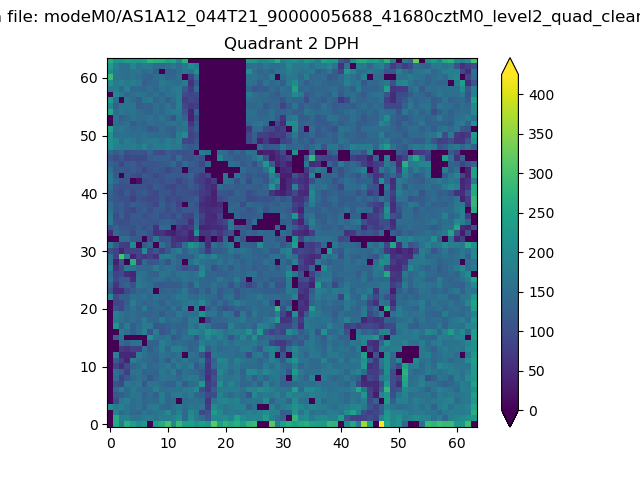
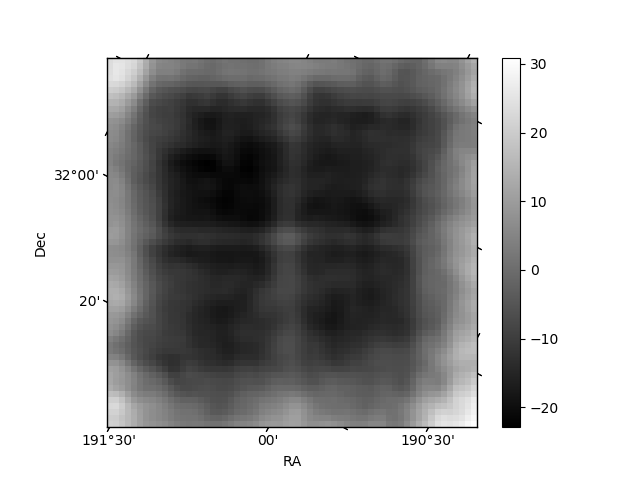
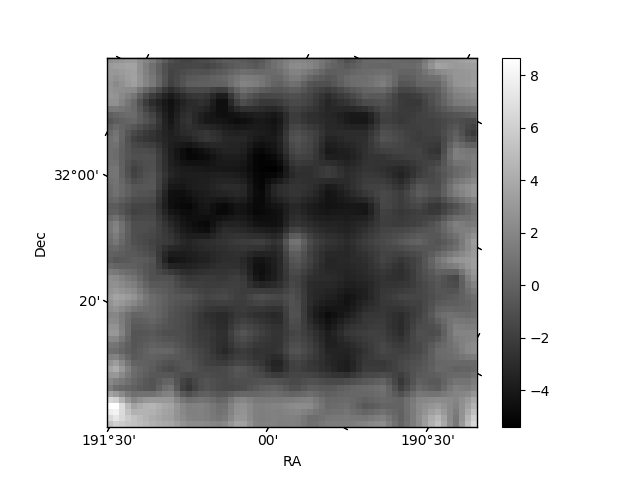
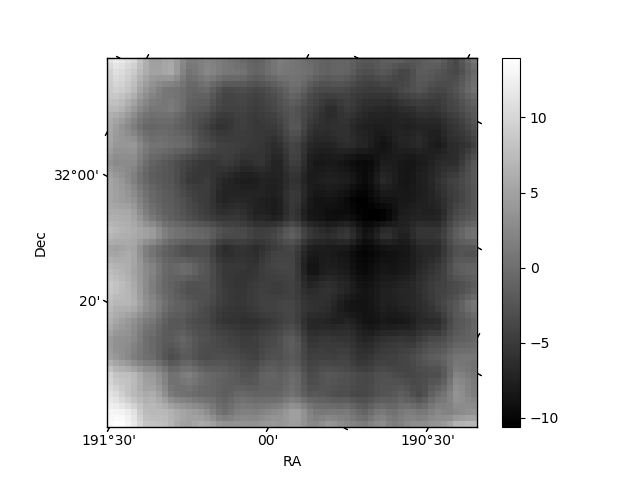
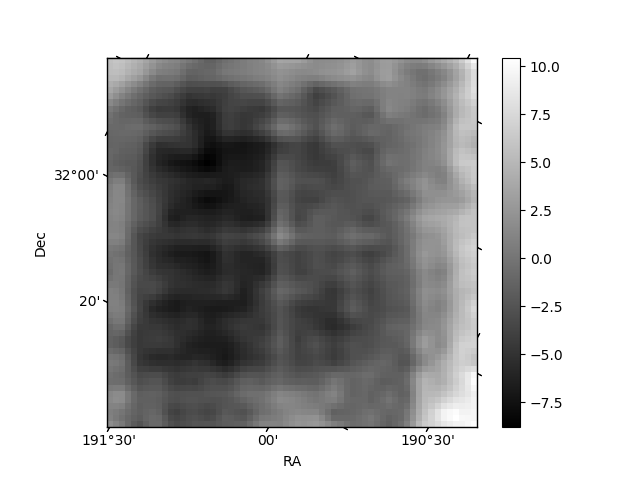
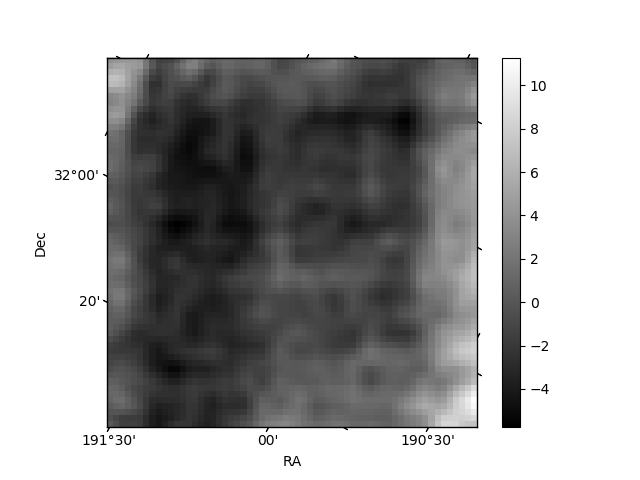
Histogram calculated using DETX and DETY for each event in the final _common_clean file
| Quadrant A | 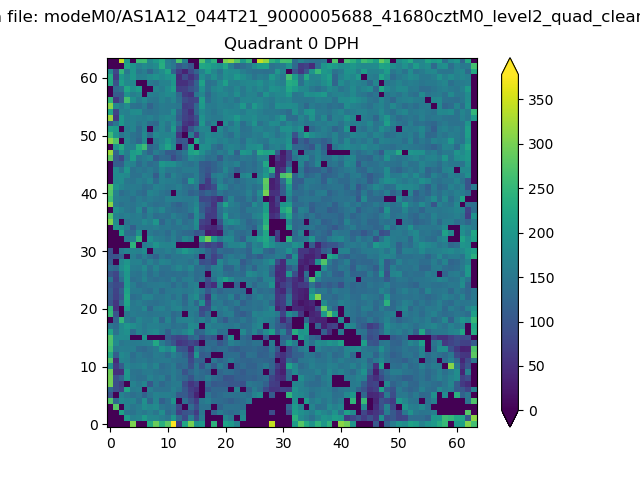 |
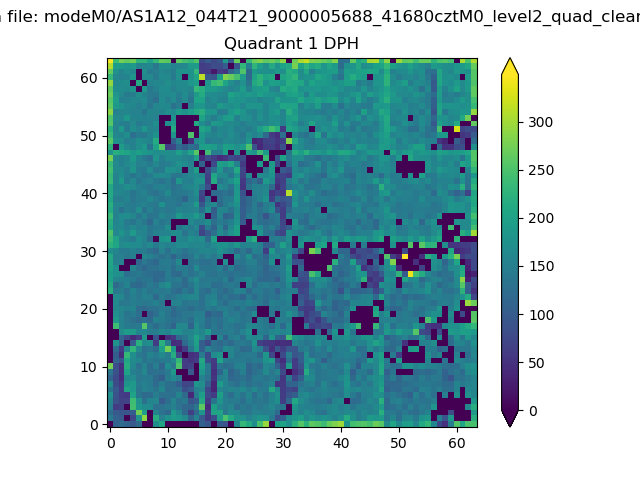 |
Quadrant B |
|---|---|---|---|
| Quadrant D | 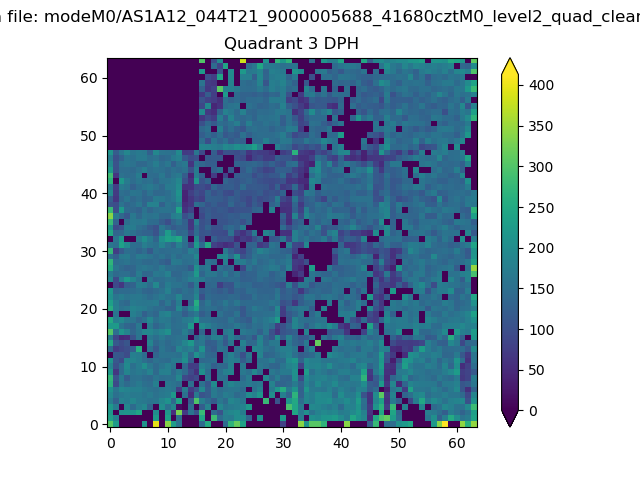 |
 |
Quadrant C |
| Plot type | Count rate plots | Images |
|---|---|---|
| Comparison with Poisson distribution Blue bars denote a histogram of data divided into 1 sec bins. Red curve is a Poisson curve with rate = median count rate of data. |
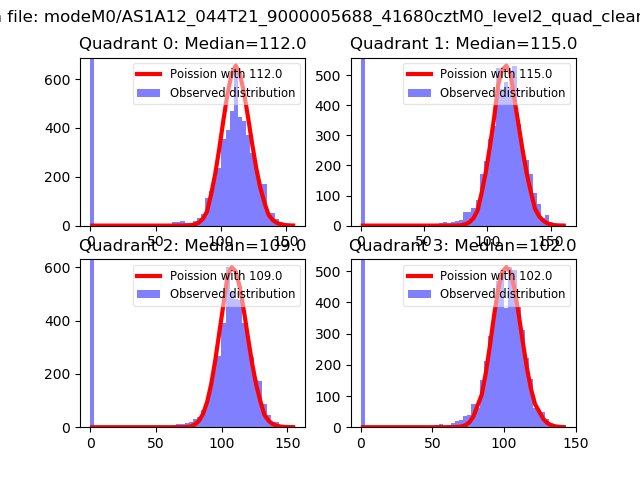 |
 |
| Quadrant-wise count rates Data is divided into 100 sec bins |
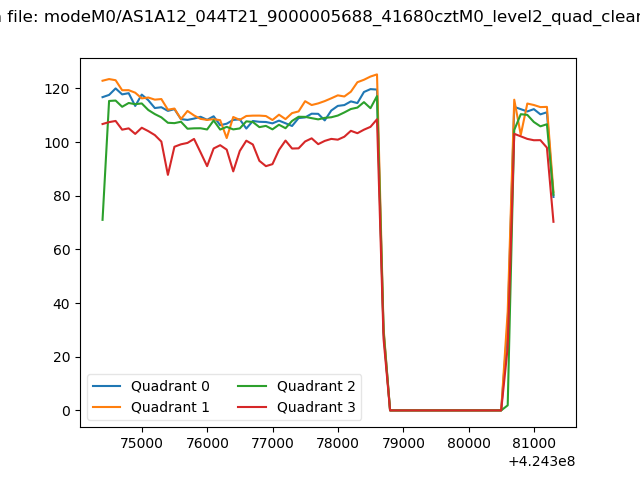 |
|
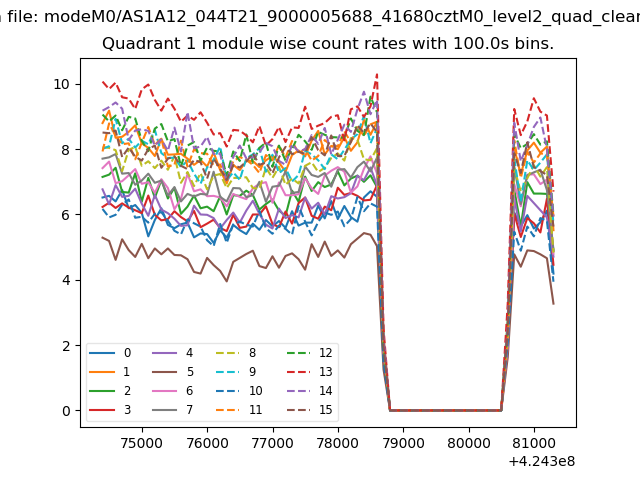
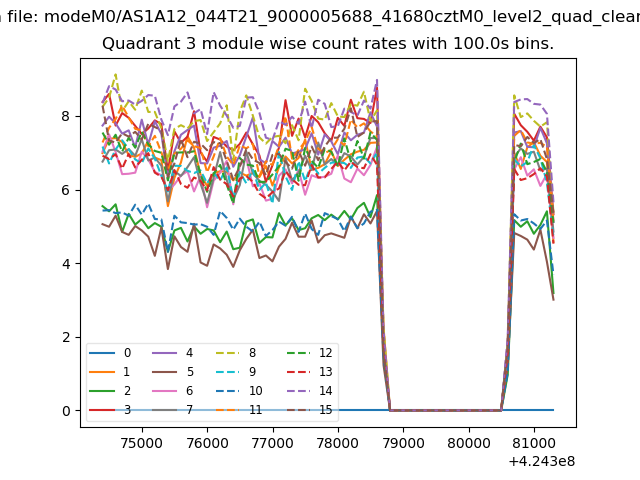
| Module-wise count rates for Quadrant A Data is divided into 100 sec bins |
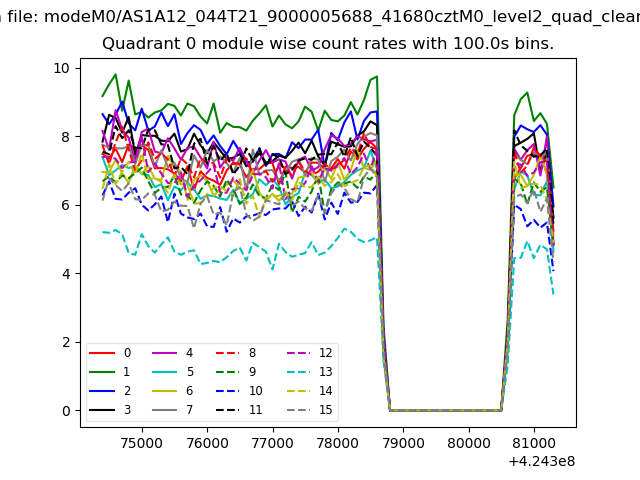 |
 |
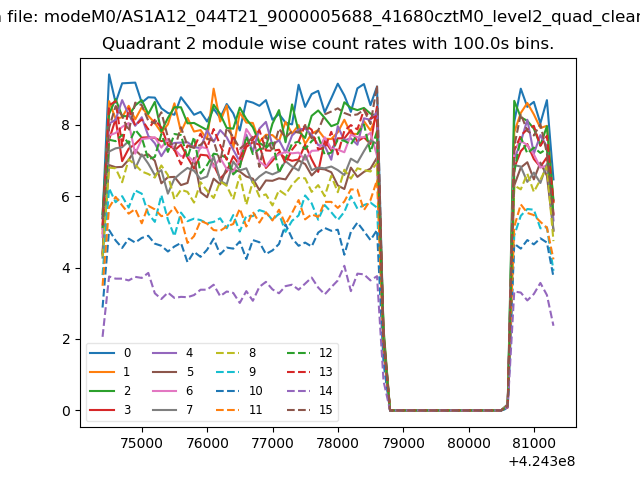
| Module-wise count rates for Quadrant B Data is divided into 100 sec bins |
 |
 |
| Module-wise count rates for Quadrant C Data is divided into 100 sec bins |
 |
 |
| Module-wise count rates for Quadrant D Data is divided into 100 sec bins |
 |
 |
| Parameter | Plot |
|---|---|
| CZT HV Monitor | 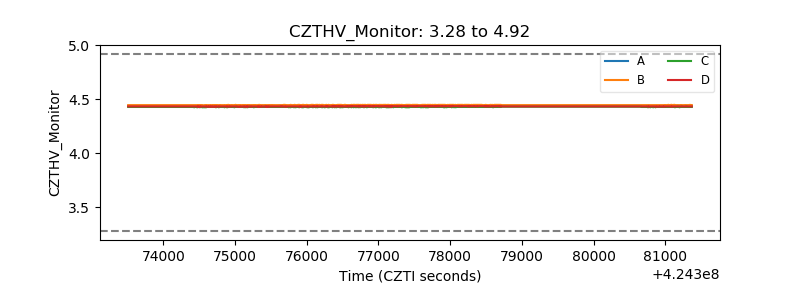 |
| D_VDD | 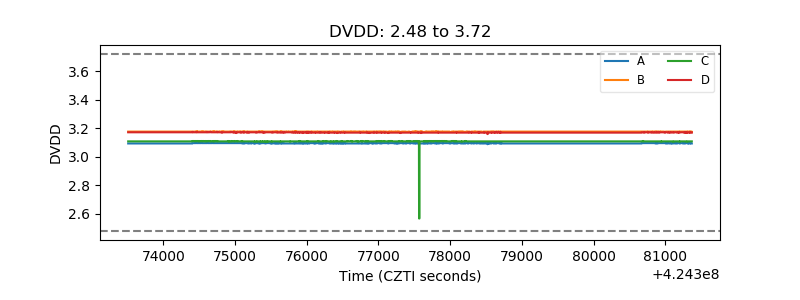 |
| Temperature 1 | 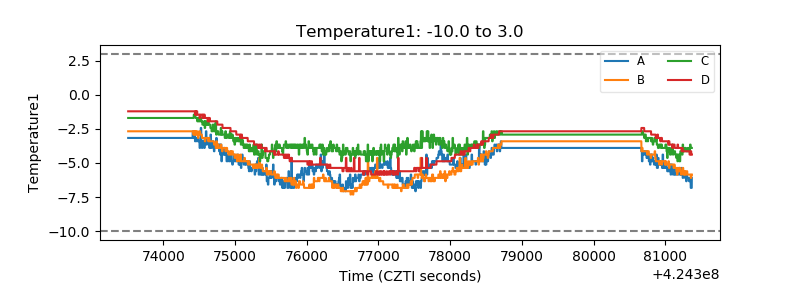 |
| Veto HV Monitor |  |
| Veto LLD | 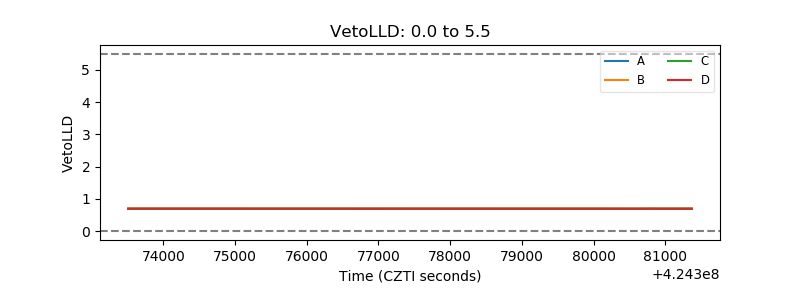 |
| Alpha Counter |  |
| _CPM_Rate | 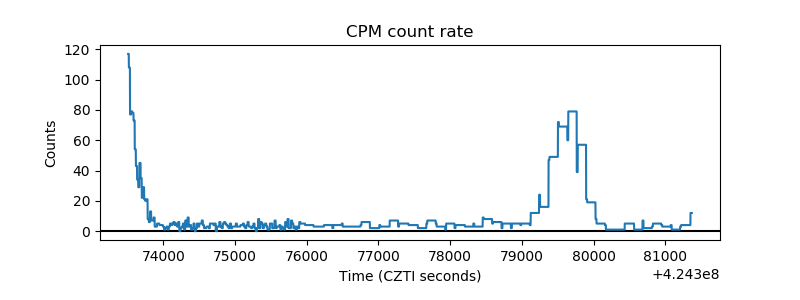 |
| CZT Counter | 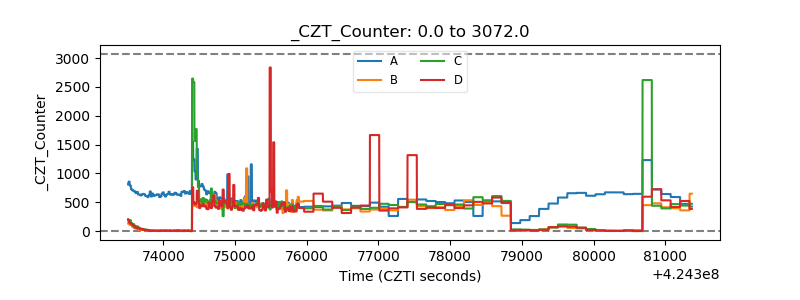 |
| +2.5 Volts monitor | 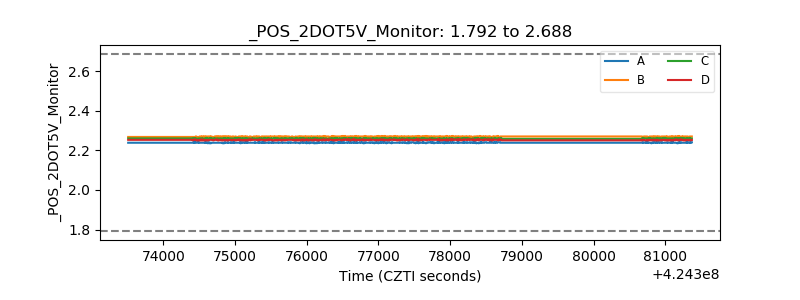 |
| +5 Volts monitor | 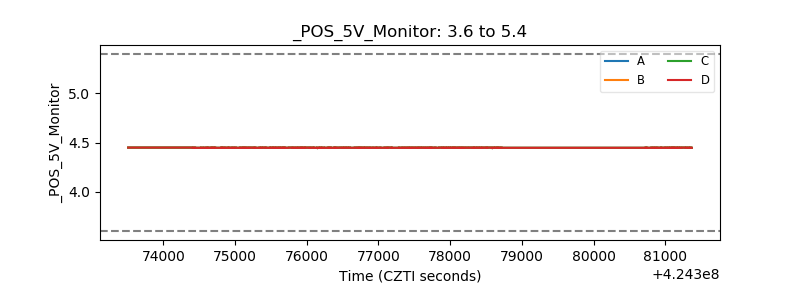 |
| _ROLL_ROT | 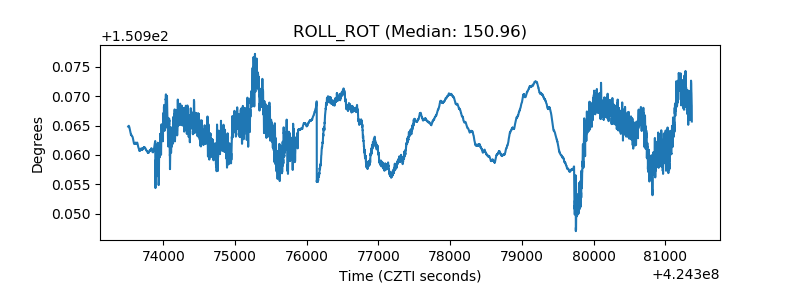 |
| _Roll_DEC | 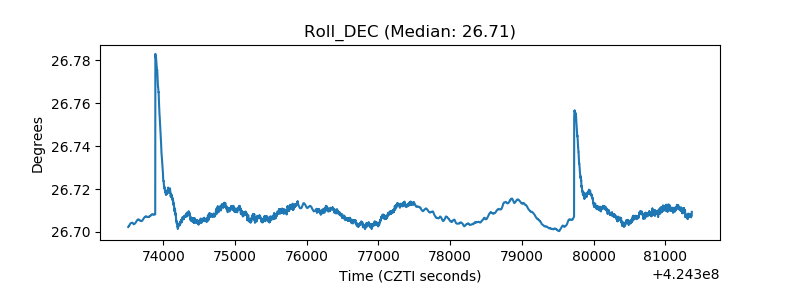 |
| _Roll_RA | 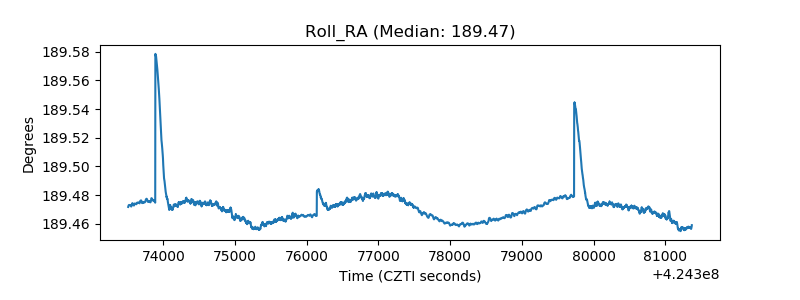 |
| Veto Counter | 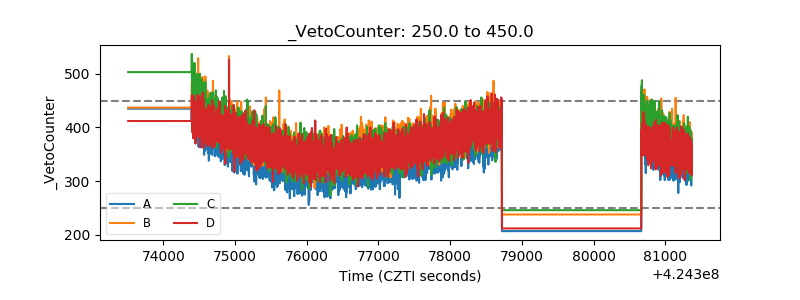 |