| Param | Original file | Final file |
|---|---|---|
| Filename | modeM0/AS1A12_044T21_9000005688_41681cztM0_level2.fits | modeM0/AS1A12_044T21_9000005688_41681cztM0_level2_quad_clean.evt |
| Size (bytes) | 313,885,440 | 88,706,880 |
| Size | 299.3 MB | 84.6 MB |
| Events in quadrant A | 2,900,002 | 592,082 |
| Events in quadrant B | 2,497,676 | 605,970 |
| Events in quadrant C | 2,768,722 | 574,505 |
| Events in quadrant D | 3,027,493 | 531,900 |
| Mode SS | |||
|---|---|---|---|
| Quadrant | BADHDUFLAG | Total packets | Discarded packets |
| A | 0 | 110 | 0 |
| B | 0 | 110 | 0 |
| C | 0 | 110 | 0 |
| D | 0 | 110 | 0 |
| Mode M9 | |||
|---|---|---|---|
| Quadrant | BADHDUFLAG | Total packets | Discarded packets |
| A | 0 | 34 | 0 |
| B | 0 | 35 | 0 |
| C | 0 | 35 | 0 |
| D | 0 | 35 | 0 |
| Mode M0 | |||
|---|---|---|---|
| Quadrant | BADHDUFLAG | Total packets | Discarded packets |
| A | 0 | 12023 | 2 |
| B | 0 | 11294 | 2 |
| C | 0 | 11817 | 2 |
| D | 0 | 12929 | 2 |
| Quadrant | Total seconds | Saturated seconds | Saturation percentage |
|---|---|---|---|
| A | 5455 | 16 | 0.293309% |
| B | 5455 | 21 | 0.384968% |
| C | 5455 | 89 | 1.631531% |
| D | 5455 | 120 | 2.199817% |
Noise dominated data is calculated using 1-second bins in cleaned event files. If a bin has >2000 counts, and if more than 50% of those come from <1% of pixels, then it is considered to be noise-dominated and hence unusable.
| Quadrant | # 1 sec bins | Bins with >0 counts | Bins with >2000 counts | High rate bins dominated by noise | Noise dominated (total time) | Noise dominated (detector-on time) | Marked lightcurve |
|---|---|---|---|---|---|---|---|
| A | 7097 | 5456 | 7 | 7 | 0.10% | 0.13% | 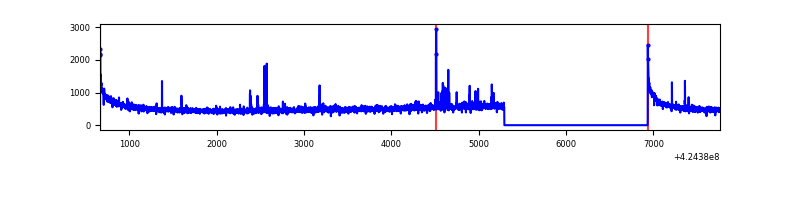 |
| B | 7097 | 5456 | 13 | 13 | 0.18% | 0.24% | 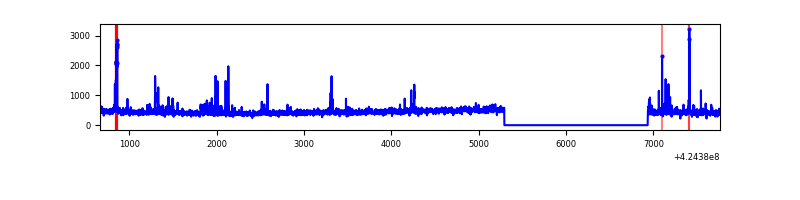 |
| C | 7097 | 5456 | 89 | 89 | 1.25% | 1.63% | 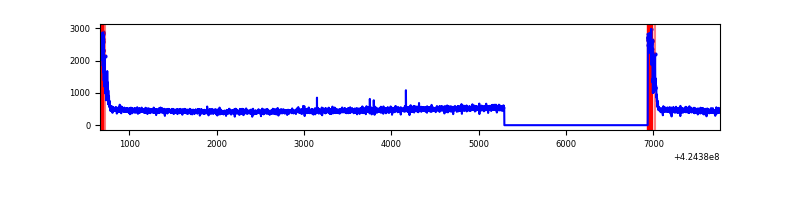 |
| D | 7097 | 5456 | 102 | 102 | 1.44% | 1.87% | 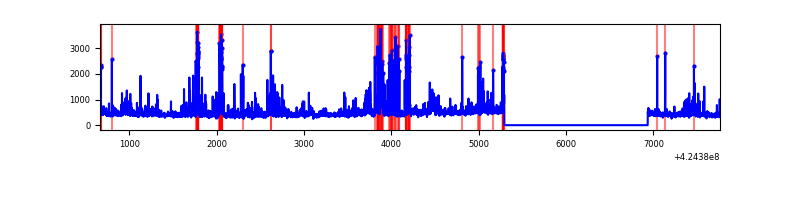 |
Top three noisy pixels from each quadrant. If the there are fewer than three noisy pixels in the level2.evt file, extra rows are filled as -1
| Pixel properties | Quadrant properties | ||||||
|---|---|---|---|---|---|---|---|
| Quadrant | DetID | PixID | Counts | Sigma | Mean | Median | Sigma |
| A | 10 | 83 | 529726 | 4365.29 | 590 | 578 | 121.2 |
| A | 13 | 248 | 44425 | 361.72 | 590 | 578 | 121.2 |
| A | 2 | 79 | 27880 | 225.23 | 590 | 578 | 121.2 |
| B | 5 | 255 | 105864 | 911.15 | 587 | 571 | 115.6 |
| B | 0 | 245 | 53619 | 459.05 | 587 | 571 | 115.6 |
| B | 12 | 111 | 14923 | 124.19 | 587 | 571 | 115.6 |
| C | 0 | 10 | 301580 | 2232.08 | 575 | 577 | 134.9 |
| C | 15 | 214 | 223012 | 1649.46 | 575 | 577 | 134.9 |
| C | 14 | 254 | 6011 | 40.3 | 575 | 577 | 134.9 |
| D | 12 | 6 | 244505 | 1718.74 | 572 | 557 | 141.9 |
| D | 13 | 249 | 236759 | 1664.16 | 572 | 557 | 141.9 |
| D | 2 | 249 | 221565 | 1557.11 | 572 | 557 | 141.9 |
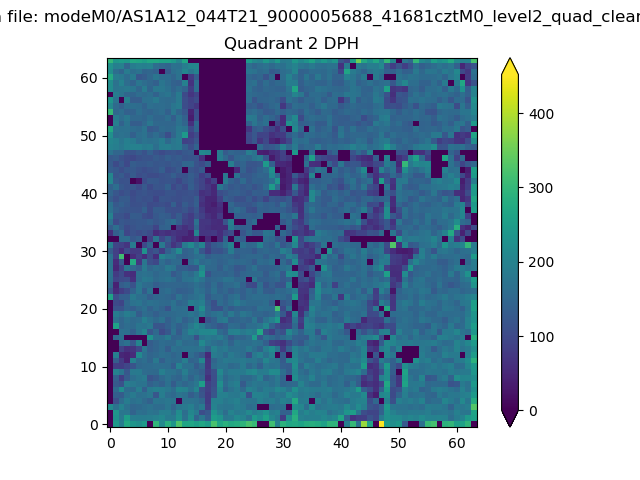
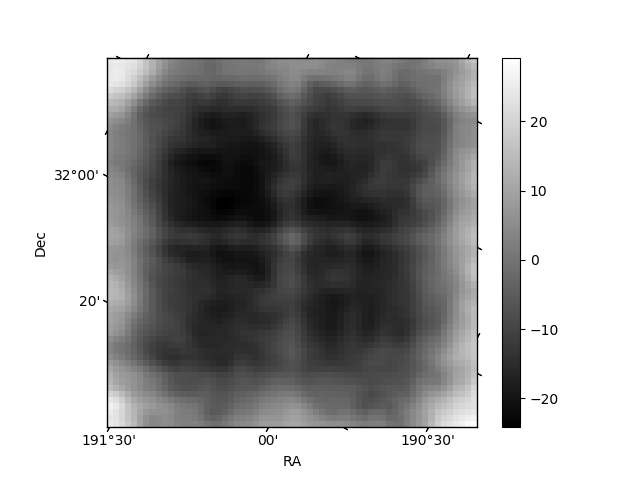
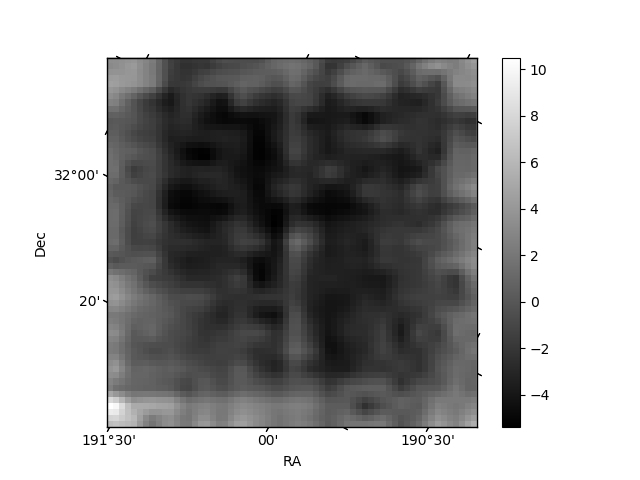
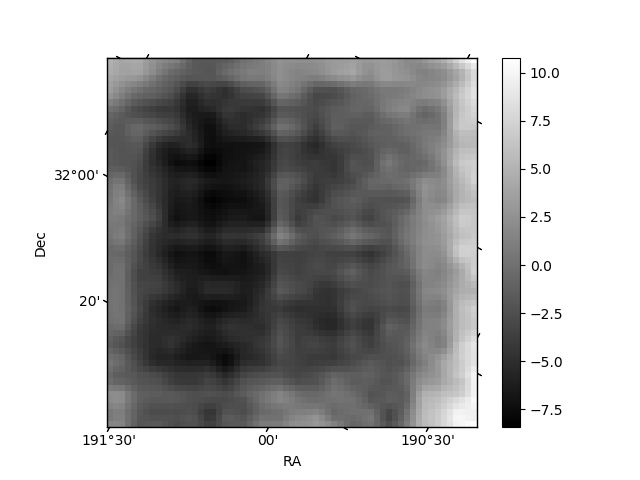
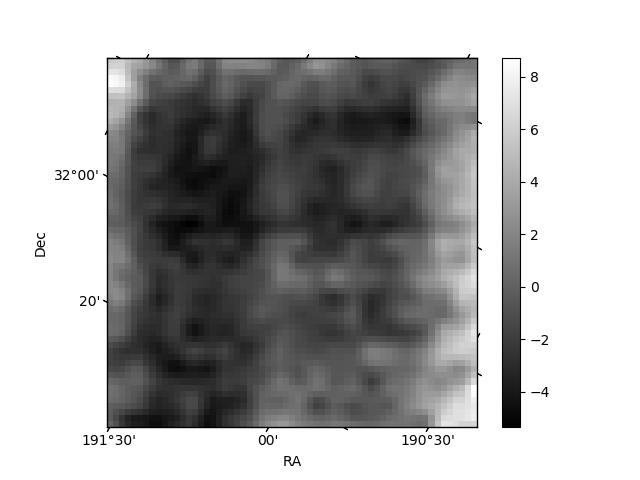
Histogram calculated using DETX and DETY for each event in the final _common_clean file
| Quadrant A | 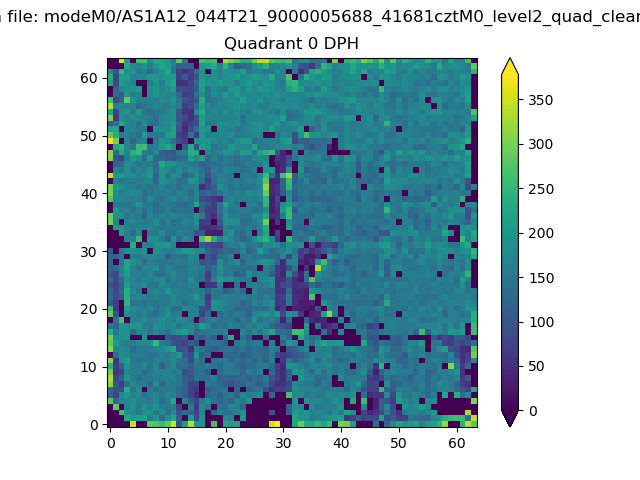 |
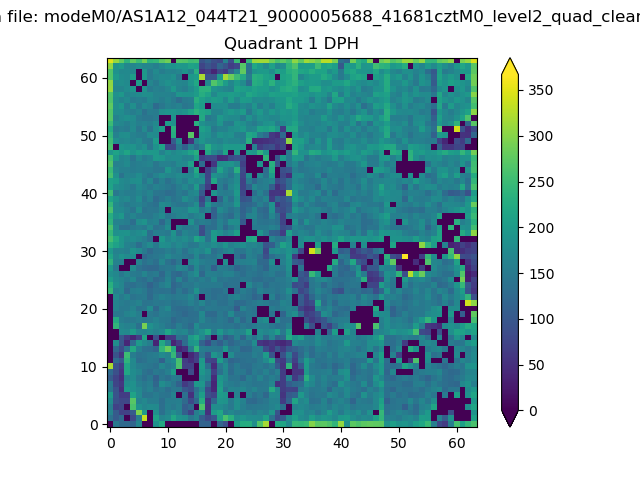 |
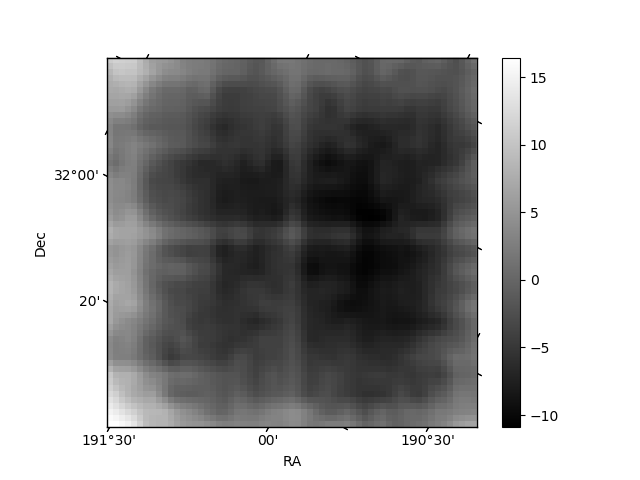
Quadrant B |
|---|---|---|---|
| Quadrant D | 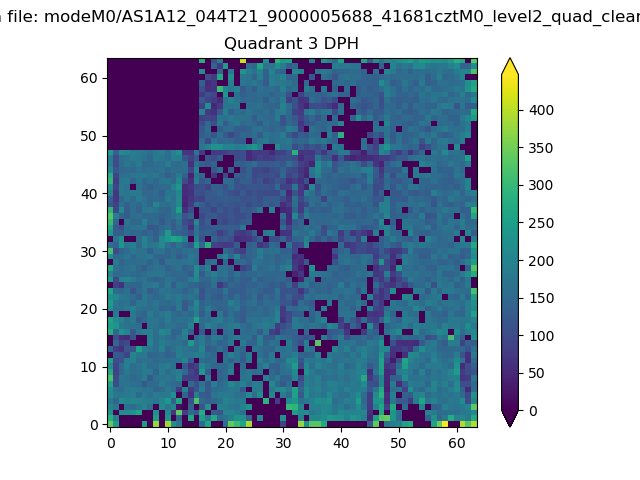 |
 |
Quadrant C |
| Plot type | Count rate plots | Images |
|---|---|---|
| Comparison with Poisson distribution Blue bars denote a histogram of data divided into 1 sec bins. Red curve is a Poisson curve with rate = median count rate of data. |
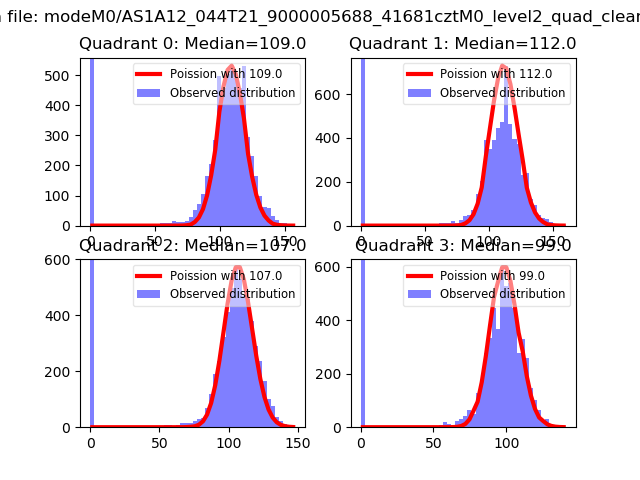 |
 |
| Quadrant-wise count rates Data is divided into 100 sec bins |
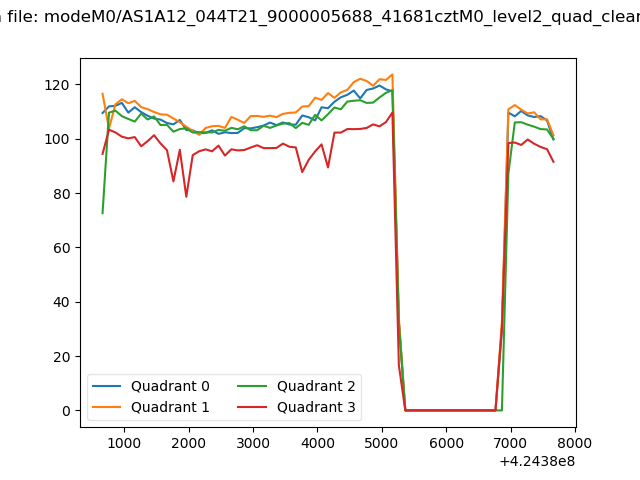 |
|
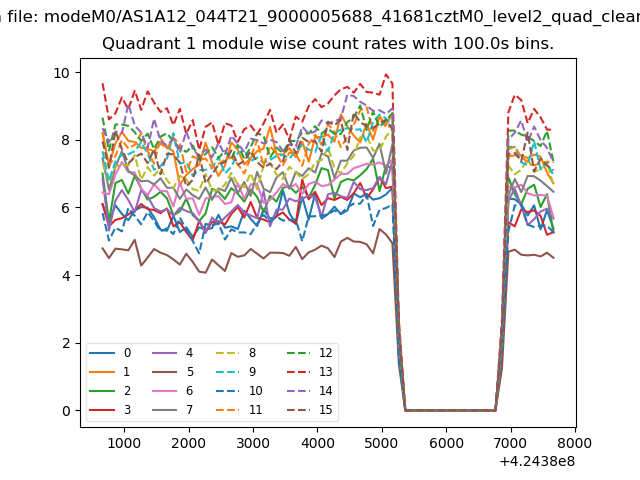
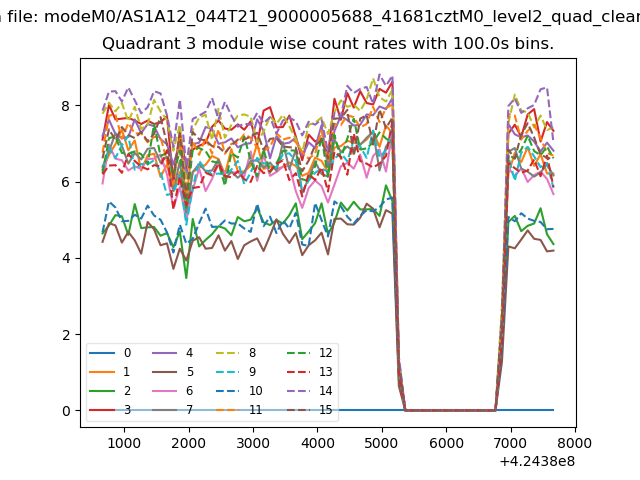
| Module-wise count rates for Quadrant A Data is divided into 100 sec bins |
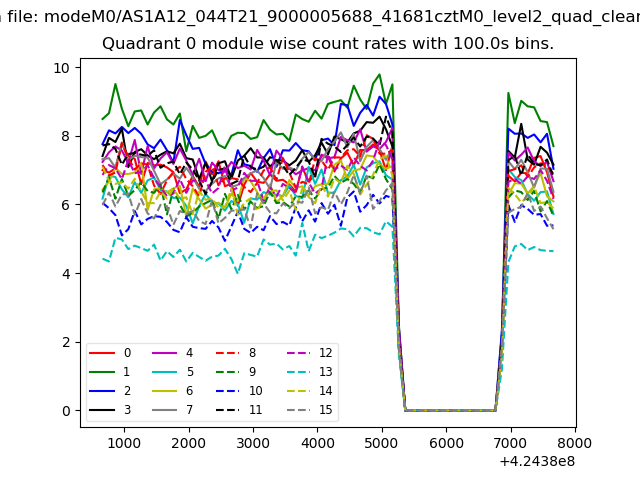 |
 |
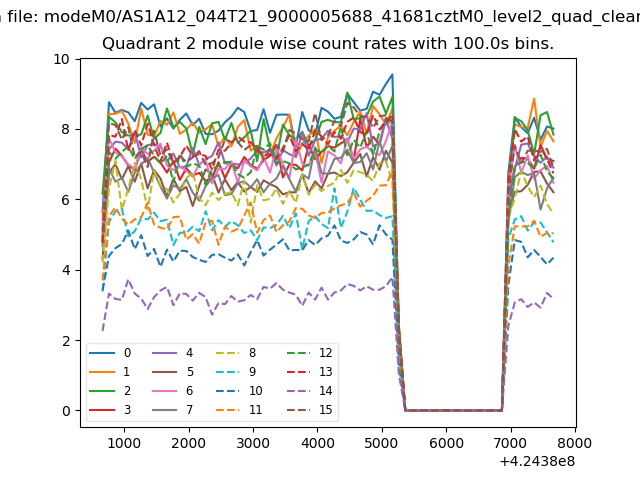
| Module-wise count rates for Quadrant B Data is divided into 100 sec bins |
 |
 |
| Module-wise count rates for Quadrant C Data is divided into 100 sec bins |
 |
 |
| Module-wise count rates for Quadrant D Data is divided into 100 sec bins |
 |
 |
| Parameter | Plot |
|---|---|
| CZT HV Monitor | 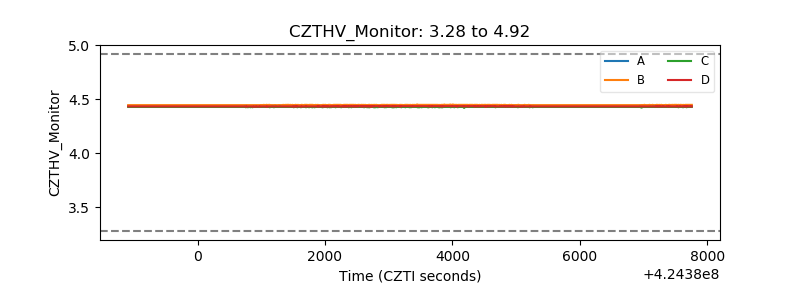 |
| D_VDD | 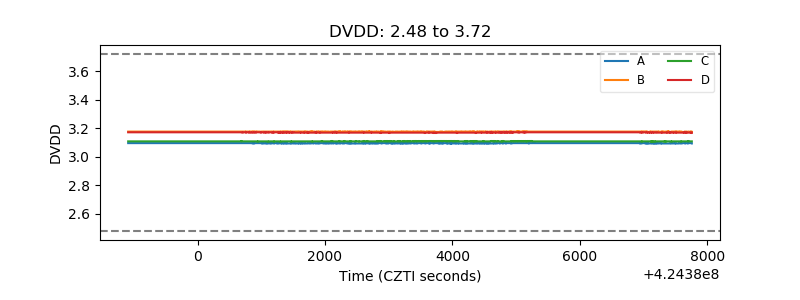 |
| Temperature 1 | 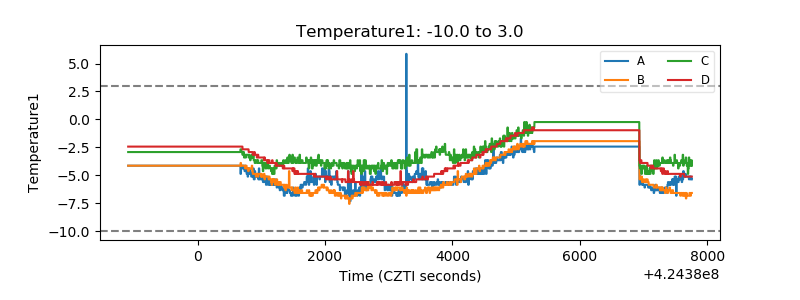 |
| Veto HV Monitor |  |
| Veto LLD | 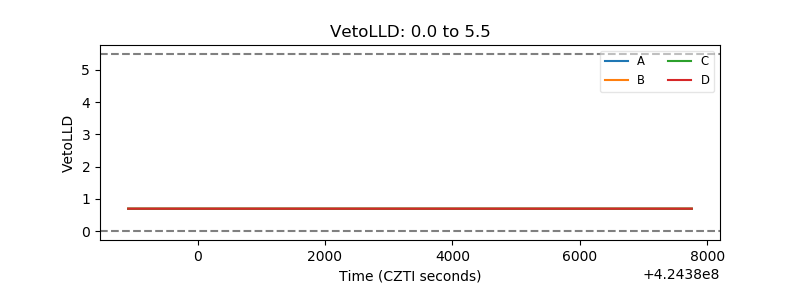 |
| Alpha Counter | 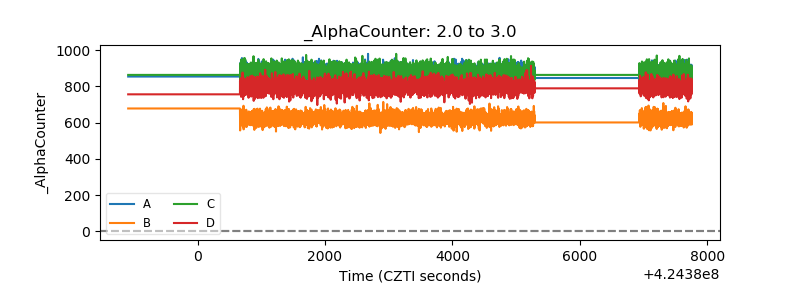 |
| _CPM_Rate | 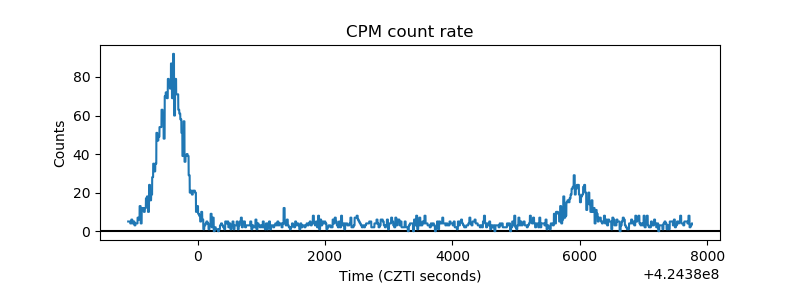 |
| CZT Counter | 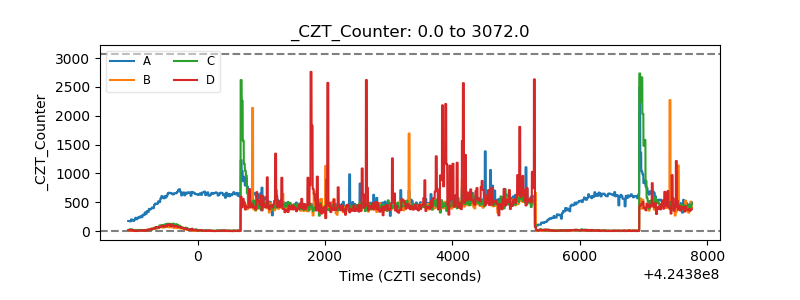 |
| +2.5 Volts monitor | 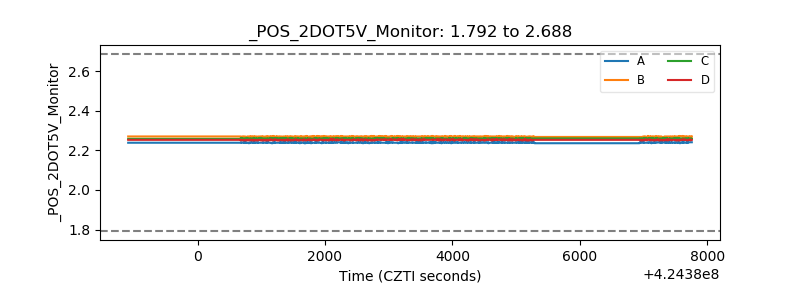 |
| +5 Volts monitor | 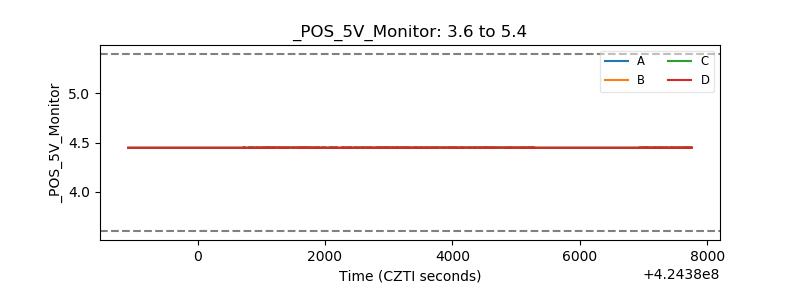 |
| _ROLL_ROT | 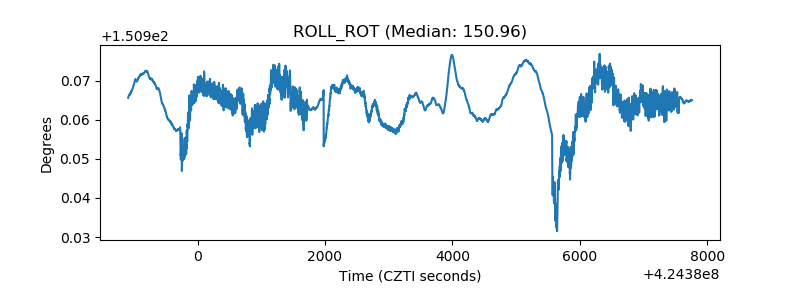 |
| _Roll_DEC | 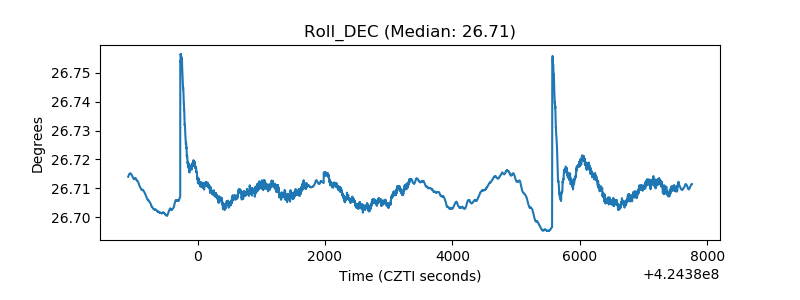 |
| _Roll_RA | 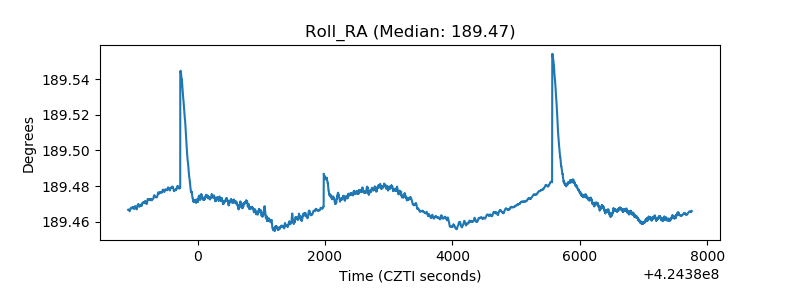 |
| Veto Counter | 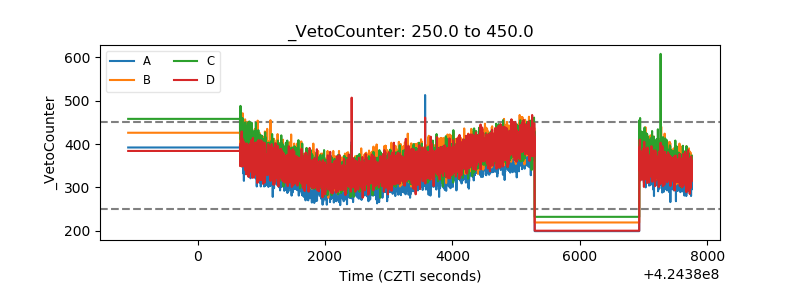 |