| Param | Original file | Final file |
|---|---|---|
| Filename | modeM0/AS1A12_044T21_9000005688_41682cztM0_level2.fits | modeM0/AS1A12_044T21_9000005688_41682cztM0_level2_quad_clean.evt |
| Size (bytes) | 333,555,840 | 95,198,400 |
| Size | 318.1 MB | 90.8 MB |
| Events in quadrant A | 3,144,270 | 636,872 |
| Events in quadrant B | 2,722,906 | 648,417 |
| Events in quadrant C | 2,959,217 | 613,238 |
| Events in quadrant D | 3,062,327 | 572,926 |
| Mode SS | |||
|---|---|---|---|
| Quadrant | BADHDUFLAG | Total packets | Discarded packets |
| A | 0 | 122 | 0 |
| B | 0 | 122 | 0 |
| C | 0 | 122 | 0 |
| D | 0 | 122 | 0 |
| Mode M9 | |||
|---|---|---|---|
| Quadrant | BADHDUFLAG | Total packets | Discarded packets |
| A | 0 | 30 | 0 |
| B | 0 | 30 | 0 |
| C | 0 | 30 | 0 |
| D | 0 | 30 | 0 |
| Mode M0 | |||
|---|---|---|---|
| Quadrant | BADHDUFLAG | Total packets | Discarded packets |
| A | 0 | 12967 | 2 |
| B | 0 | 12324 | 2 |
| C | 0 | 12627 | 2 |
| D | 0 | 13460 | 2 |
| Quadrant | Total seconds | Saturated seconds | Saturation percentage |
|---|---|---|---|
| A | 5883 | 18 | 0.305966% |
| B | 5884 | 31 | 0.526852% |
| C | 5883 | 92 | 1.563828% |
| D | 5883 | 75 | 1.274860% |
Noise dominated data is calculated using 1-second bins in cleaned event files. If a bin has >2000 counts, and if more than 50% of those come from <1% of pixels, then it is considered to be noise-dominated and hence unusable.
| Quadrant | # 1 sec bins | Bins with >0 counts | Bins with >2000 counts | High rate bins dominated by noise | Noise dominated (total time) | Noise dominated (detector-on time) | Marked lightcurve |
|---|---|---|---|---|---|---|---|
| A | 8899 | 5885 | 13 | 13 | 0.15% | 0.22% | 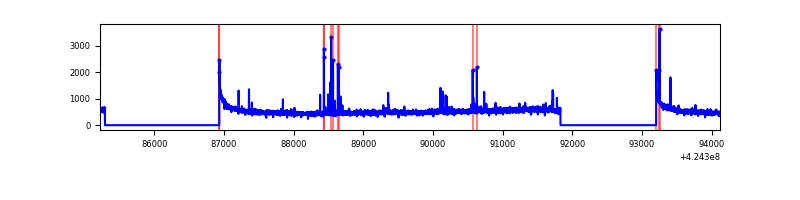 |
| B | 8900 | 5886 | 10 | 10 | 0.11% | 0.17% | 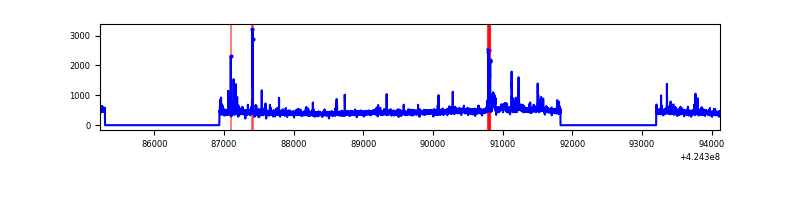 |
| C | 8899 | 5885 | 90 | 90 | 1.01% | 1.53% | 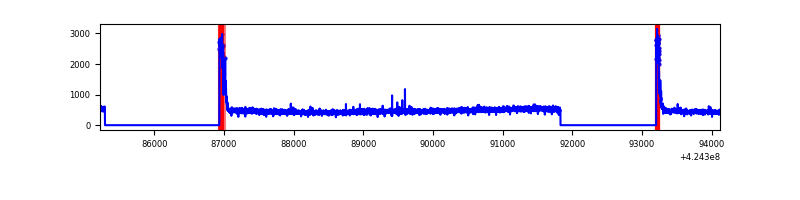 |
| D | 8899 | 5885 | 75 | 75 | 0.84% | 1.27% | 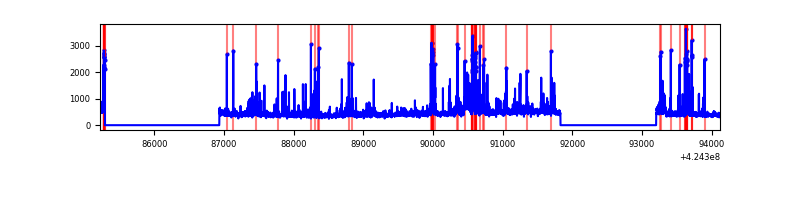 |
Top three noisy pixels from each quadrant. If the there are fewer than three noisy pixels in the level2.evt file, extra rows are filled as -1
| Pixel properties | Quadrant properties | ||||||
|---|---|---|---|---|---|---|---|
| Quadrant | DetID | PixID | Counts | Sigma | Mean | Median | Sigma |
| A | 10 | 83 | 549659 | 4120.86 | 642 | 628 | 133.2 |
| A | 13 | 248 | 65281 | 485.27 | 642 | 628 | 133.2 |
| A | 15 | 223 | 19901 | 144.66 | 642 | 628 | 133.2 |
| B | 4 | 141 | 93542 | 742.67 | 636 | 618 | 125.1 |
| B | 5 | 255 | 58410 | 461.89 | 636 | 618 | 125.1 |
| B | 0 | 245 | 34567 | 271.33 | 636 | 618 | 125.1 |
| C | 0 | 10 | 282396 | 1920.05 | 624 | 628 | 146.8 |
| C | 15 | 214 | 240000 | 1631.15 | 624 | 628 | 146.8 |
| C | 13 | 61 | 4138 | 23.92 | 624 | 628 | 146.8 |
| D | 13 | 249 | 332776 | 2149.78 | 624 | 605 | 154.5 |
| D | 2 | 249 | 157999 | 1018.64 | 624 | 605 | 154.5 |
| D | 2 | 120 | 47556 | 303.86 | 624 | 605 | 154.5 |
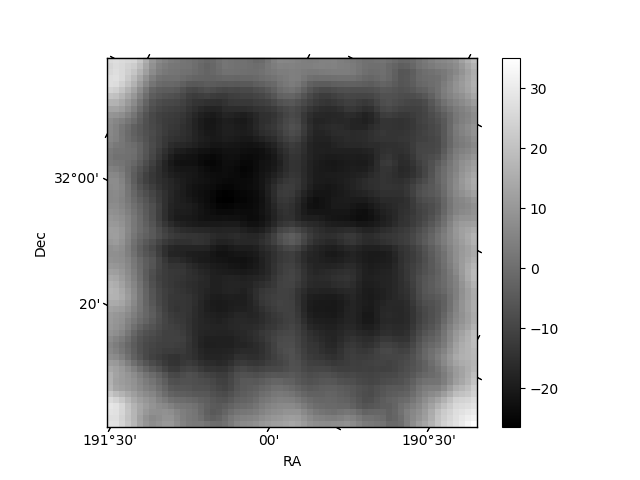
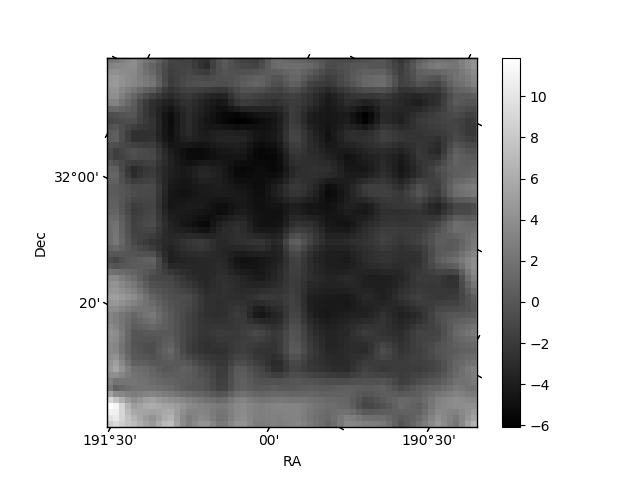
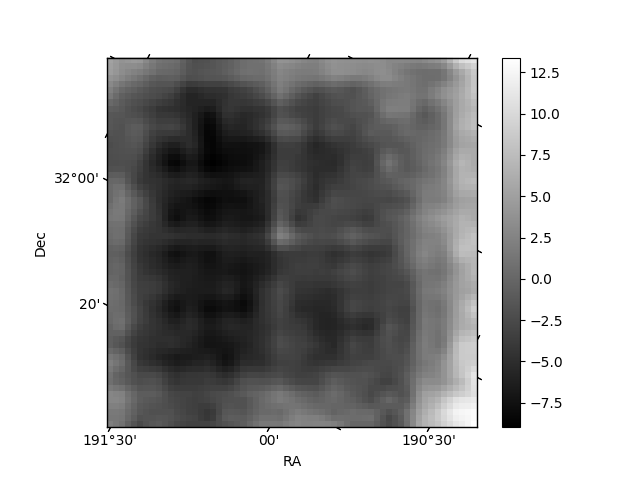
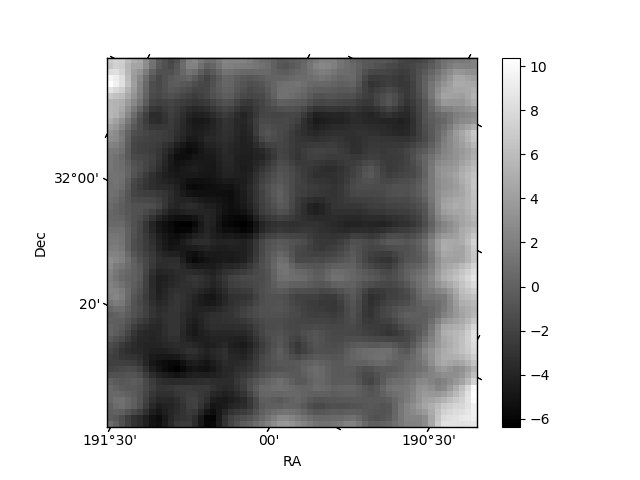
Histogram calculated using DETX and DETY for each event in the final _common_clean file
| Quadrant A | 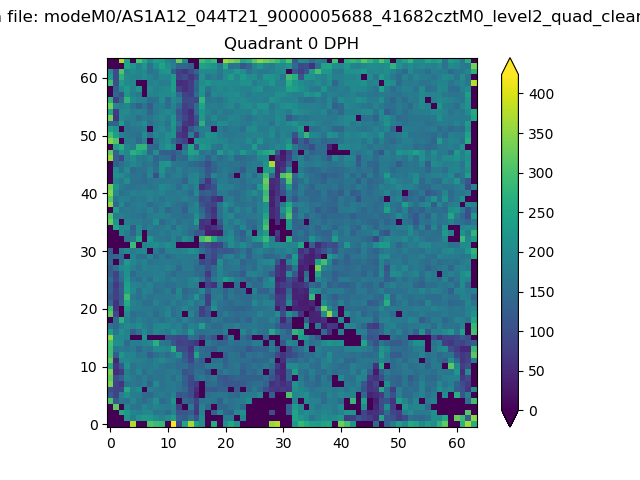 |
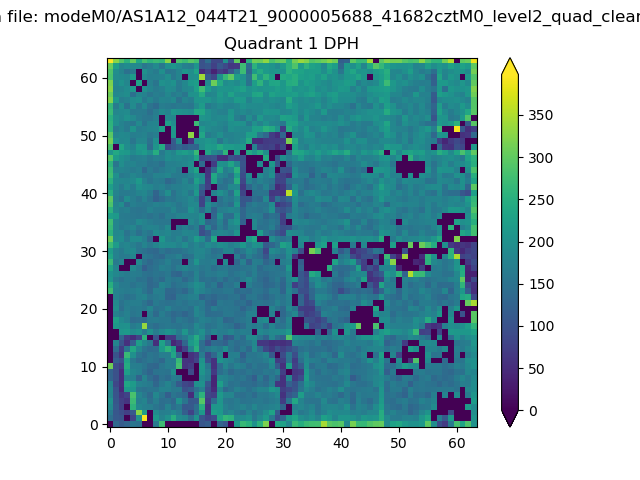 |
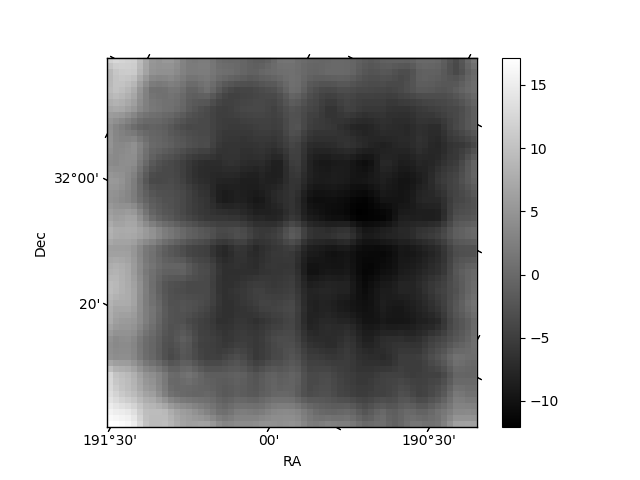
Quadrant B |
|---|---|---|---|
| Quadrant D | 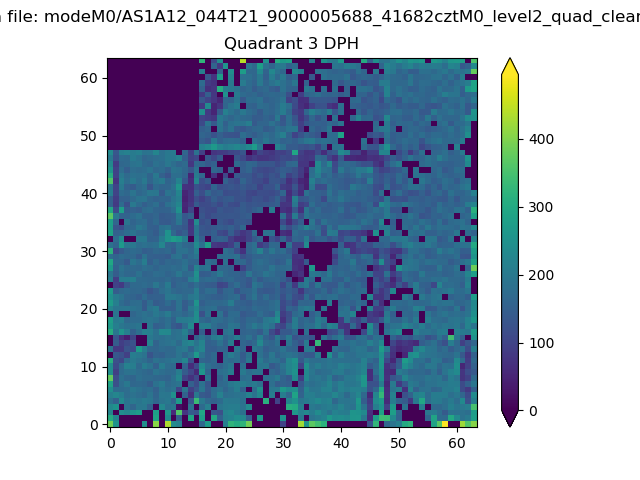 |
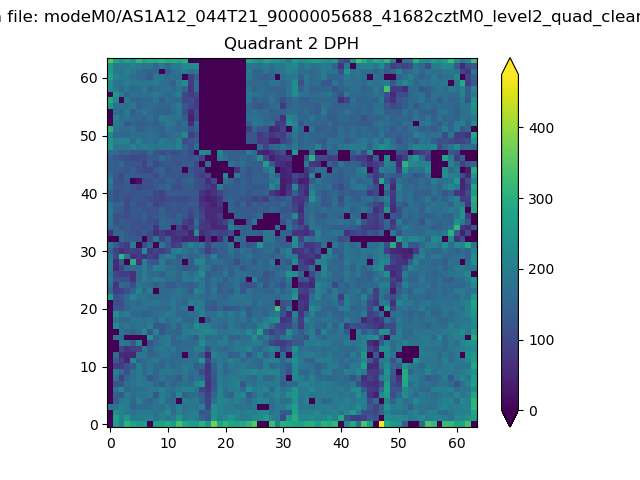 |
Quadrant C |
| Plot type | Count rate plots | Images |
|---|---|---|
| Comparison with Poisson distribution Blue bars denote a histogram of data divided into 1 sec bins. Red curve is a Poisson curve with rate = median count rate of data. |
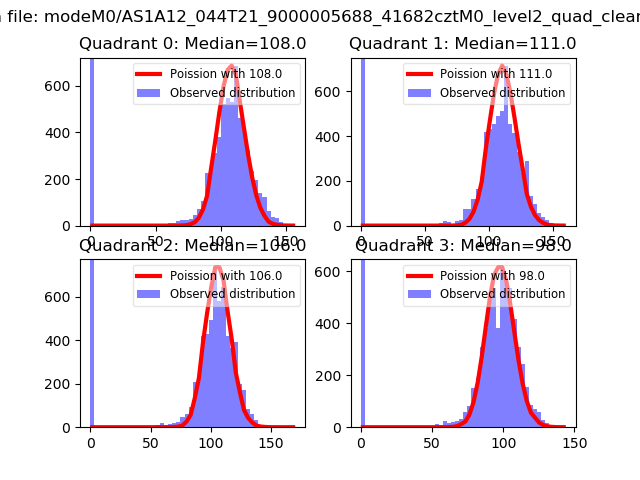 |
 |
| Quadrant-wise count rates Data is divided into 100 sec bins |
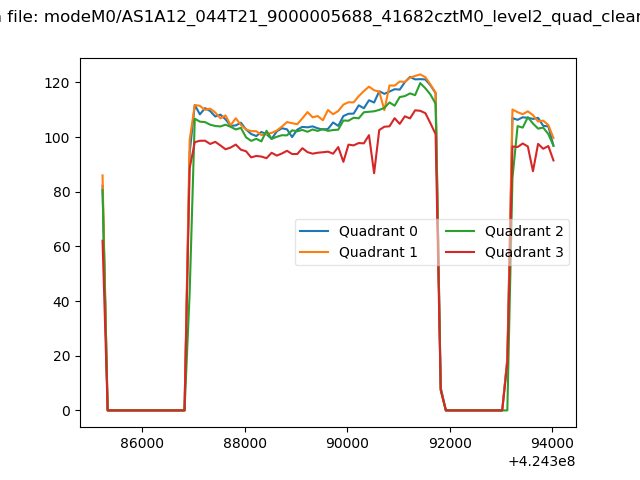 |
|
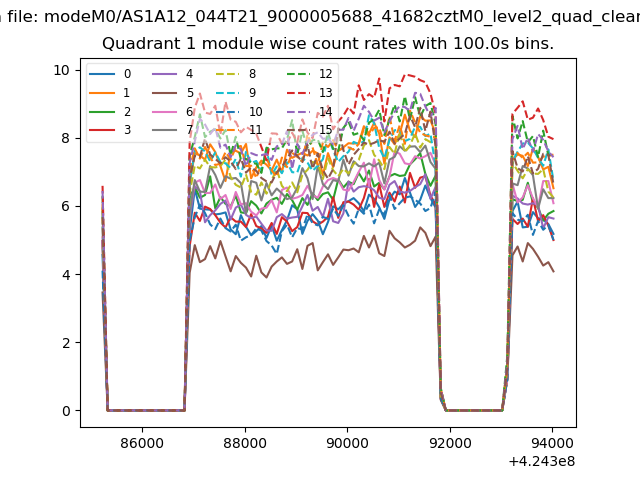
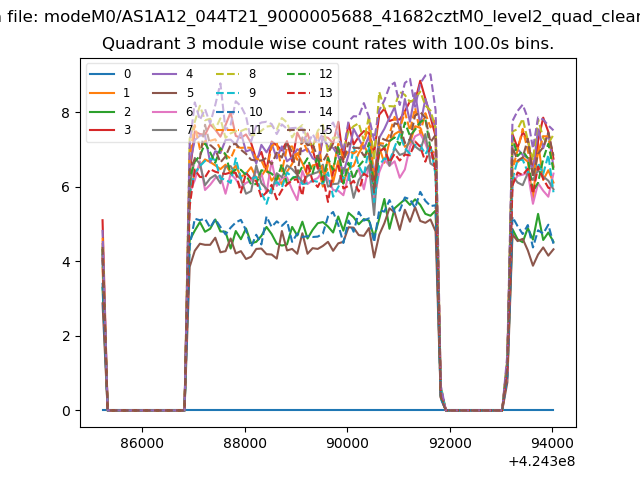
| Module-wise count rates for Quadrant A Data is divided into 100 sec bins |
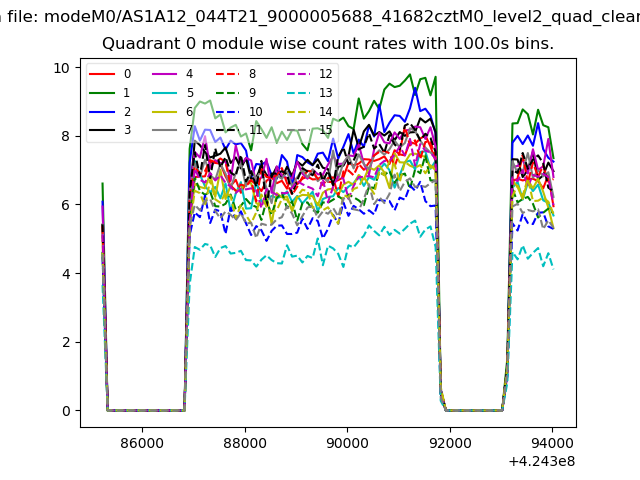 |
 |
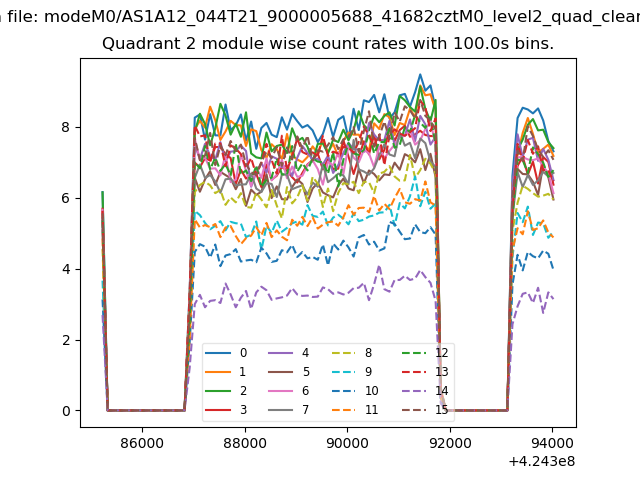
| Module-wise count rates for Quadrant B Data is divided into 100 sec bins |
 |
 |
| Module-wise count rates for Quadrant C Data is divided into 100 sec bins |
 |
 |
| Module-wise count rates for Quadrant D Data is divided into 100 sec bins |
 |
 |
| Parameter | Plot |
|---|---|
| CZT HV Monitor | 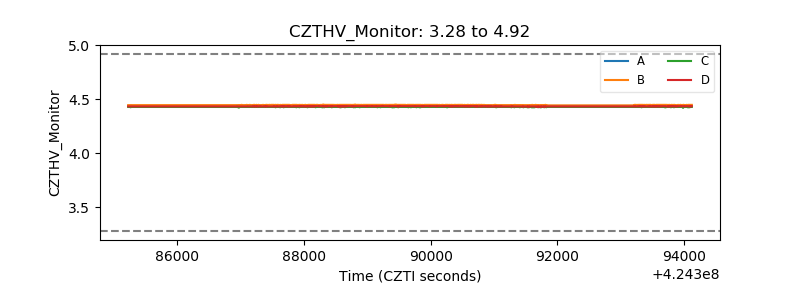 |
| D_VDD | 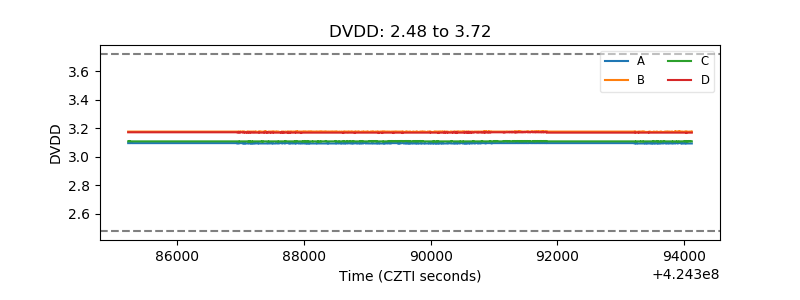 |
| Temperature 1 | 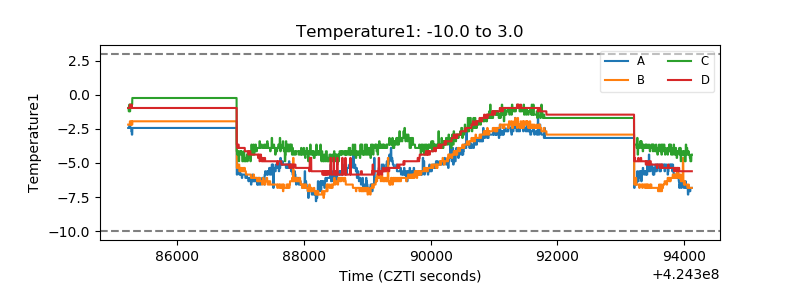 |
| Veto HV Monitor | 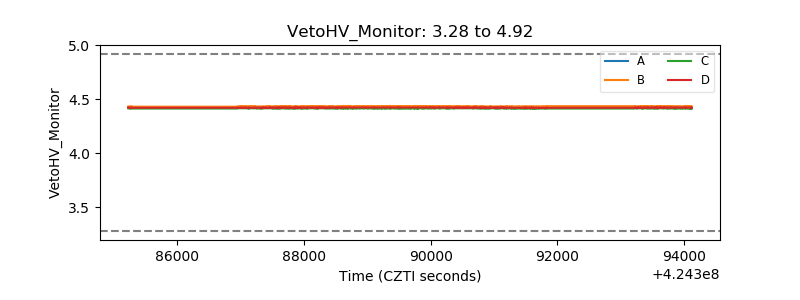 |
| Veto LLD | 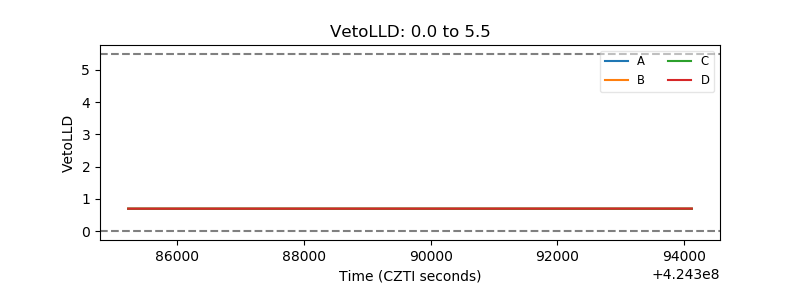 |
| Alpha Counter | 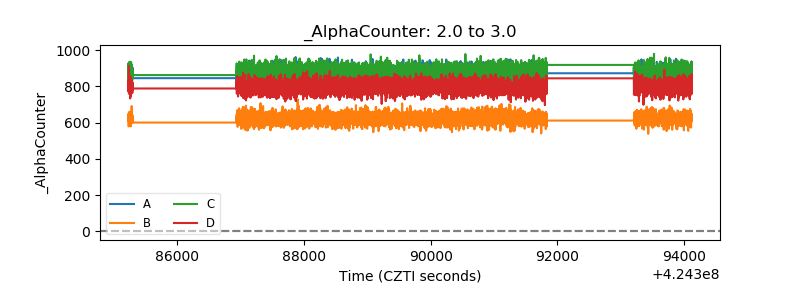 |
| _CPM_Rate | 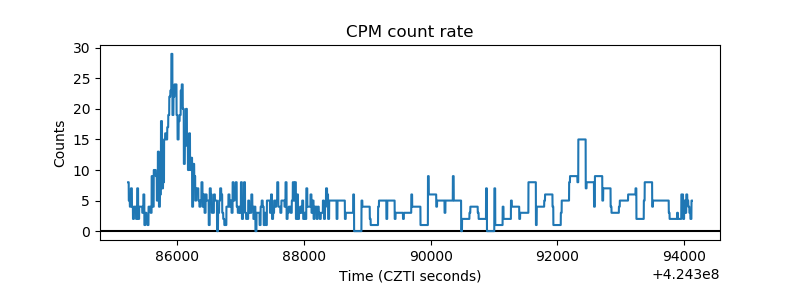 |
| CZT Counter | 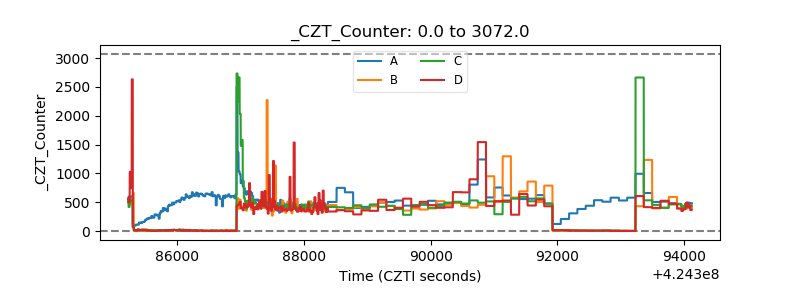 |
| +2.5 Volts monitor | 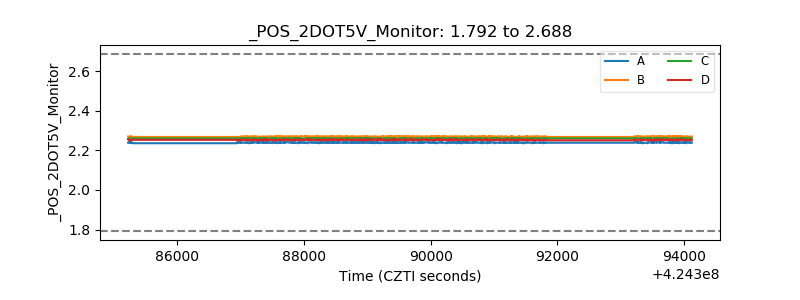 |
| +5 Volts monitor | 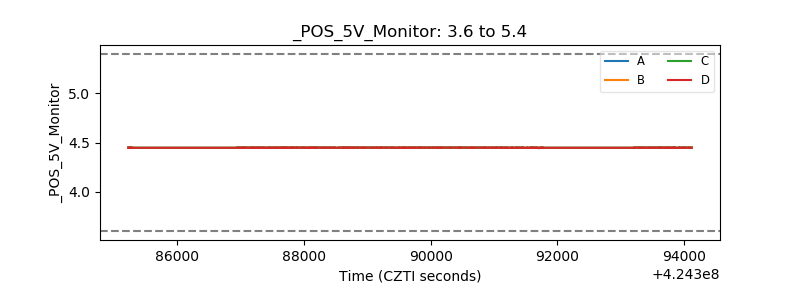 |
| _ROLL_ROT | 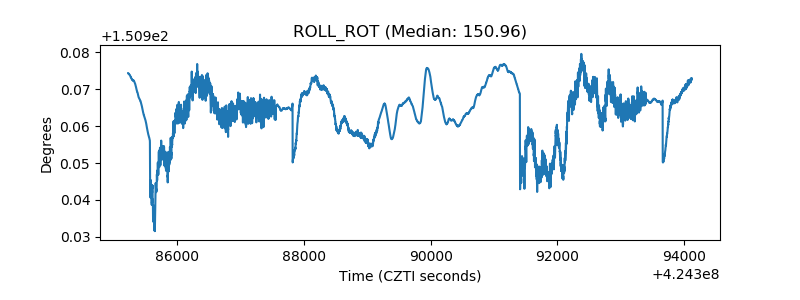 |
| _Roll_DEC | 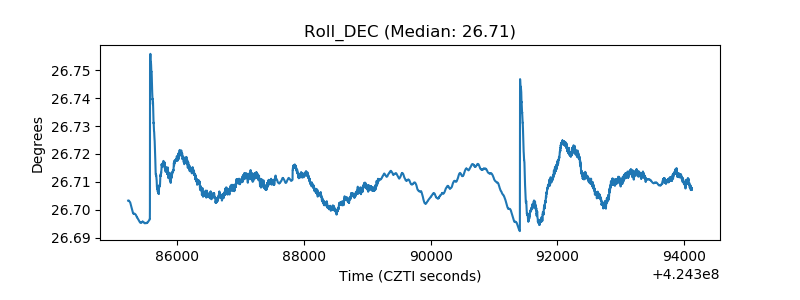 |
| _Roll_RA | 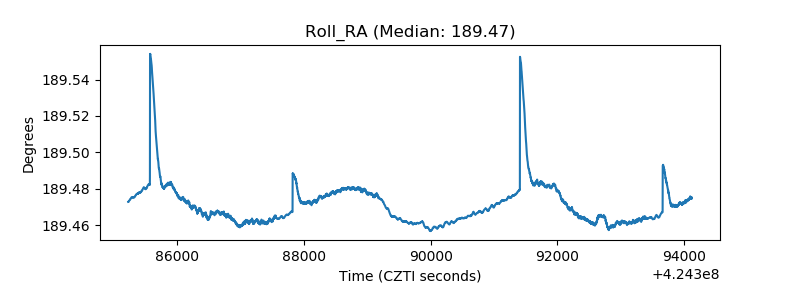 |
| Veto Counter | 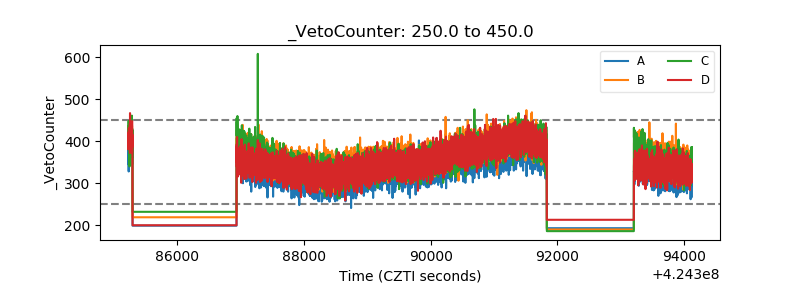 |