| Param | Original file | Final file |
|---|---|---|
| Filename | modeM0/AS1A12_044T21_9000005688_41683cztM0_level2.fits | modeM0/AS1A12_044T21_9000005688_41683cztM0_level2_quad_clean.evt |
| Size (bytes) | 352,949,760 | 99,950,400 |
| Size | 336.6 MB | 95.3 MB |
| Events in quadrant A | 3,292,691 | 666,874 |
| Events in quadrant B | 2,787,287 | 682,651 |
| Events in quadrant C | 3,036,279 | 647,995 |
| Events in quadrant D | 3,465,434 | 595,197 |
| Mode SS | |||
|---|---|---|---|
| Quadrant | BADHDUFLAG | Total packets | Discarded packets |
| A | 0 | 130 | 0 |
| B | 0 | 130 | 0 |
| C | 0 | 130 | 0 |
| D | 0 | 130 | 0 |
| Mode M9 | |||
|---|---|---|---|
| Quadrant | BADHDUFLAG | Total packets | Discarded packets |
| A | 0 | 26 | 0 |
| B | 0 | 26 | 0 |
| C | 0 | 26 | 0 |
| D | 0 | 26 | 0 |
| Mode M0 | |||
|---|---|---|---|
| Quadrant | BADHDUFLAG | Total packets | Discarded packets |
| A | 0 | 13457 | 2 |
| B | 0 | 12640 | 2 |
| C | 0 | 13008 | 2 |
| D | 0 | 14764 | 2 |
| Quadrant | Total seconds | Saturated seconds | Saturation percentage |
|---|---|---|---|
| A | 6206 | 13 | 0.209475% |
| B | 6206 | 8 | 0.128908% |
| C | 6206 | 64 | 1.031260% |
| D | 6206 | 133 | 2.143087% |
Noise dominated data is calculated using 1-second bins in cleaned event files. If a bin has >2000 counts, and if more than 50% of those come from <1% of pixels, then it is considered to be noise-dominated and hence unusable.
| Quadrant | # 1 sec bins | Bins with >0 counts | Bins with >2000 counts | High rate bins dominated by noise | Noise dominated (total time) | Noise dominated (detector-on time) | Marked lightcurve |
|---|---|---|---|---|---|---|---|
| A | 8863 | 6208 | 7 | 7 | 0.08% | 0.11% | 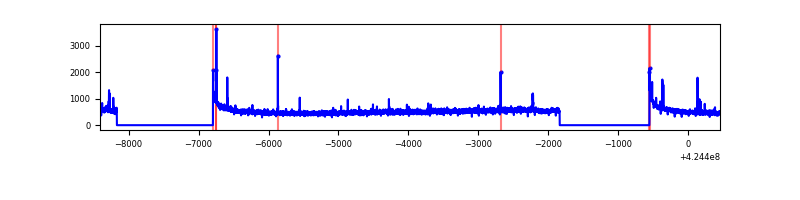 |
| B | 8863 | 6208 | 1 | 1 | 0.01% | 0.02% | 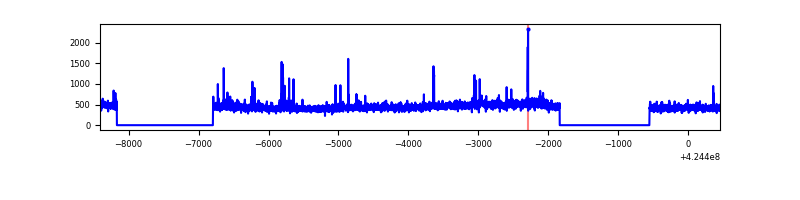 |
| C | 8863 | 6208 | 62 | 62 | 0.70% | 1.00% | 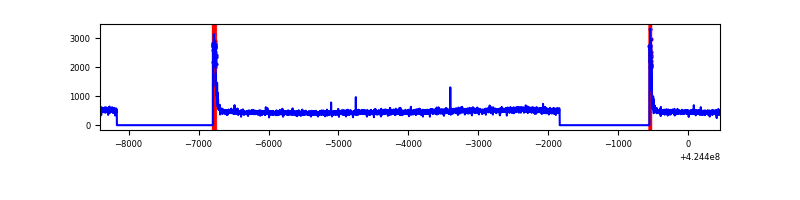 |
| D | 8863 | 6208 | 118 | 118 | 1.33% | 1.90% | 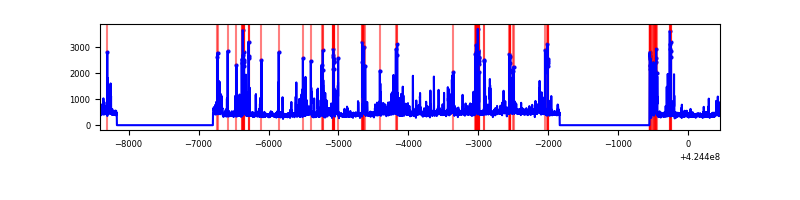 |
Top three noisy pixels from each quadrant. If the there are fewer than three noisy pixels in the level2.evt file, extra rows are filled as -1
| Pixel properties | Quadrant properties | ||||||
|---|---|---|---|---|---|---|---|
| Quadrant | DetID | PixID | Counts | Sigma | Mean | Median | Sigma |
| A | 10 | 83 | 585345 | 4126.33 | 682 | 668 | 141.7 |
| A | 15 | 223 | 32561 | 225.08 | 682 | 668 | 141.7 |
| A | 13 | 248 | 22437 | 153.63 | 682 | 668 | 141.7 |
| B | 5 | 255 | 42334 | 312.0 | 678 | 659 | 133.6 |
| B | 0 | 190 | 37381 | 274.92 | 678 | 659 | 133.6 |
| B | 0 | 245 | 18476 | 133.39 | 678 | 659 | 133.6 |
| C | 15 | 214 | 254335 | 1624.77 | 665 | 666 | 156.1 |
| C | 0 | 10 | 188195 | 1201.14 | 665 | 666 | 156.1 |
| C | 13 | 61 | 4464 | 24.33 | 665 | 666 | 156.1 |
| D | 13 | 249 | 593457 | 3646.58 | 658 | 638 | 162.6 |
| D | 2 | 249 | 131254 | 803.45 | 658 | 638 | 162.6 |
| D | 2 | 120 | 65376 | 398.22 | 658 | 638 | 162.6 |
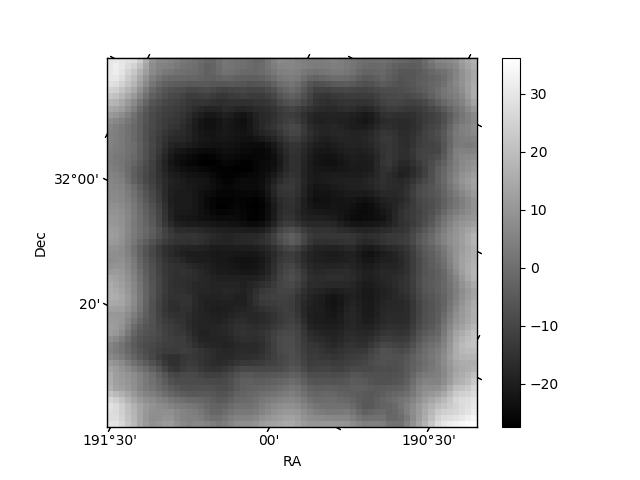
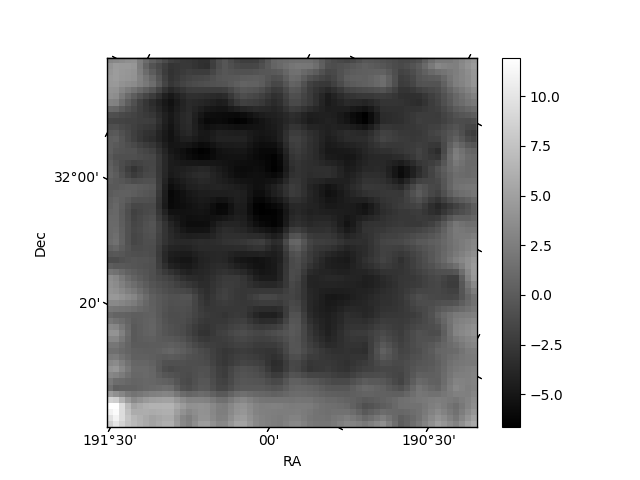
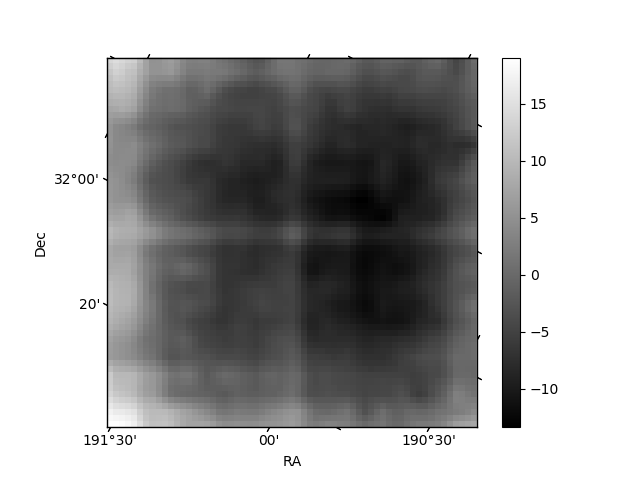
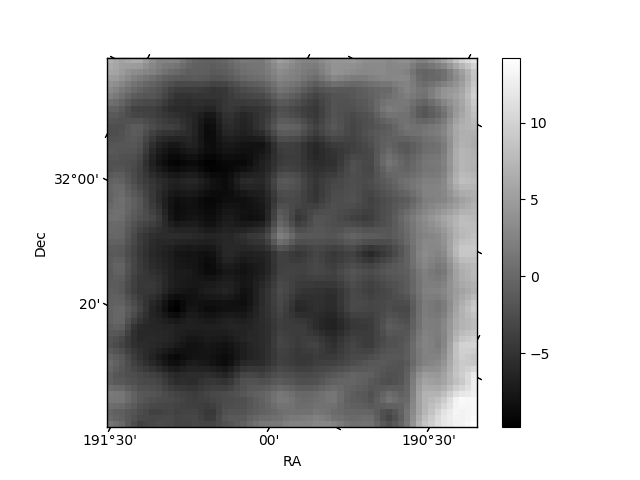
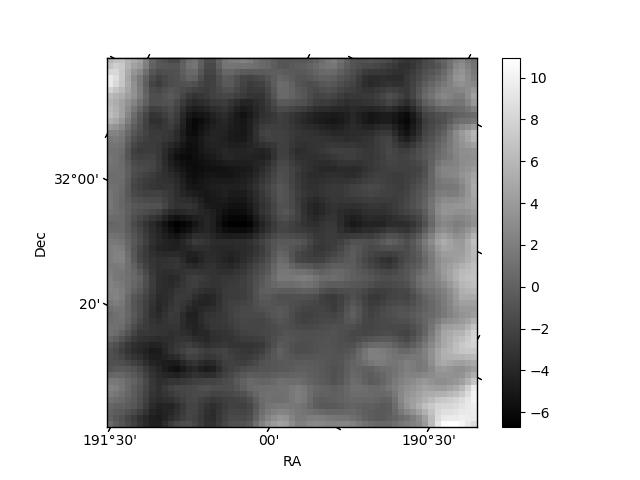
Histogram calculated using DETX and DETY for each event in the final _common_clean file
| Quadrant A | 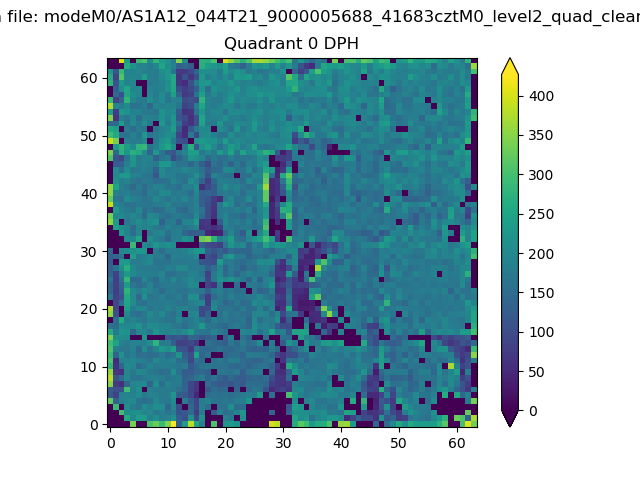 |
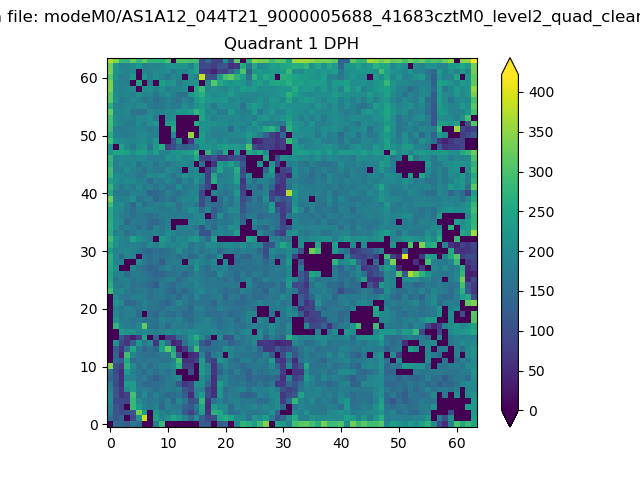 |
Quadrant B |
|---|---|---|---|
| Quadrant D | 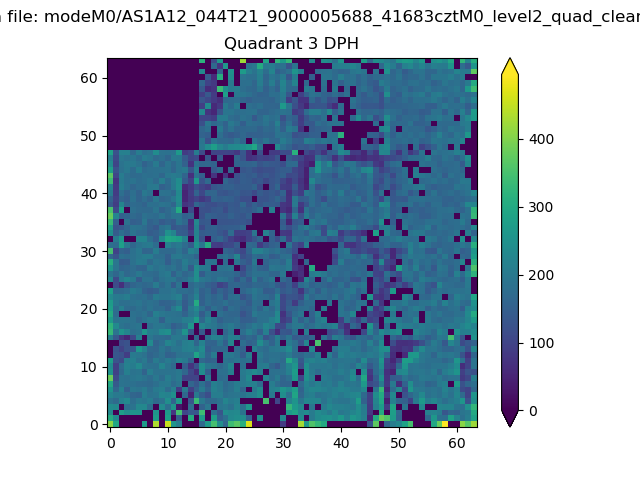 |
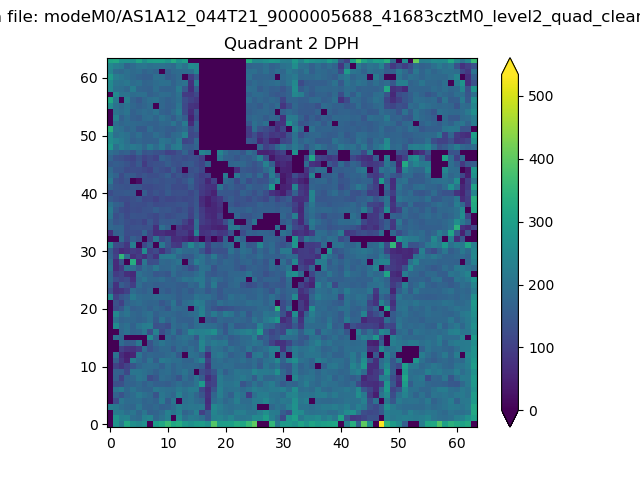 |
Quadrant C |
| Plot type | Count rate plots | Images |
|---|---|---|
| Comparison with Poisson distribution Blue bars denote a histogram of data divided into 1 sec bins. Red curve is a Poisson curve with rate = median count rate of data. |
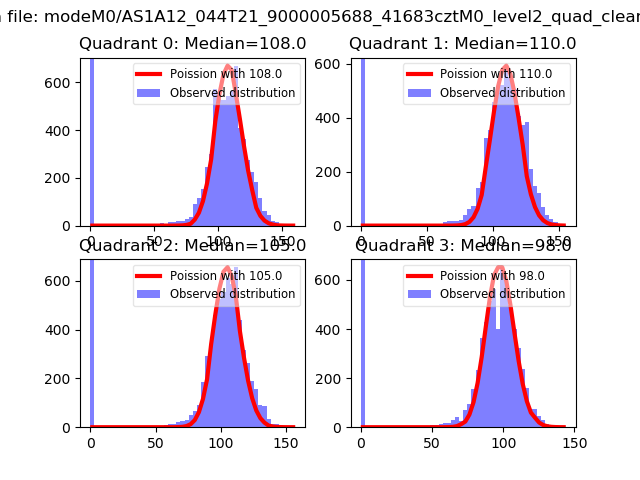 |
 |
| Quadrant-wise count rates Data is divided into 100 sec bins |
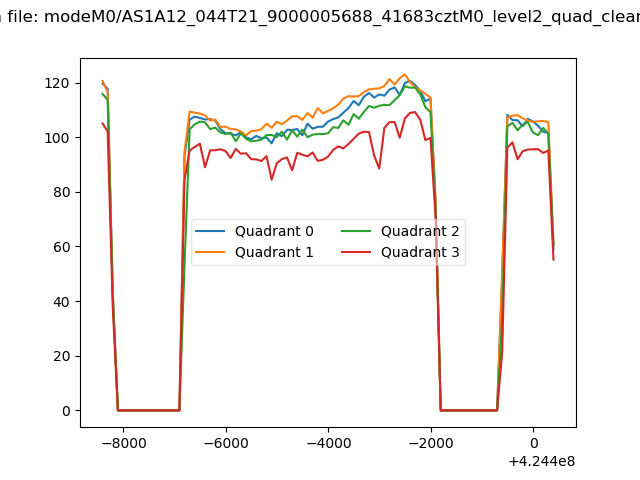 |
|
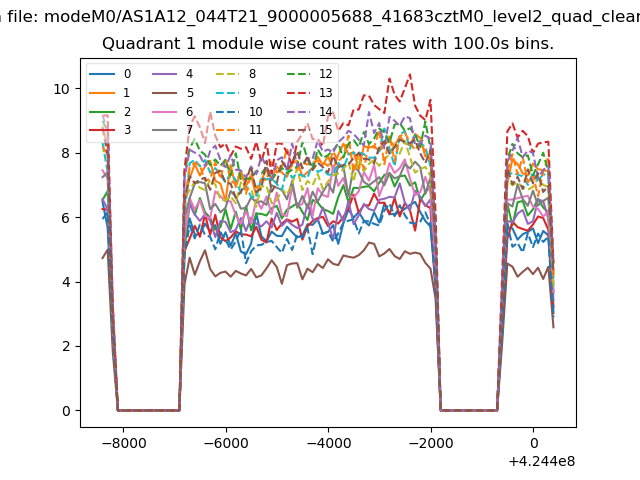
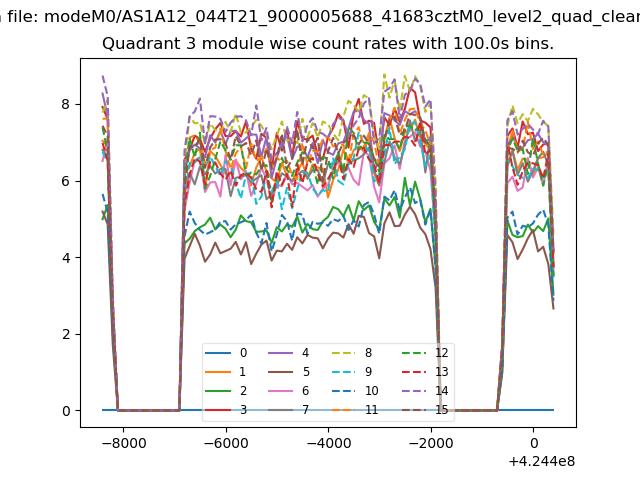
| Module-wise count rates for Quadrant A Data is divided into 100 sec bins |
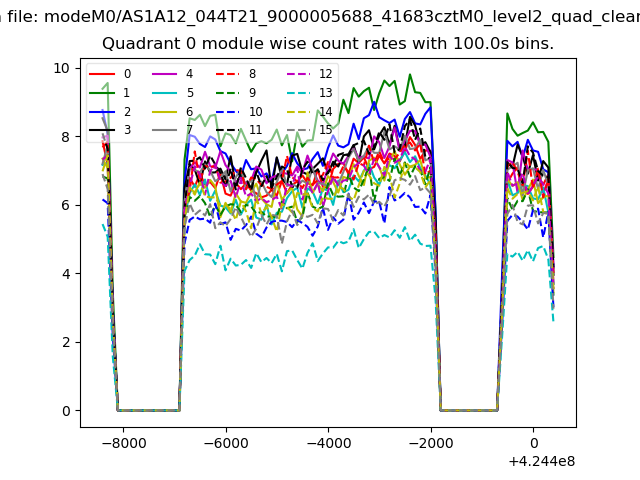 |
 |
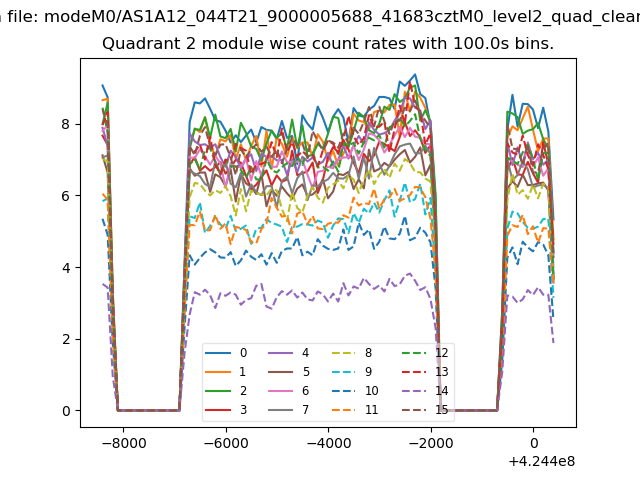
| Module-wise count rates for Quadrant B Data is divided into 100 sec bins |
 |
 |
| Module-wise count rates for Quadrant C Data is divided into 100 sec bins |
 |
 |
| Module-wise count rates for Quadrant D Data is divided into 100 sec bins |
 |
 |
| Parameter | Plot |
|---|---|
| CZT HV Monitor | 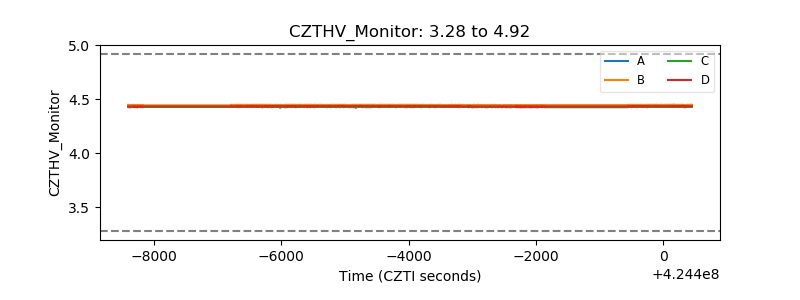 |
| D_VDD | 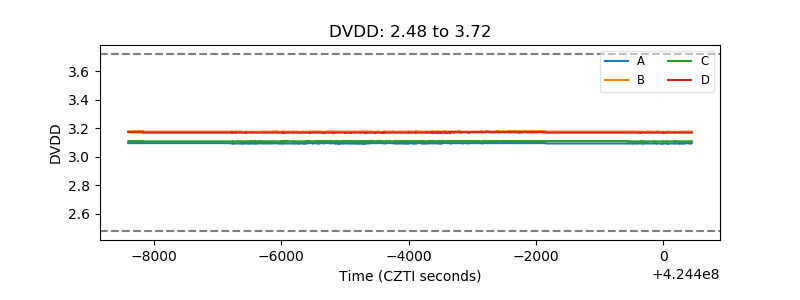 |
| Temperature 1 | 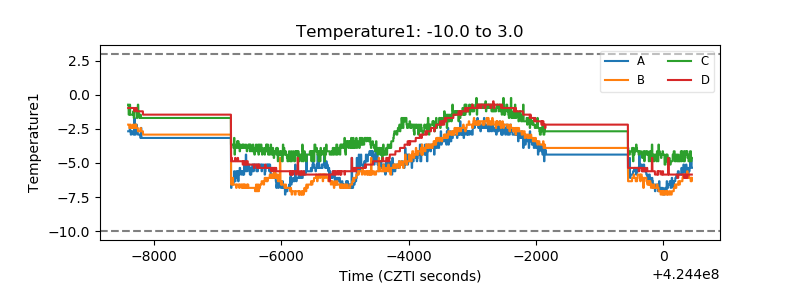 |
| Veto HV Monitor | 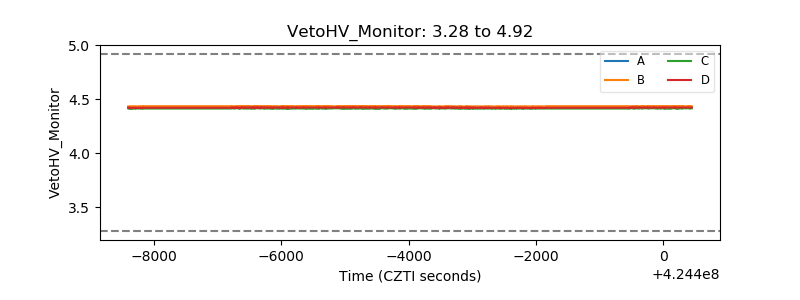 |
| Veto LLD | 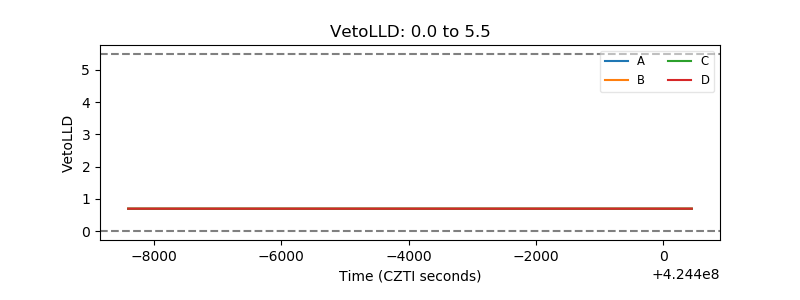 |
| Alpha Counter | 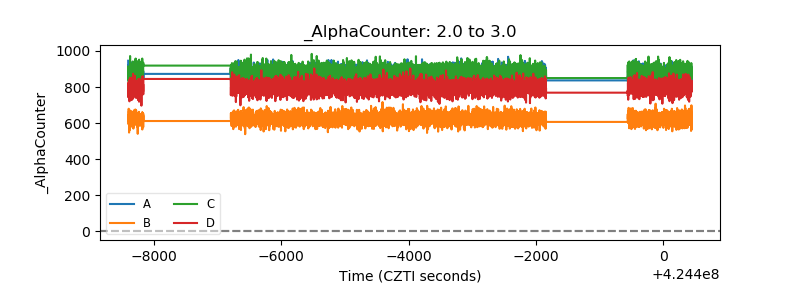 |
| _CPM_Rate | 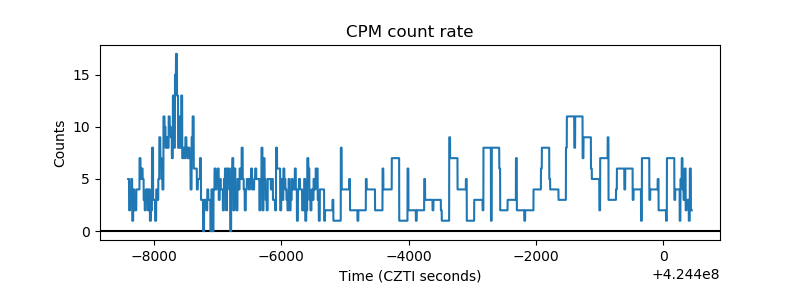 |
| CZT Counter | 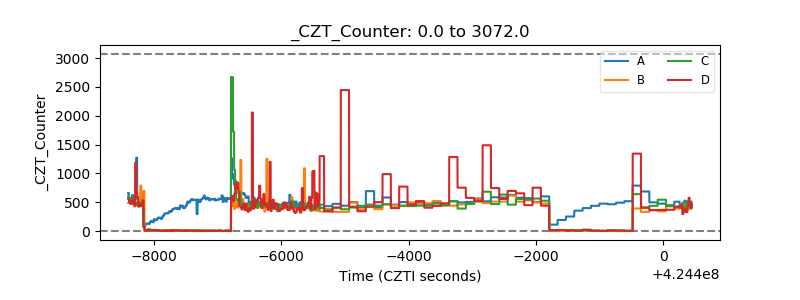 |
| +2.5 Volts monitor | 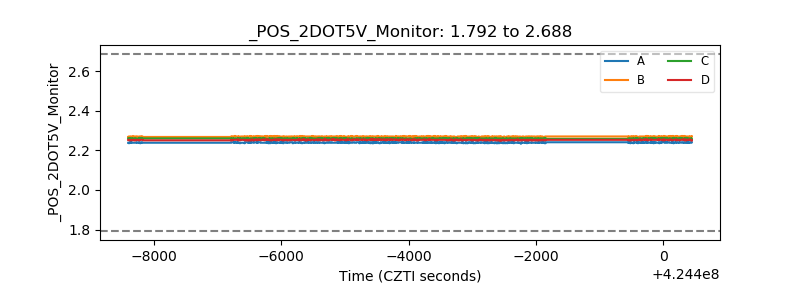 |
| +5 Volts monitor | 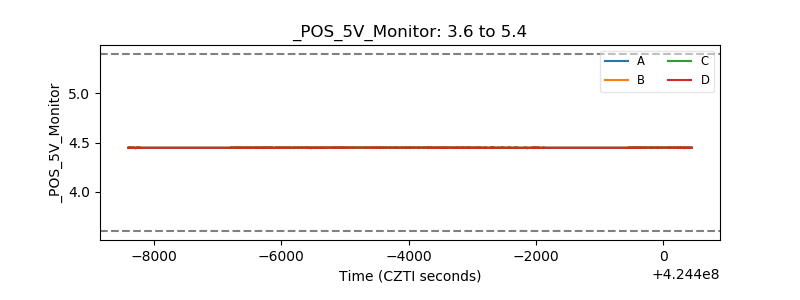 |
| _ROLL_ROT |  |
| _Roll_DEC | 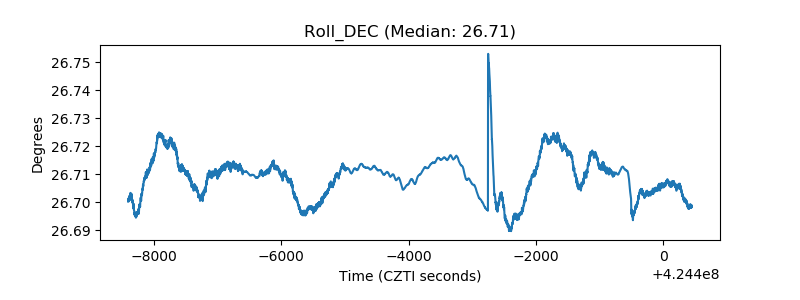 |
| _Roll_RA | 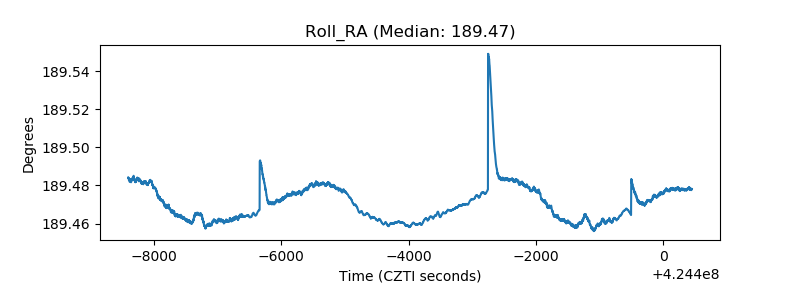 |
| Veto Counter | 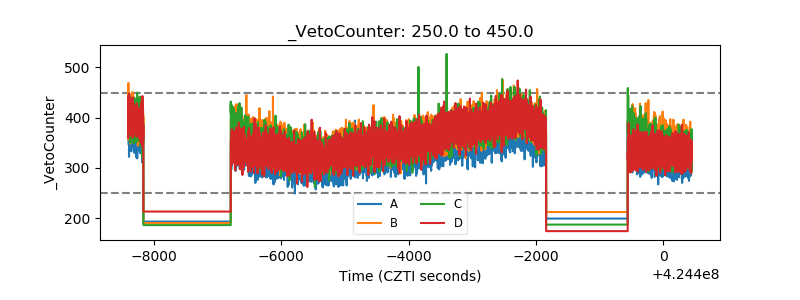 |