| Param | Original file | Final file |
|---|---|---|
| Filename | modeM0/AS1A12_044T21_9000005688_41686cztM0_level2.fits | modeM0/AS1A12_044T21_9000005688_41686cztM0_level2_quad_clean.evt |
| Size (bytes) | 892,615,680 | 246,896,640 |
| Size | 851.3 MB | 235.5 MB |
| Events in quadrant A | 8,157,896 | 1,649,998 |
| Events in quadrant B | 6,905,437 | 1,699,176 |
| Events in quadrant C | 7,587,406 | 1,595,225 |
| Events in quadrant D | 9,187,877 | 1,460,605 |
| Mode SS | |||
|---|---|---|---|
| Quadrant | BADHDUFLAG | Total packets | Discarded packets |
| A | 0 | 314 | 0 |
| B | 0 | 314 | 0 |
| C | 0 | 314 | 0 |
| D | 0 | 314 | 0 |
| Mode M9 | |||
|---|---|---|---|
| Quadrant | BADHDUFLAG | Total packets | Discarded packets |
| A | 0 | 52 | 0 |
| B | 0 | 53 | 0 |
| C | 0 | 53 | 0 |
| D | 0 | 53 | 0 |
| Mode M0 | |||
|---|---|---|---|
| Quadrant | BADHDUFLAG | Total packets | Discarded packets |
| A | 0 | 33051 | 4 |
| B | 0 | 31342 | 4 |
| C | 0 | 32353 | 4 |
| D | 0 | 38358 | 4 |
| Quadrant | Total seconds | Saturated seconds | Saturation percentage |
|---|---|---|---|
| A | 15518 | 24 | 0.154659% |
| B | 15518 | 23 | 0.148215% |
| C | 15517 | 116 | 0.747567% |
| D | 15517 | 507 | 3.267384% |
Noise dominated data is calculated using 1-second bins in cleaned event files. If a bin has >2000 counts, and if more than 50% of those come from <1% of pixels, then it is considered to be noise-dominated and hence unusable.
| Quadrant | # 1 sec bins | Bins with >0 counts | Bins with >2000 counts | High rate bins dominated by noise | Noise dominated (total time) | Noise dominated (detector-on time) | Marked lightcurve |
|---|---|---|---|---|---|---|---|
| A | 19757 | 15521 | 10 | 10 | 0.05% | 0.06% | 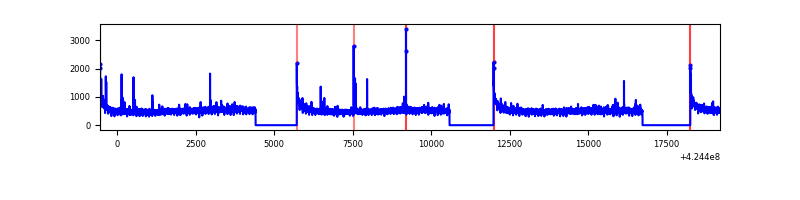 |
| B | 19757 | 15521 | 5 | 5 | 0.03% | 0.03% | 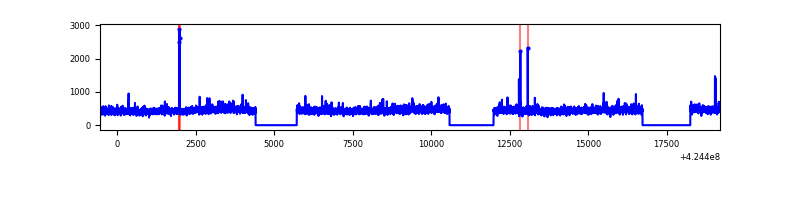 |
| C | 19756 | 15520 | 105 | 105 | 0.53% | 0.68% | 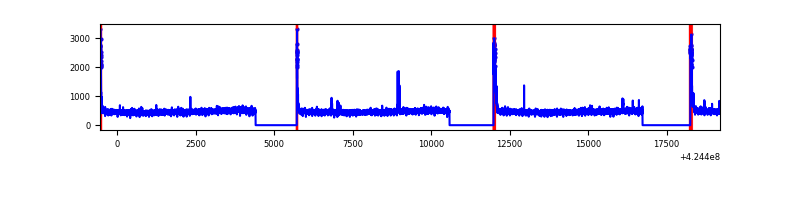 |
| D | 19756 | 15520 | 459 | 459 | 2.32% | 2.96% | 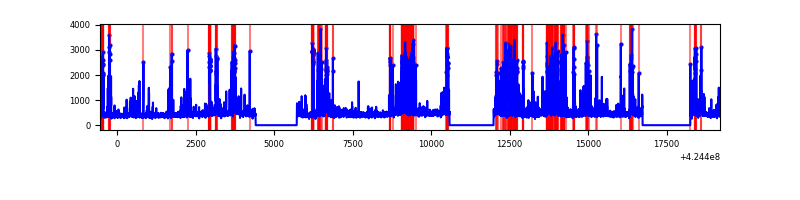 |
Top three noisy pixels from each quadrant. If the there are fewer than three noisy pixels in the level2.evt file, extra rows are filled as -1
| Pixel properties | Quadrant properties | ||||||
|---|---|---|---|---|---|---|---|
| Quadrant | DetID | PixID | Counts | Sigma | Mean | Median | Sigma |
| A | 10 | 83 | 1385476 | 3915.61 | 1725 | 1687 | 353.4 |
| A | 15 | 223 | 42497 | 115.48 | 1725 | 1687 | 353.4 |
| A | 13 | 248 | 32127 | 86.13 | 1725 | 1687 | 353.4 |
| B | 0 | 190 | 61277 | 180.49 | 1707 | 1656 | 330.3 |
| B | 5 | 255 | 53516 | 156.99 | 1707 | 1656 | 330.3 |
| B | 0 | 245 | 47730 | 139.48 | 1707 | 1656 | 330.3 |
| C | 15 | 214 | 630965 | 1608.81 | 1677 | 1685 | 391.1 |
| C | 0 | 10 | 389925 | 992.57 | 1677 | 1685 | 391.1 |
| C | 15 | 159 | 18768 | 43.67 | 1677 | 1685 | 391.1 |
| D | 13 | 249 | 1678695 | 4134.31 | 1657 | 1607 | 405.7 |
| D | 2 | 249 | 507940 | 1248.2 | 1657 | 1607 | 405.7 |
| D | 2 | 120 | 294610 | 722.3 | 1657 | 1607 | 405.7 |
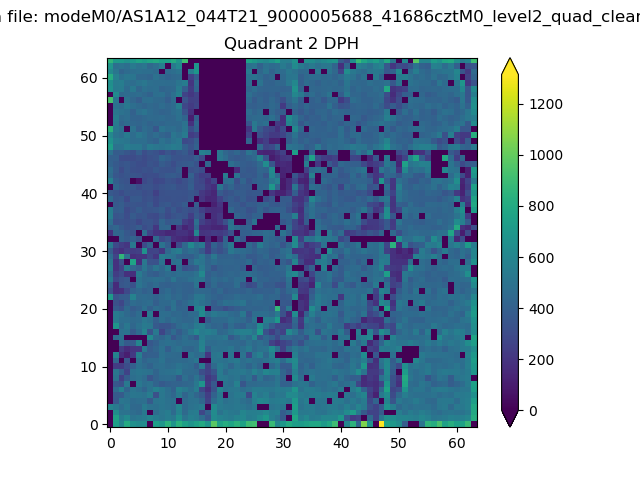
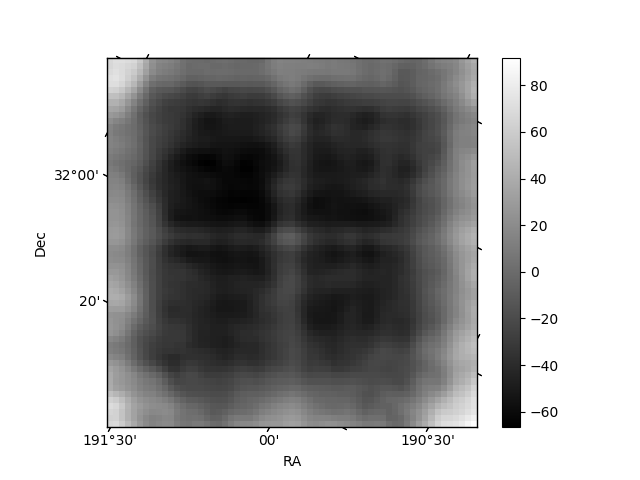
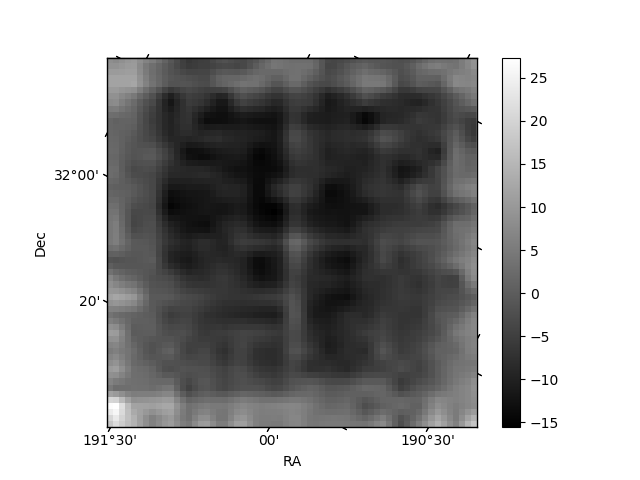
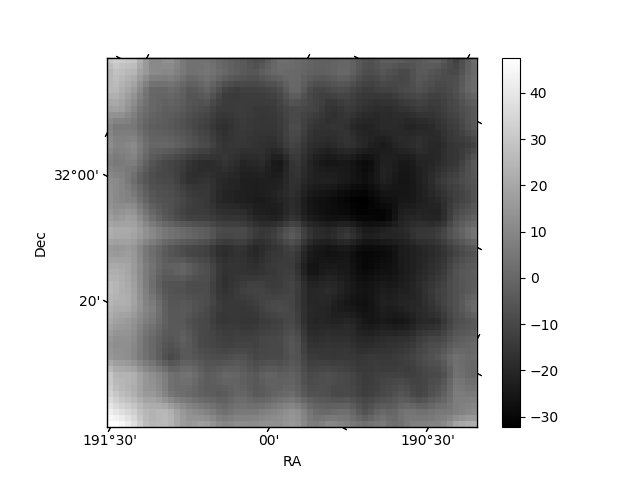
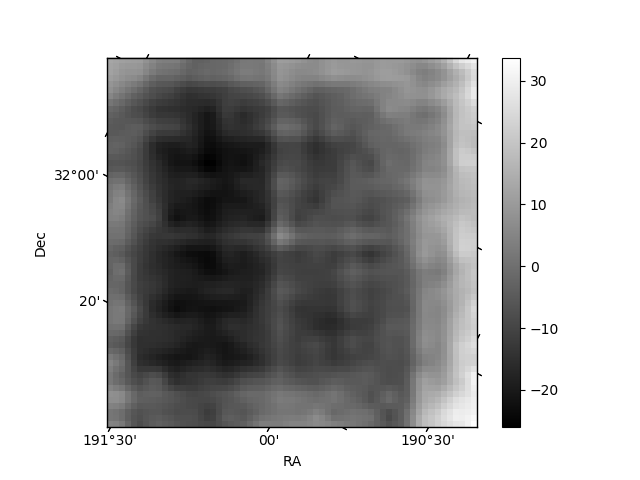
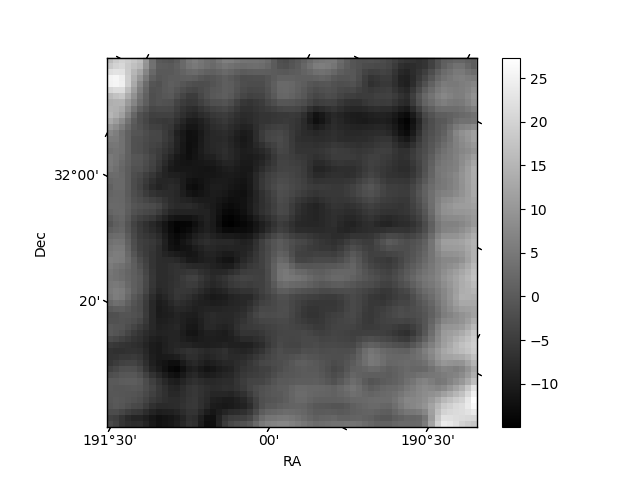
Histogram calculated using DETX and DETY for each event in the final _common_clean file
| Quadrant A | 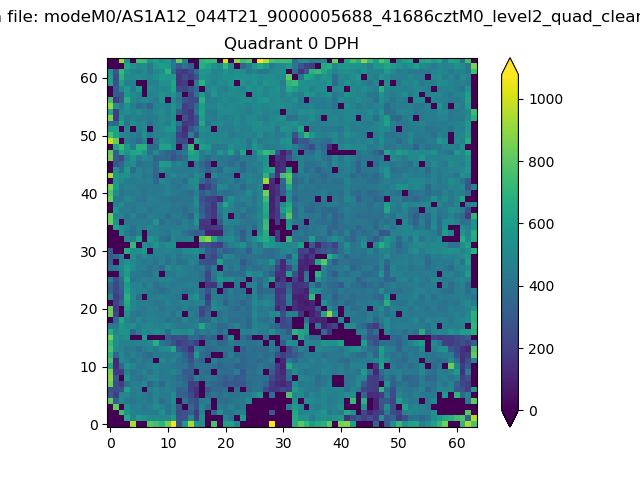 |
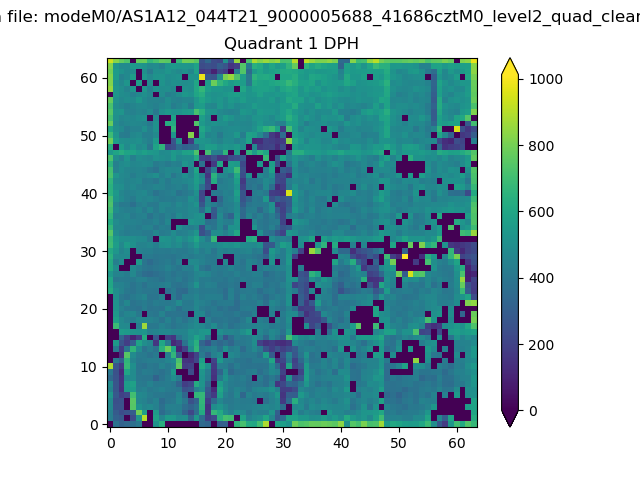 |
Quadrant B |
|---|---|---|---|
| Quadrant D | 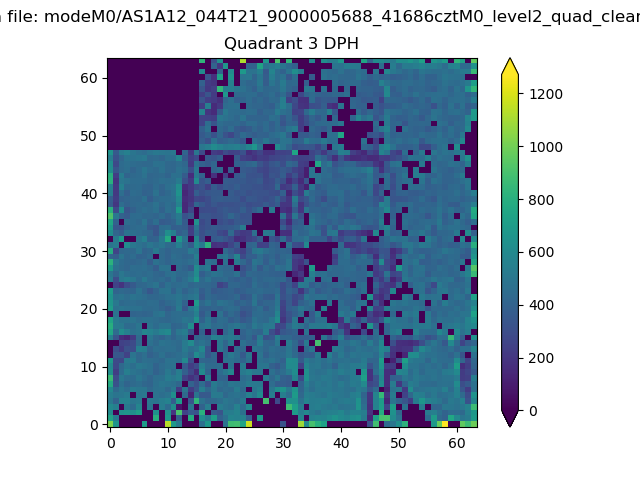 |
 |
Quadrant C |
| Plot type | Count rate plots | Images |
|---|---|---|
| Comparison with Poisson distribution Blue bars denote a histogram of data divided into 1 sec bins. Red curve is a Poisson curve with rate = median count rate of data. |
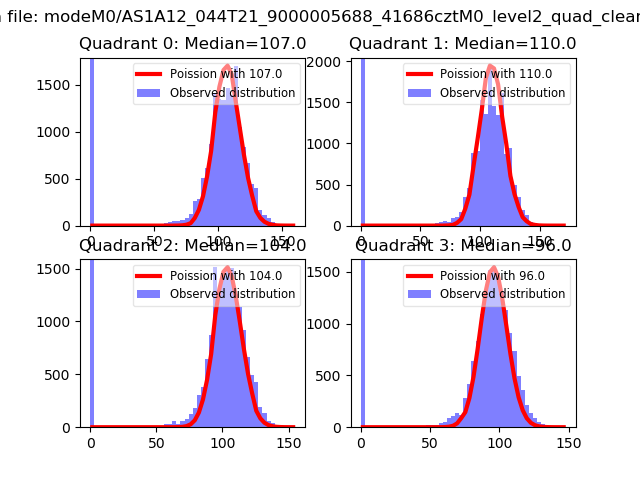 |
 |
| Quadrant-wise count rates Data is divided into 100 sec bins |
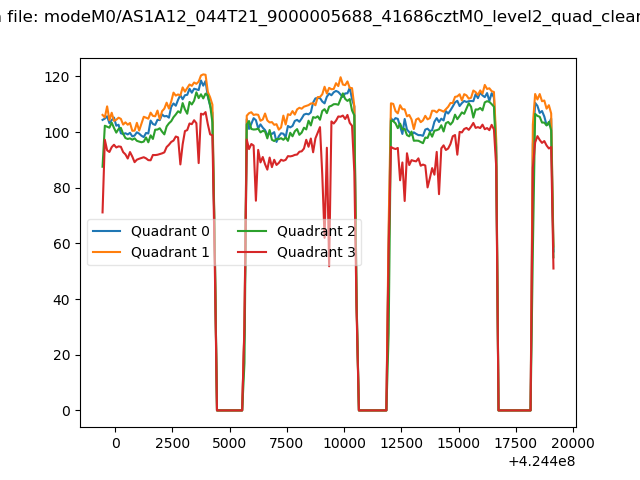 |
|
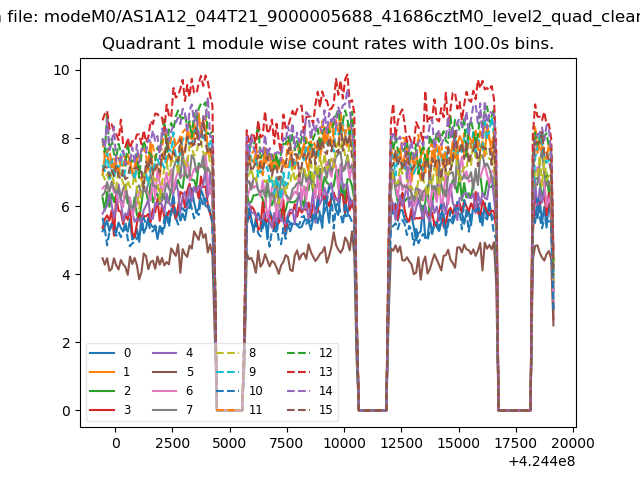
| Module-wise count rates for Quadrant A Data is divided into 100 sec bins |
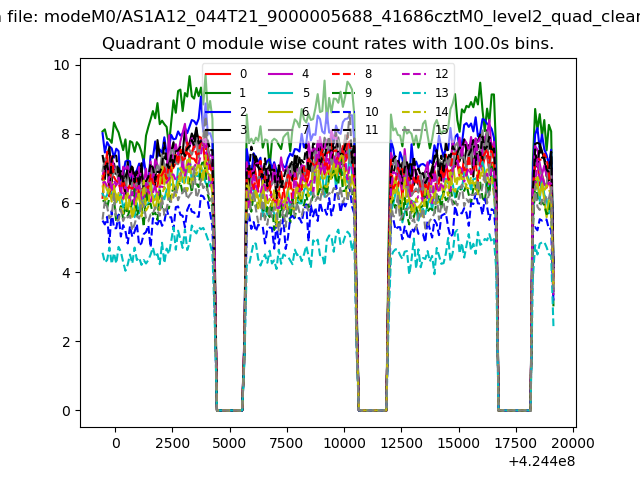 |
 |
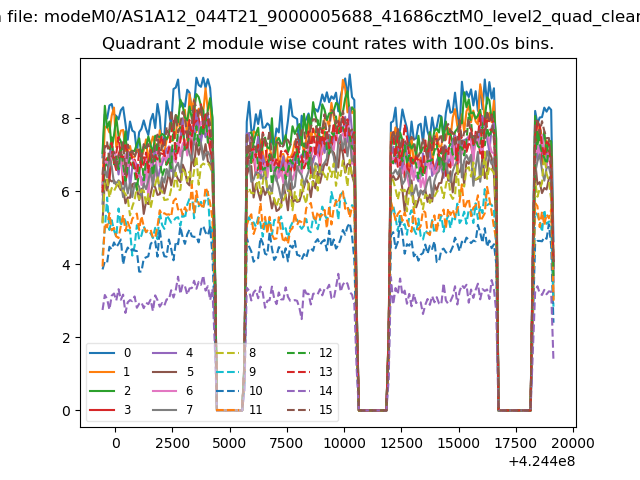
| Module-wise count rates for Quadrant B Data is divided into 100 sec bins |
 |
 |
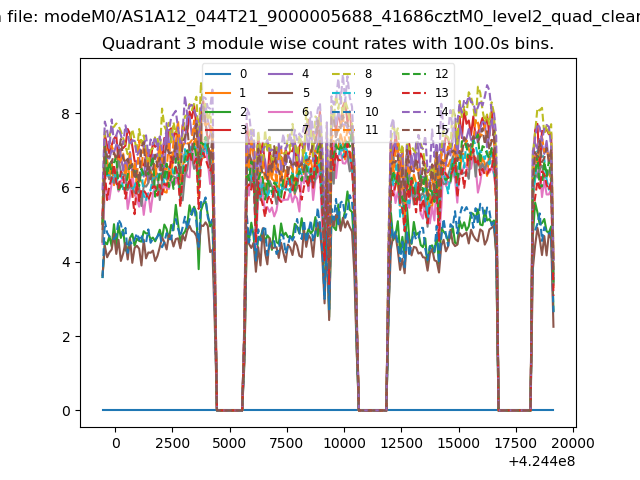
| Module-wise count rates for Quadrant C Data is divided into 100 sec bins |
 |
 |
| Module-wise count rates for Quadrant D Data is divided into 100 sec bins |
 |
 |
| Parameter | Plot |
|---|---|
| CZT HV Monitor | 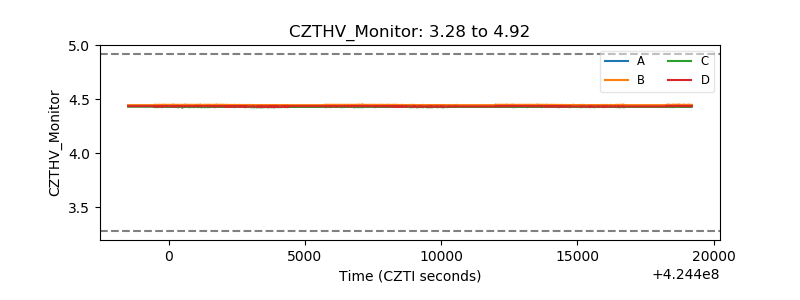 |
| D_VDD | 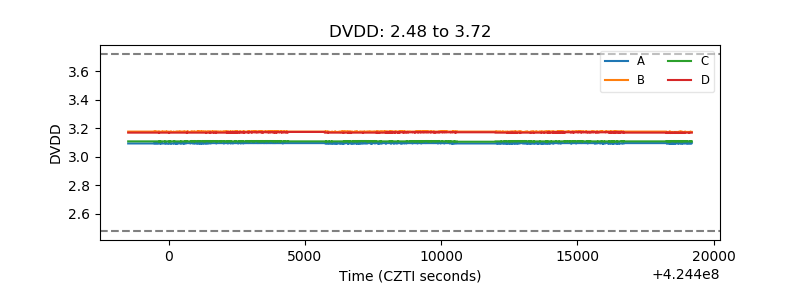 |
| Temperature 1 | 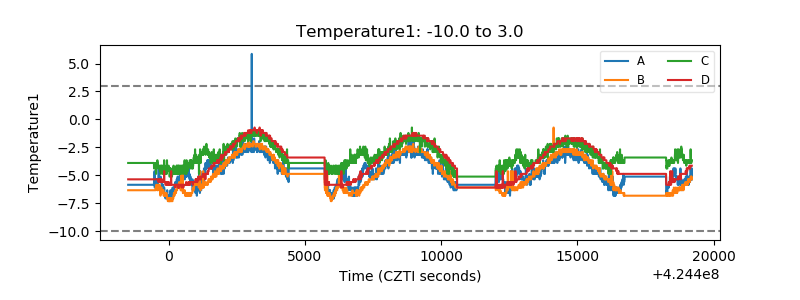 |
| Veto HV Monitor | 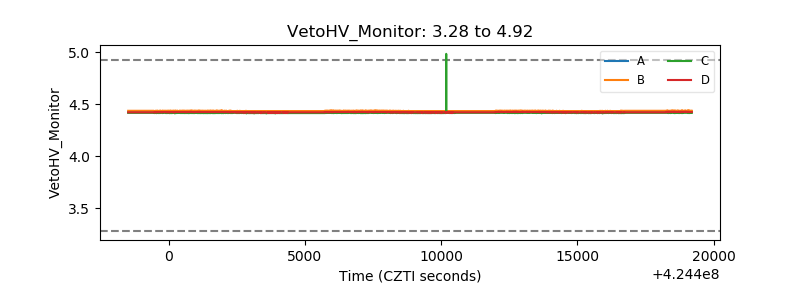 |
| Veto LLD | 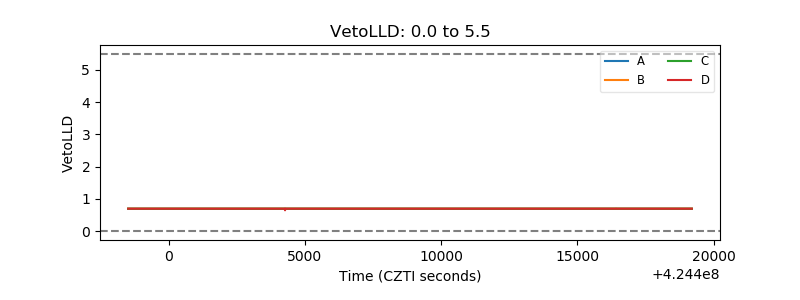 |
| Alpha Counter | 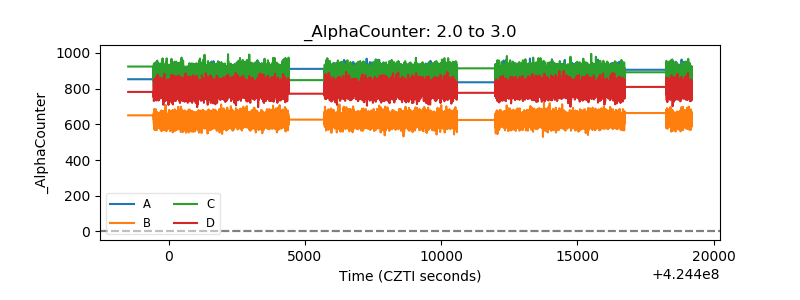 |
| _CPM_Rate | 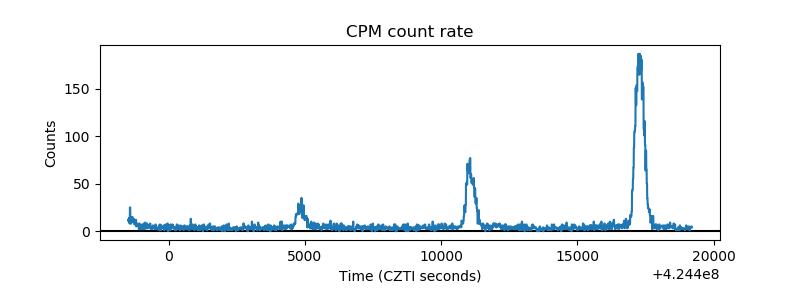 |
| CZT Counter | 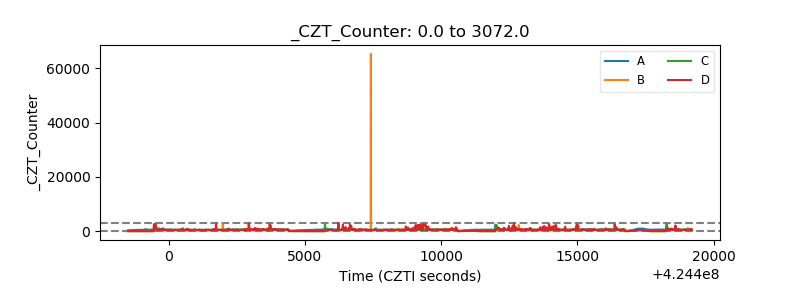 |
| +2.5 Volts monitor | 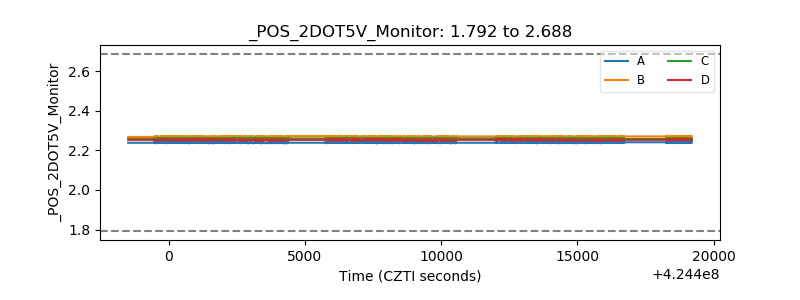 |
| +5 Volts monitor | 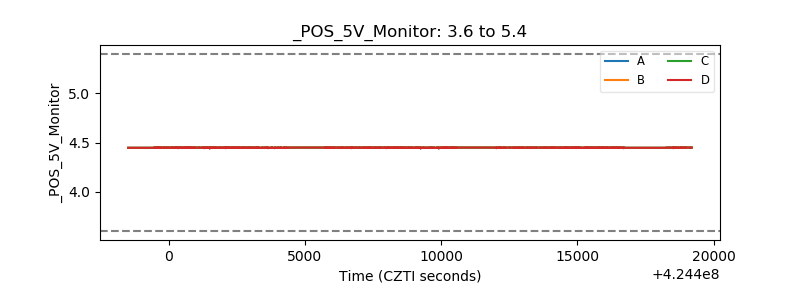 |
| _ROLL_ROT | 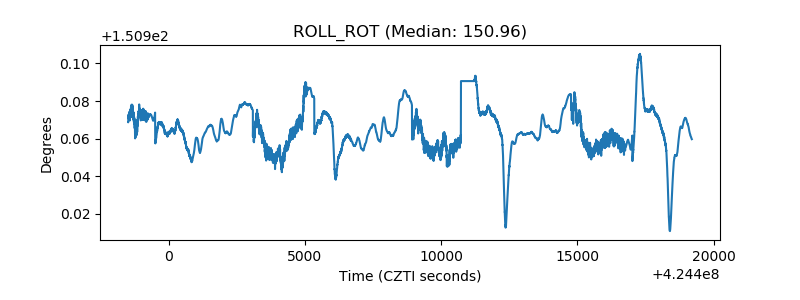 |
| _Roll_DEC | 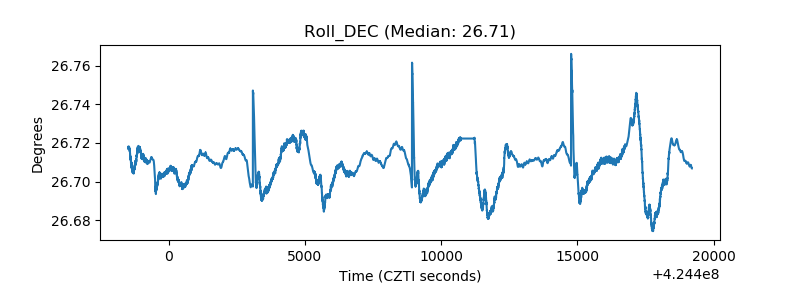 |
| _Roll_RA | 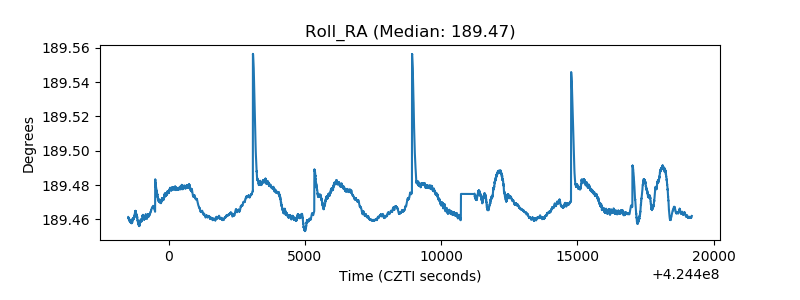 |
| Veto Counter | 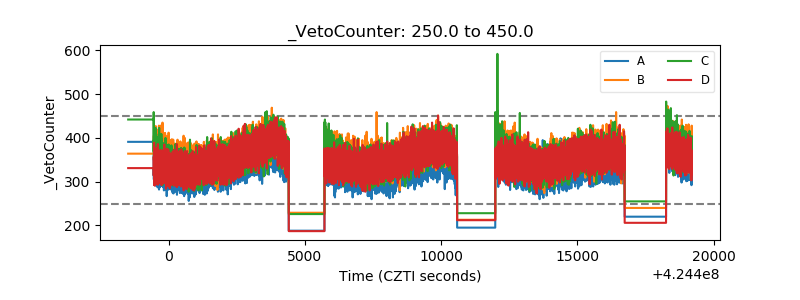 |