| Param | Original file | Final file |
|---|---|---|
| Filename | modeM0/AS1A12_044T21_9000005688_41687cztM0_level2.fits | modeM0/AS1A12_044T21_9000005688_41687cztM0_level2_quad_clean.evt |
| Size (bytes) | 351,648,000 | 92,499,840 |
| Size | 335.4 MB | 88.2 MB |
| Events in quadrant A | 3,100,803 | 628,013 |
| Events in quadrant B | 2,625,976 | 648,966 |
| Events in quadrant C | 2,890,358 | 604,451 |
| Events in quadrant D | 3,954,517 | 520,040 |
| Mode SS | |||
|---|---|---|---|
| Quadrant | BADHDUFLAG | Total packets | Discarded packets |
| A | 0 | 118 | 0 |
| B | 0 | 118 | 0 |
| C | 0 | 118 | 0 |
| D | 0 | 118 | 0 |
| Mode M9 | |||
|---|---|---|---|
| Quadrant | BADHDUFLAG | Total packets | Discarded packets |
| A | 0 | 31 | 0 |
| B | 0 | 32 | 0 |
| C | 0 | 32 | 0 |
| D | 0 | 32 | 0 |
| Mode M0 | |||
|---|---|---|---|
| Quadrant | BADHDUFLAG | Total packets | Discarded packets |
| A | 0 | 12623 | 2 |
| B | 0 | 11687 | 2 |
| C | 0 | 12165 | 2 |
| D | 0 | 15711 | 2 |
| Quadrant | Total seconds | Saturated seconds | Saturation percentage |
|---|---|---|---|
| A | 5714 | 22 | 0.385019% |
| B | 5714 | 11 | 0.192510% |
| C | 5713 | 76 | 1.330299% |
| D | 5713 | 479 | 8.384386% |
Noise dominated data is calculated using 1-second bins in cleaned event files. If a bin has >2000 counts, and if more than 50% of those come from <1% of pixels, then it is considered to be noise-dominated and hence unusable.
| Quadrant | # 1 sec bins | Bins with >0 counts | Bins with >2000 counts | High rate bins dominated by noise | Noise dominated (total time) | Noise dominated (detector-on time) | Marked lightcurve |
|---|---|---|---|---|---|---|---|
| A | 7386 | 5715 | 11 | 11 | 0.15% | 0.19% | 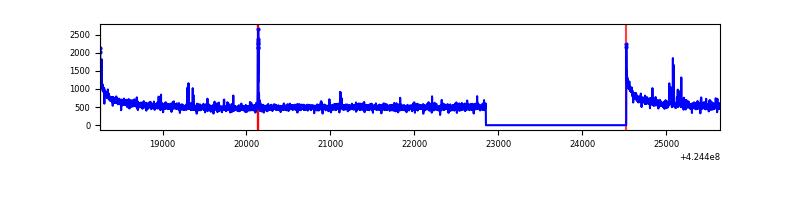 |
| B | 7386 | 5715 | 3 | 3 | 0.04% | 0.05% | 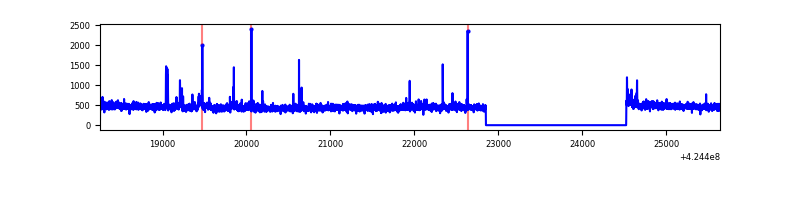 |
| C | 7385 | 5714 | 69 | 69 | 0.93% | 1.21% | 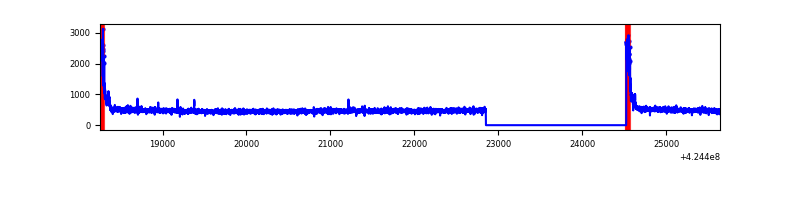 |
| D | 7385 | 5714 | 429 | 429 | 5.81% | 7.51% | 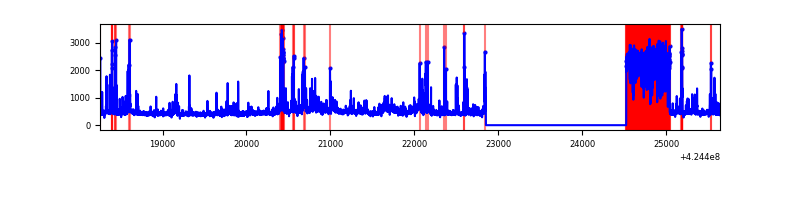 |
Top three noisy pixels from each quadrant. If the there are fewer than three noisy pixels in the level2.evt file, extra rows are filled as -1
| Pixel properties | Quadrant properties | ||||||
|---|---|---|---|---|---|---|---|
| Quadrant | DetID | PixID | Counts | Sigma | Mean | Median | Sigma |
| A | 10 | 83 | 540839 | 4054.13 | 644 | 629 | 133.2 |
| A | 13 | 248 | 54890 | 407.21 | 644 | 629 | 133.2 |
| A | 2 | 79 | 12710 | 90.66 | 644 | 629 | 133.2 |
| B | 5 | 255 | 73439 | 583.62 | 635 | 616 | 124.8 |
| B | 5 | 185 | 19377 | 150.35 | 635 | 616 | 124.8 |
| B | 12 | 111 | 15964 | 123.0 | 635 | 616 | 124.8 |
| C | 0 | 10 | 236108 | 1624.69 | 620 | 623 | 144.9 |
| C | 15 | 214 | 234345 | 1612.52 | 620 | 623 | 144.9 |
| C | 13 | 61 | 4048 | 23.63 | 620 | 623 | 144.9 |
| D | 2 | 120 | 1015775 | 6831.55 | 604 | 587 | 148.6 |
| D | 2 | 249 | 220710 | 1481.28 | 604 | 587 | 148.6 |
| D | 2 | 96 | 202967 | 1361.88 | 604 | 587 | 148.6 |
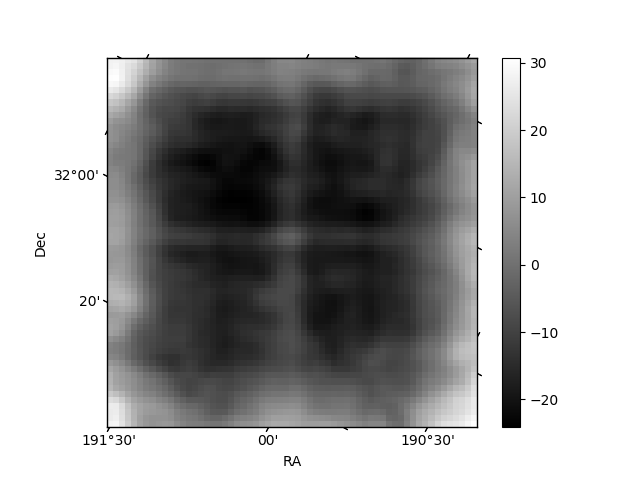
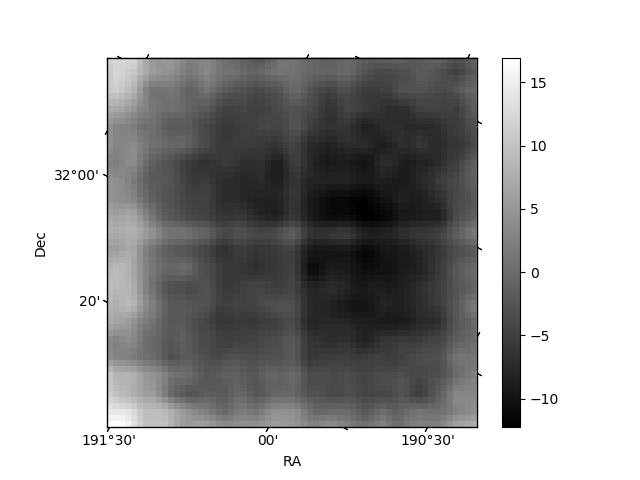
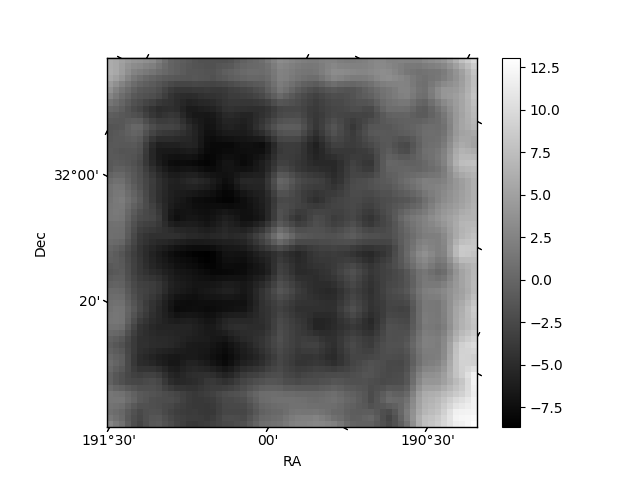
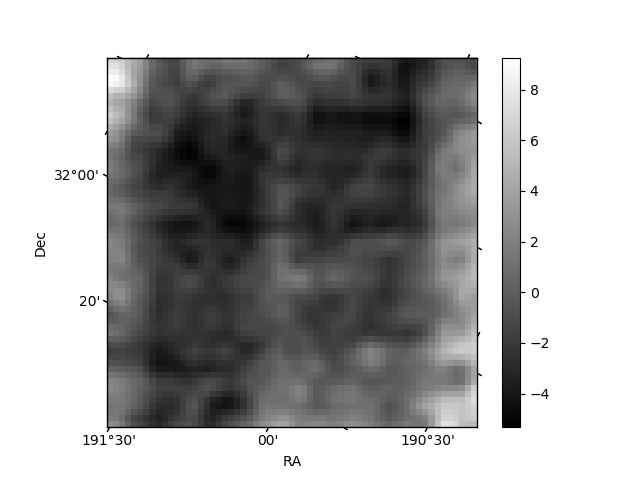
Histogram calculated using DETX and DETY for each event in the final _common_clean file
| Quadrant A | 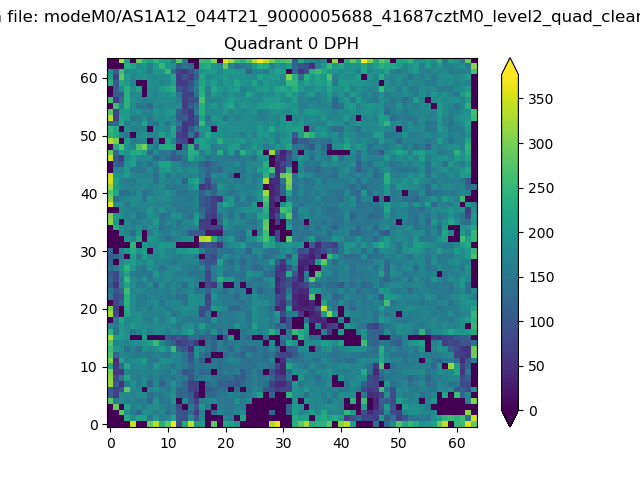 |
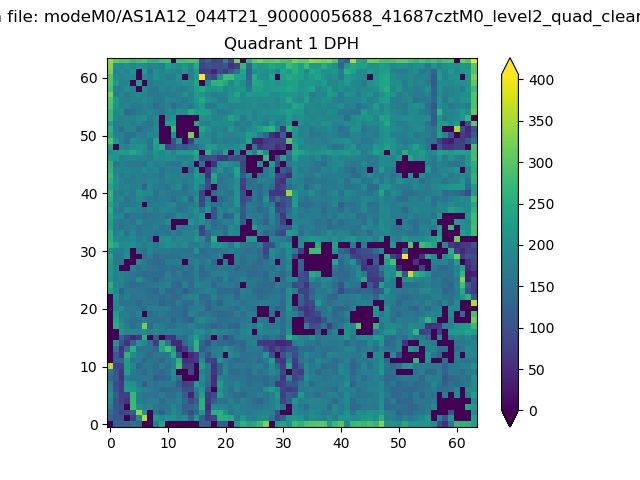 |
Quadrant B |
|---|---|---|---|
| Quadrant D | 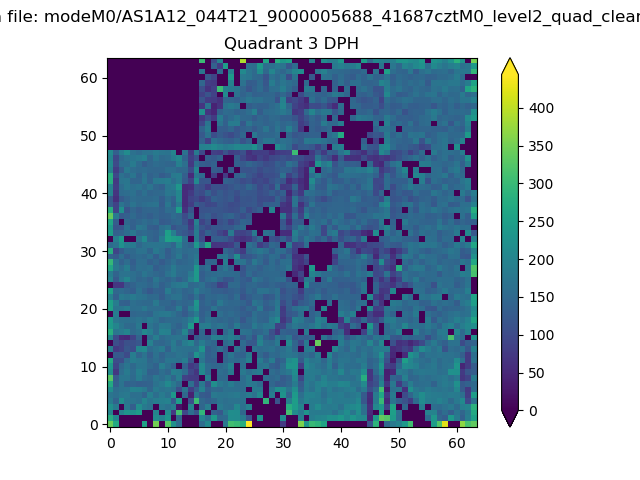 |
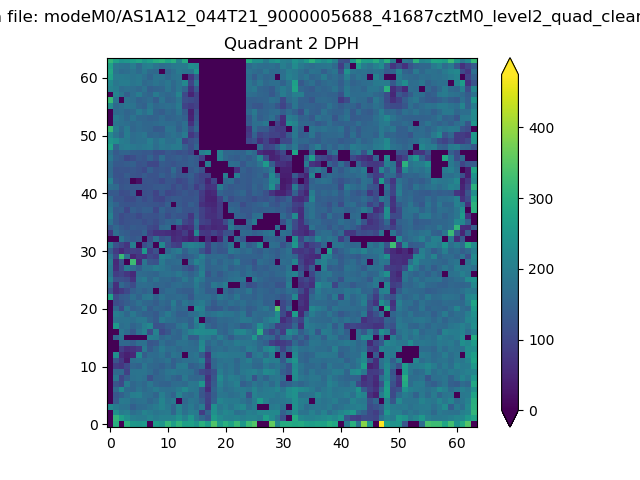 |
Quadrant C |
| Plot type | Count rate plots | Images |
|---|---|---|
| Comparison with Poisson distribution Blue bars denote a histogram of data divided into 1 sec bins. Red curve is a Poisson curve with rate = median count rate of data. |
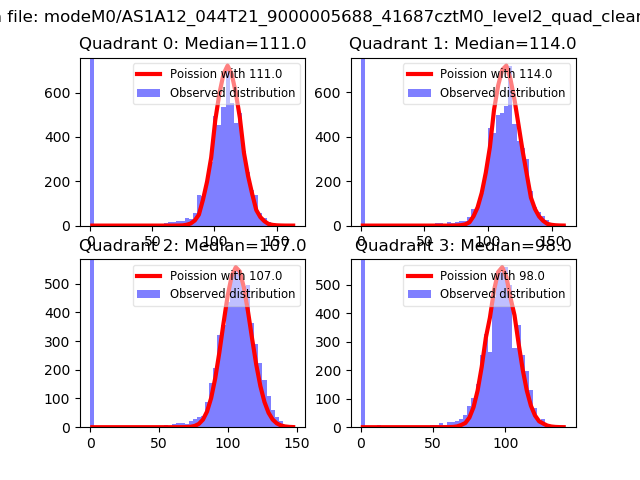 |
 |
| Quadrant-wise count rates Data is divided into 100 sec bins |
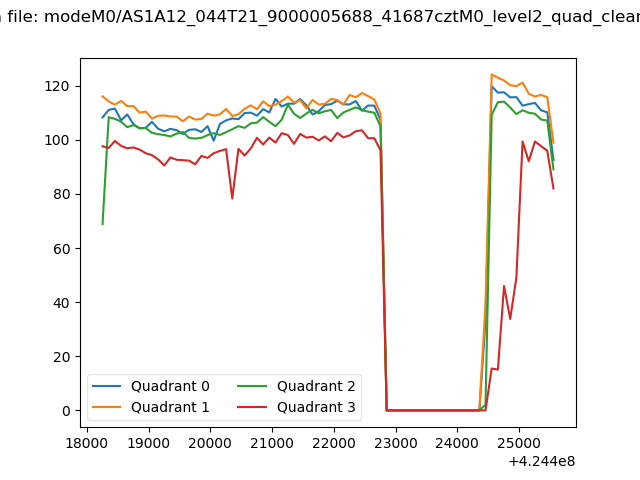 |
|
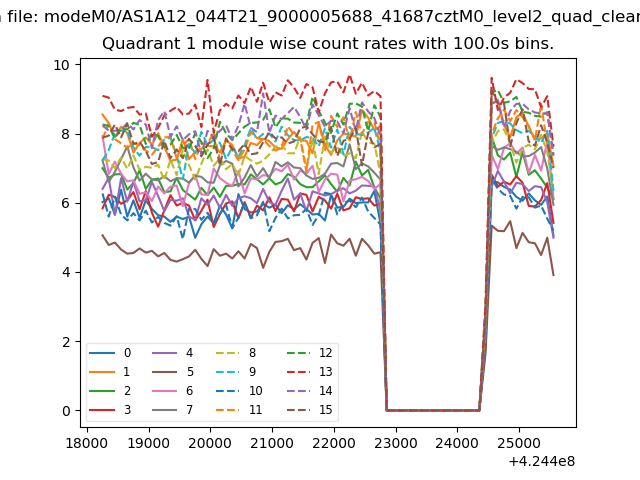
| Module-wise count rates for Quadrant A Data is divided into 100 sec bins |
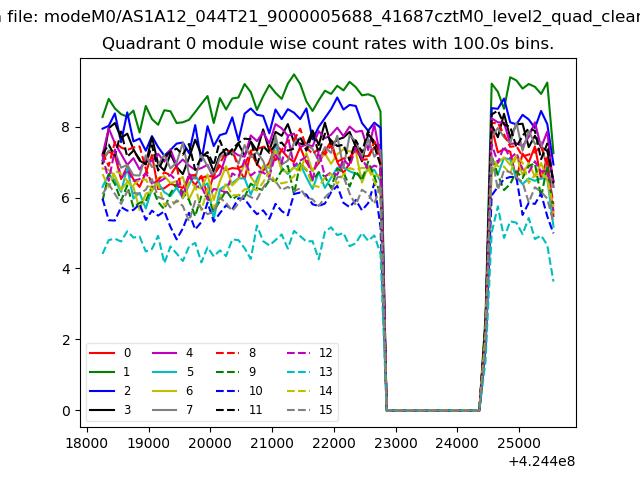 |
 |
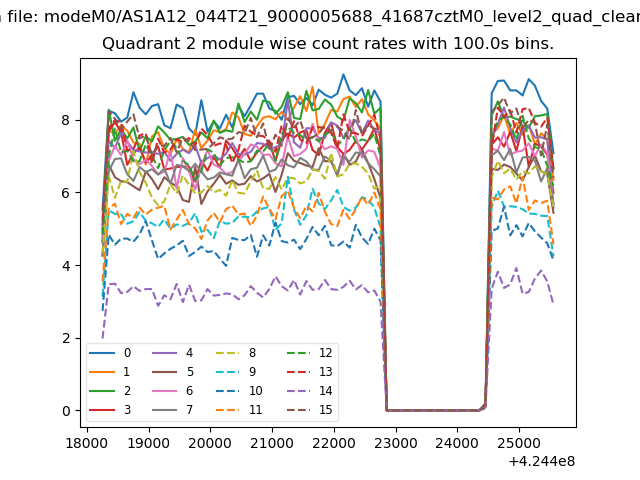
| Module-wise count rates for Quadrant B Data is divided into 100 sec bins |
 |
 |
| Module-wise count rates for Quadrant C Data is divided into 100 sec bins |
 |
 |
| Module-wise count rates for Quadrant D Data is divided into 100 sec bins |
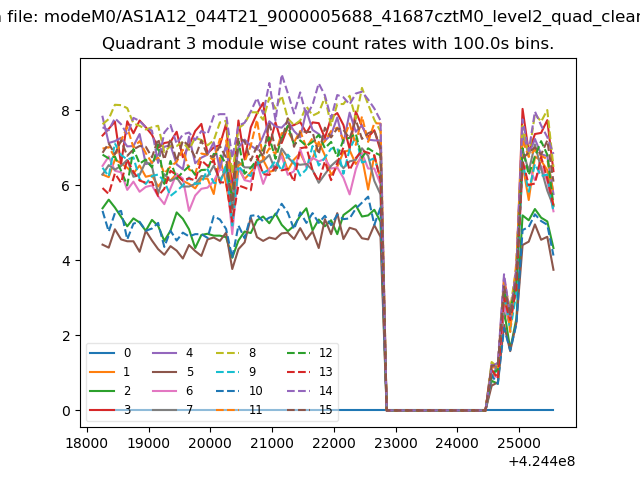 |
 |
| Parameter | Plot |
|---|---|
| CZT HV Monitor | 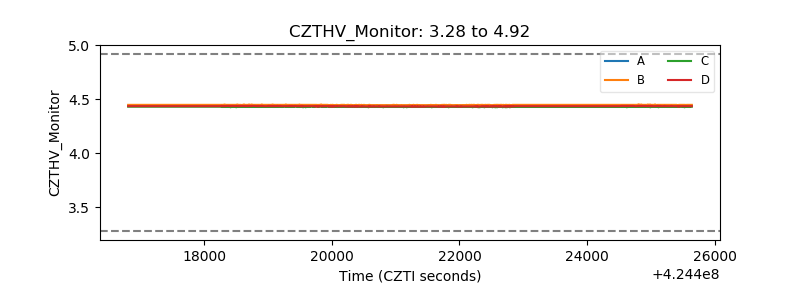 |
| D_VDD | 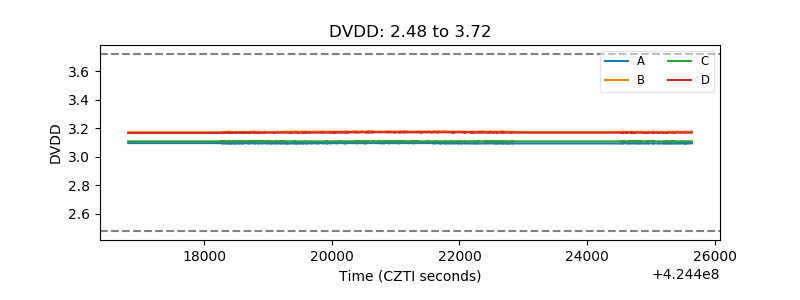 |
| Temperature 1 | 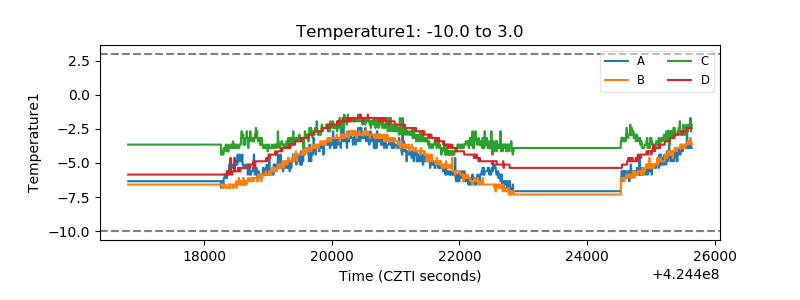 |
| Veto HV Monitor | 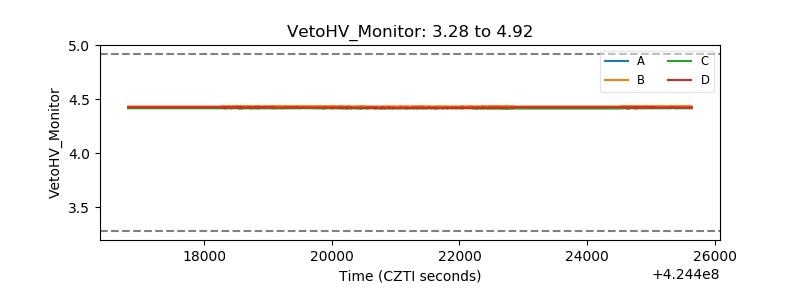 |
| Veto LLD | 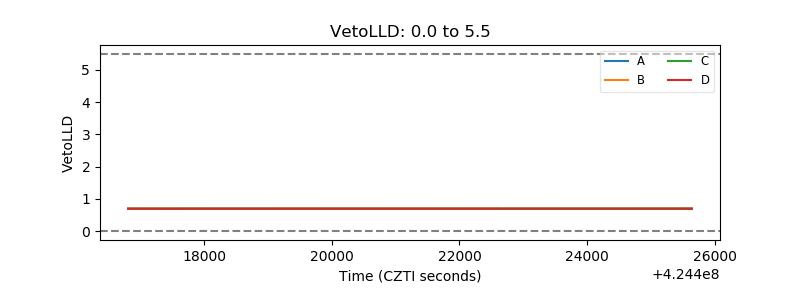 |
| Alpha Counter | 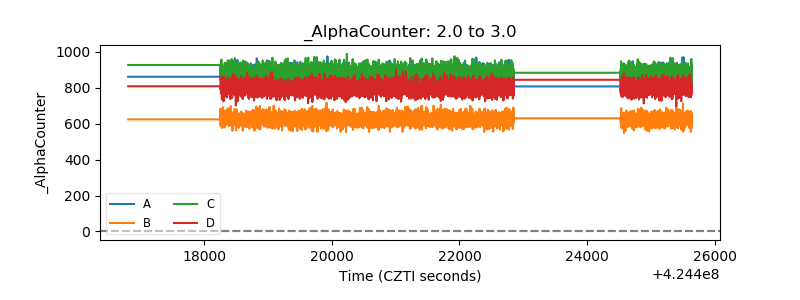 |
| _CPM_Rate | 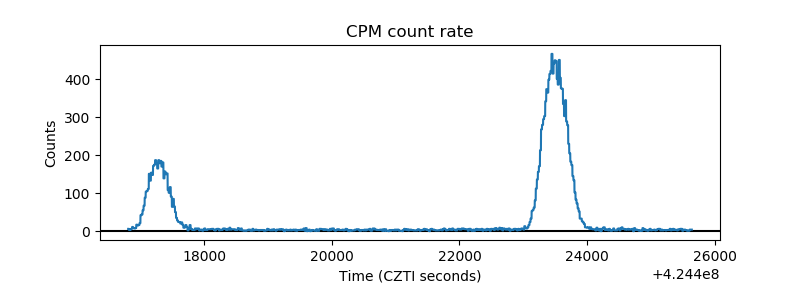 |
| CZT Counter | 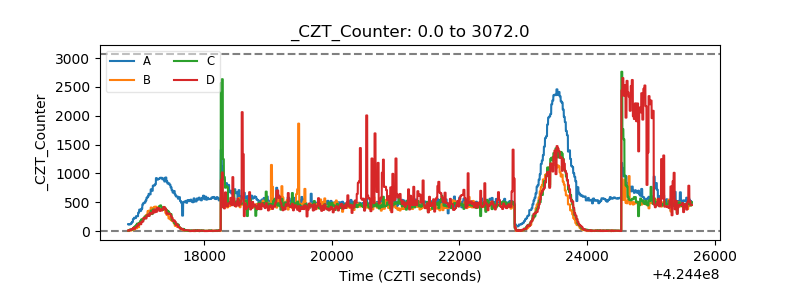 |
| +2.5 Volts monitor |  |
| +5 Volts monitor | 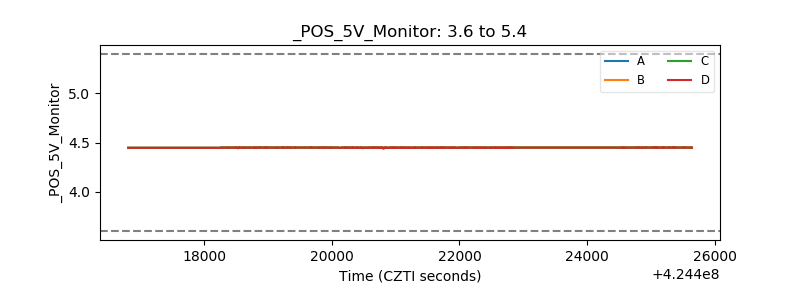 |
| _ROLL_ROT | 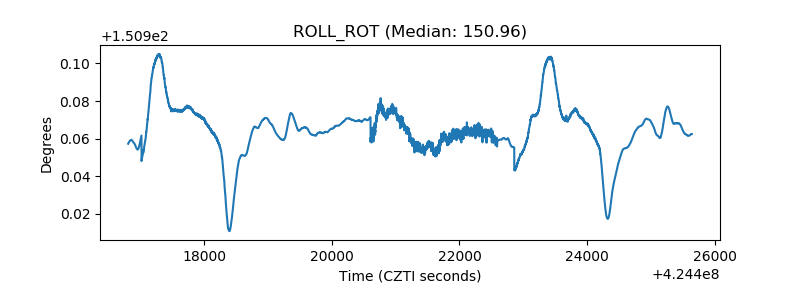 |
| _Roll_DEC | 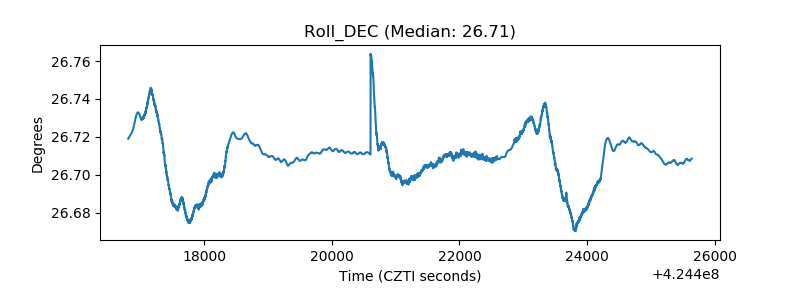 |
| _Roll_RA | 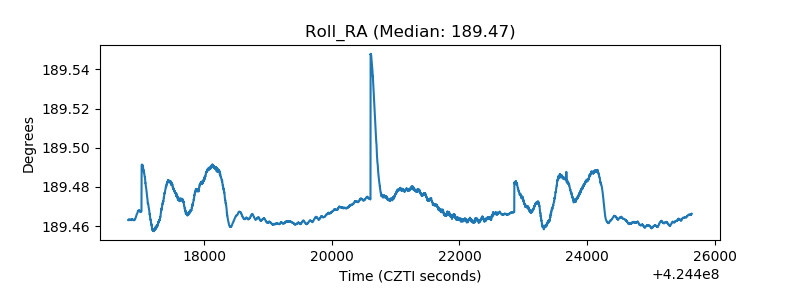 |
| Veto Counter | 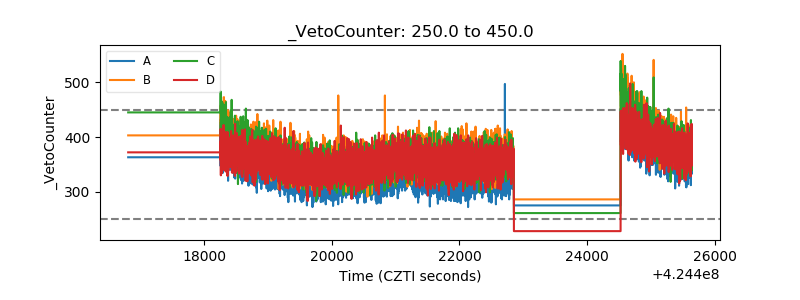 |