| Param | Original file | Final file |
|---|---|---|
| Filename | modeM0/AS1A12_044T21_9000005688_41689cztM0_level2.fits | modeM0/AS1A12_044T21_9000005688_41689cztM0_level2_quad_clean.evt |
| Size (bytes) | 404,642,880 | 92,278,080 |
| Size | 385.9 MB | 88.0 MB |
| Events in quadrant A | 3,100,283 | 648,259 |
| Events in quadrant B | 2,638,335 | 661,828 |
| Events in quadrant C | 2,865,901 | 617,119 |
| Events in quadrant D | 5,936,349 | 474,304 |
| Mode SS | |||
|---|---|---|---|
| Quadrant | BADHDUFLAG | Total packets | Discarded packets |
| A | 0 | 112 | 0 |
| B | 0 | 112 | 0 |
| C | 0 | 112 | 0 |
| D | 0 | 112 | 0 |
| Mode M9 | |||
|---|---|---|---|
| Quadrant | BADHDUFLAG | Total packets | Discarded packets |
| A | 0 | 27 | 0 |
| B | 0 | 28 | 0 |
| C | 0 | 28 | 0 |
| D | 0 | 28 | 0 |
| Mode M0 | |||
|---|---|---|---|
| Quadrant | BADHDUFLAG | Total packets | Discarded packets |
| A | 0 | 12605 | 2 |
| B | 0 | 11534 | 2 |
| C | 0 | 11968 | 2 |
| D | 0 | 21460 | 2 |
| Quadrant | Total seconds | Saturated seconds | Saturation percentage |
|---|---|---|---|
| A | 5620 | 12 | 0.213523% |
| B | 5620 | 30 | 0.533808% |
| C | 5620 | 67 | 1.192171% |
| D | 5620 | 1172 | 20.854093% |
Noise dominated data is calculated using 1-second bins in cleaned event files. If a bin has >2000 counts, and if more than 50% of those come from <1% of pixels, then it is considered to be noise-dominated and hence unusable.
| Quadrant | # 1 sec bins | Bins with >0 counts | Bins with >2000 counts | High rate bins dominated by noise | Noise dominated (total time) | Noise dominated (detector-on time) | Marked lightcurve |
|---|---|---|---|---|---|---|---|
| A | 7383 | 5621 | 3 | 3 | 0.04% | 0.05% | 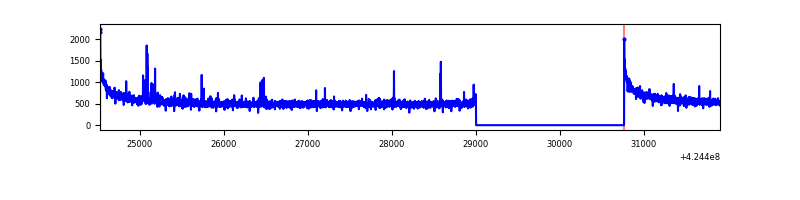 |
| B | 7383 | 5621 | 19 | 19 | 0.26% | 0.34% | 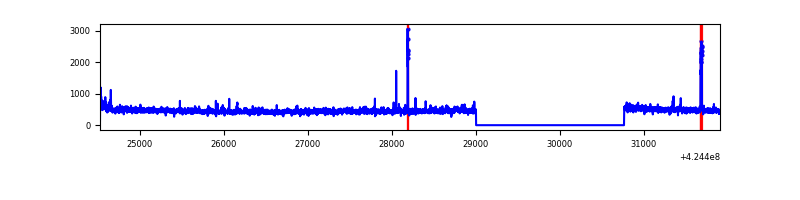 |
| C | 7383 | 5621 | 59 | 59 | 0.80% | 1.05% | 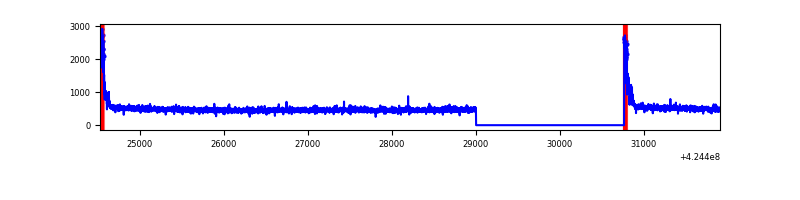 |
| D | 7383 | 5621 | 1050 | 1050 | 14.22% | 18.68% | 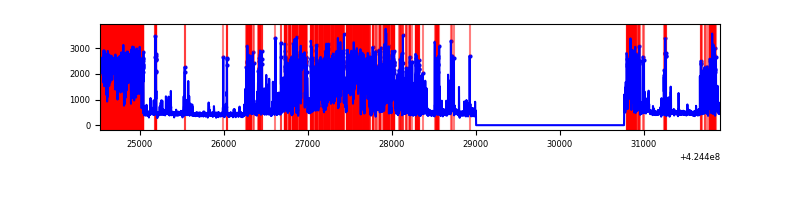 |
Top three noisy pixels from each quadrant. If the there are fewer than three noisy pixels in the level2.evt file, extra rows are filled as -1
| Pixel properties | Quadrant properties | ||||||
|---|---|---|---|---|---|---|---|
| Quadrant | DetID | PixID | Counts | Sigma | Mean | Median | Sigma |
| A | 10 | 83 | 535744 | 4027.69 | 645 | 632 | 132.9 |
| A | 13 | 248 | 38999 | 288.78 | 645 | 632 | 132.9 |
| A | 15 | 223 | 17400 | 126.21 | 645 | 632 | 132.9 |
| B | 5 | 255 | 83728 | 666.58 | 636 | 619 | 124.7 |
| B | 0 | 190 | 25143 | 196.7 | 636 | 619 | 124.7 |
| B | 0 | 245 | 19520 | 151.6 | 636 | 619 | 124.7 |
| C | 15 | 214 | 234252 | 1589.33 | 622 | 627 | 147.0 |
| C | 0 | 10 | 206868 | 1403.04 | 622 | 627 | 147.0 |
| C | 13 | 61 | 4079 | 23.48 | 622 | 627 | 147.0 |
| D | 13 | 249 | 1793408 | 12866.41 | 574 | 559 | 139.3 |
| D | 2 | 120 | 1290650 | 9258.36 | 574 | 559 | 139.3 |
| D | 2 | 249 | 250562 | 1794.15 | 574 | 559 | 139.3 |
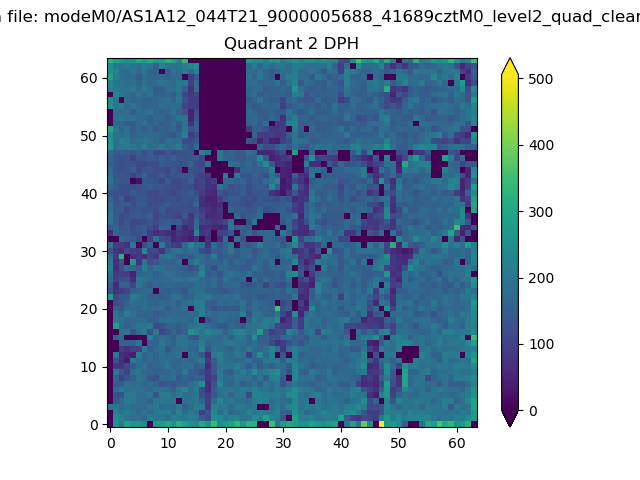
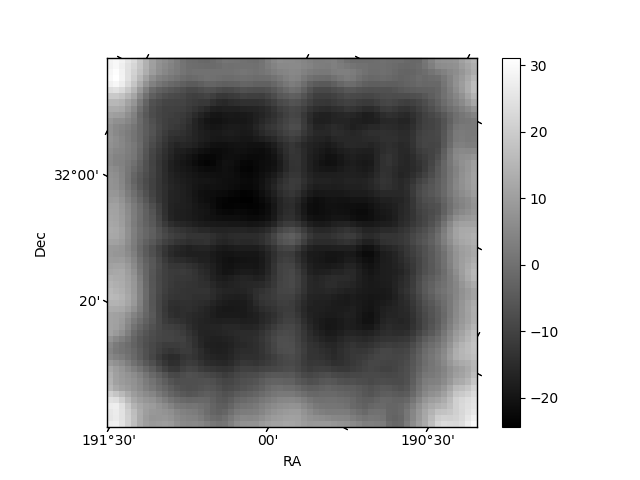
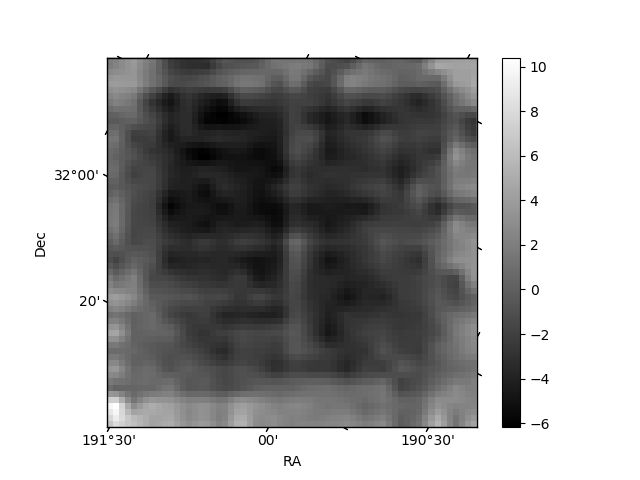
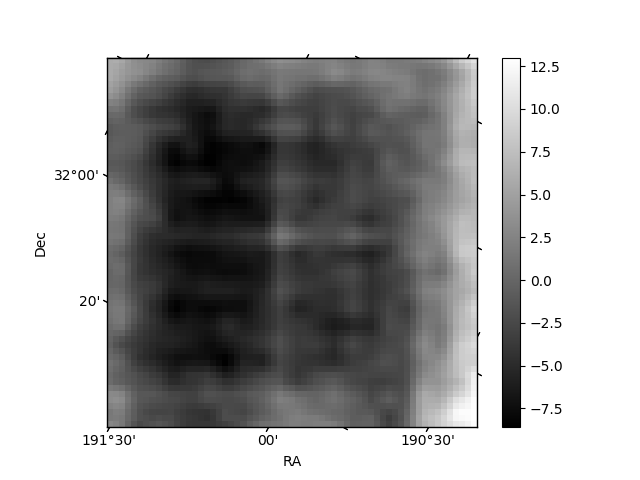
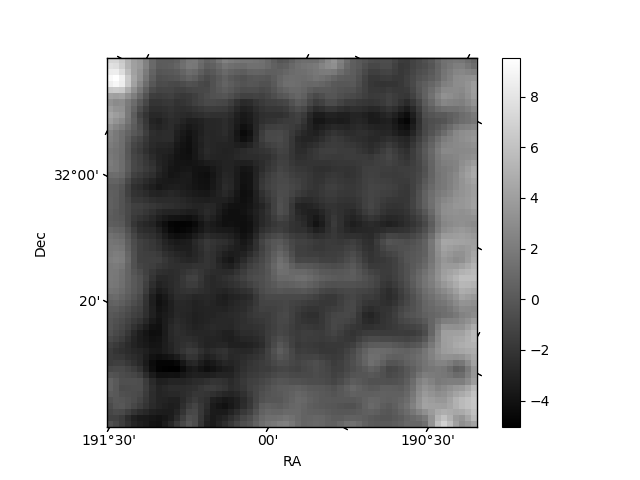
Histogram calculated using DETX and DETY for each event in the final _common_clean file
| Quadrant A | 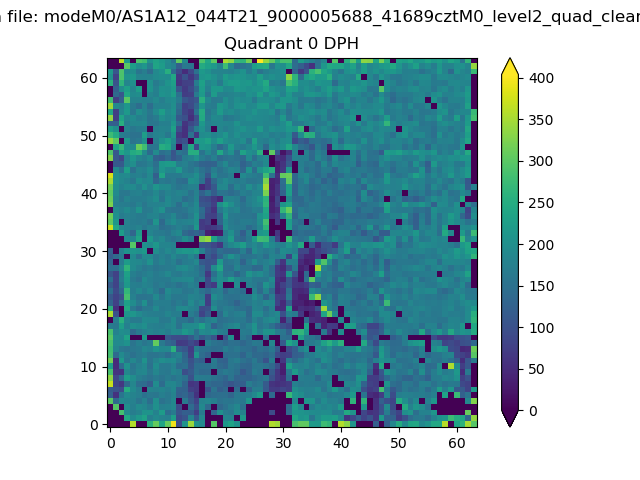 |
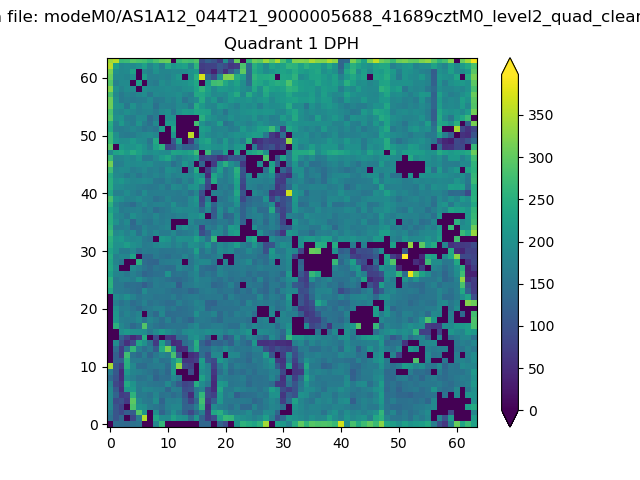 |
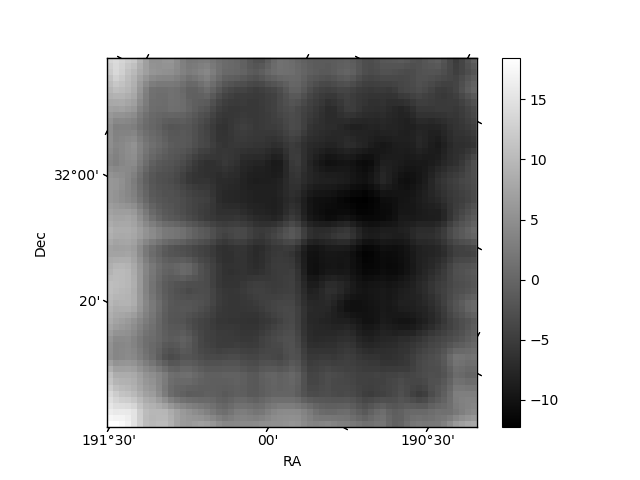
Quadrant B |
|---|---|---|---|
| Quadrant D | 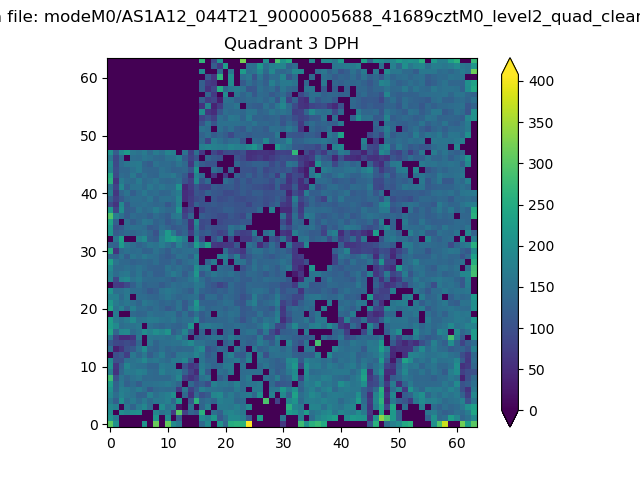 |
 |
Quadrant C |
| Plot type | Count rate plots | Images |
|---|---|---|
| Comparison with Poisson distribution Blue bars denote a histogram of data divided into 1 sec bins. Red curve is a Poisson curve with rate = median count rate of data. |
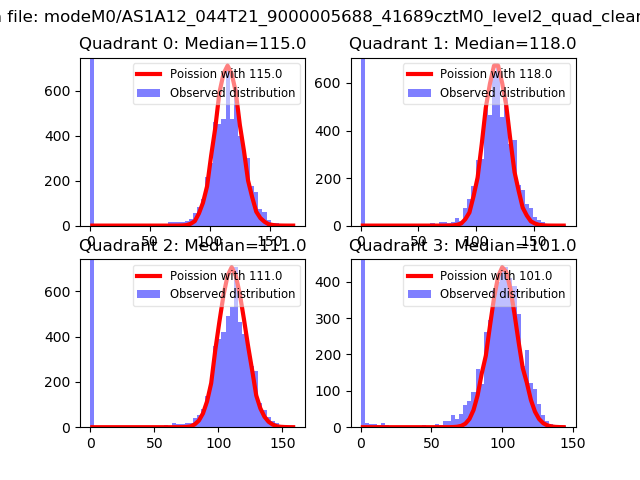 |
 |
| Quadrant-wise count rates Data is divided into 100 sec bins |
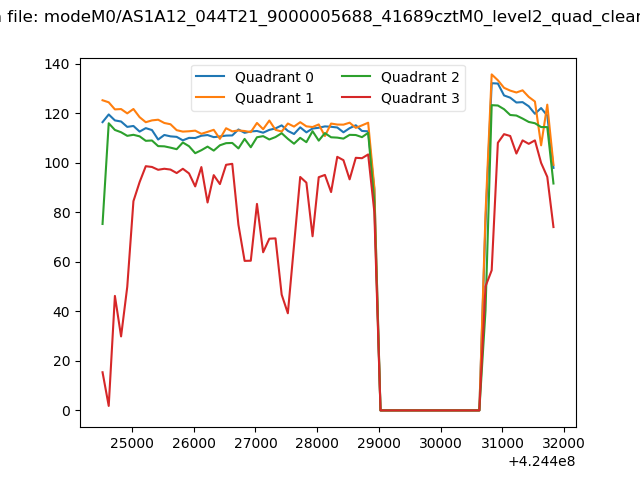 |
|
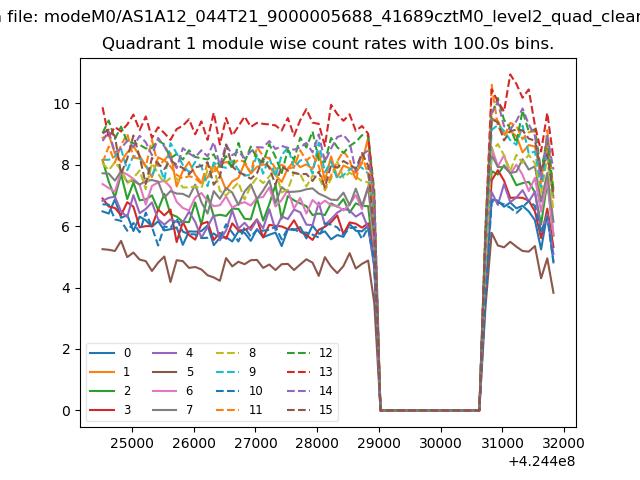
| Module-wise count rates for Quadrant A Data is divided into 100 sec bins |
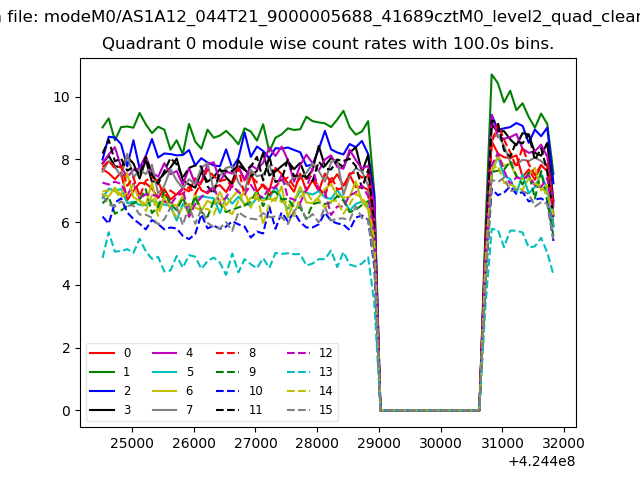 |
 |
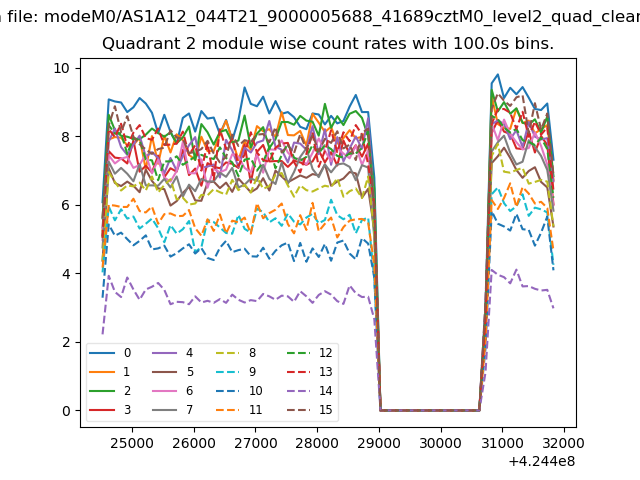
| Module-wise count rates for Quadrant B Data is divided into 100 sec bins |
 |
 |
| Module-wise count rates for Quadrant C Data is divided into 100 sec bins |
 |
 |
| Module-wise count rates for Quadrant D Data is divided into 100 sec bins |
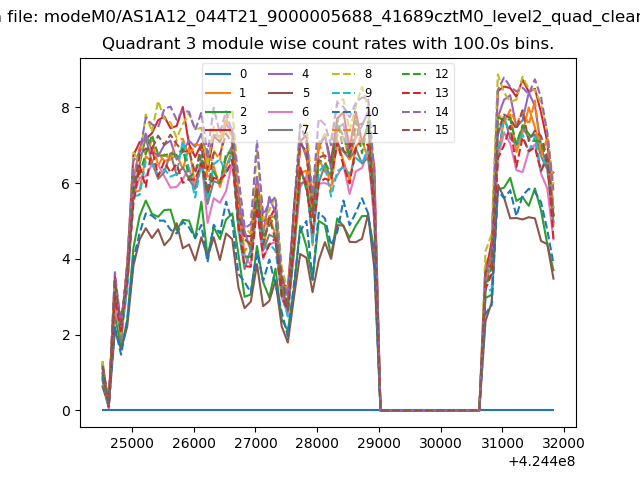 |
 |
| Parameter | Plot |
|---|---|
| CZT HV Monitor | 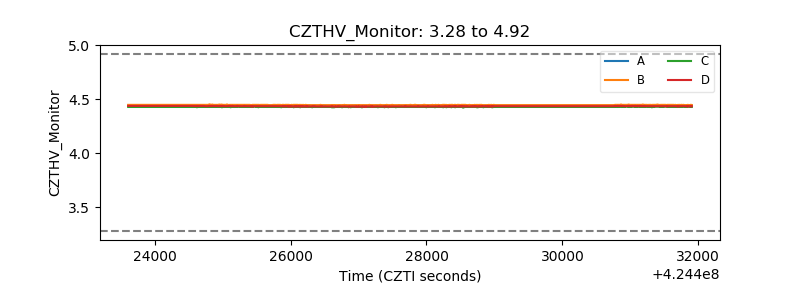 |
| D_VDD | 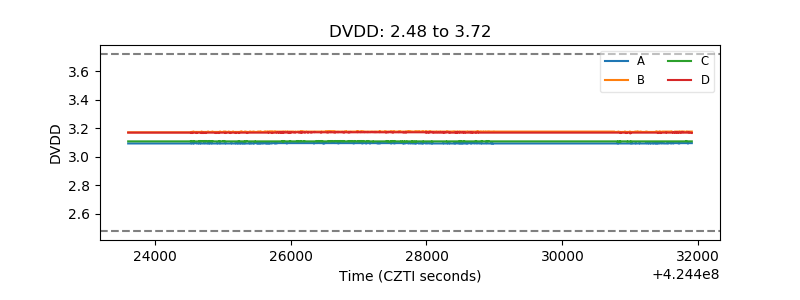 |
| Temperature 1 | 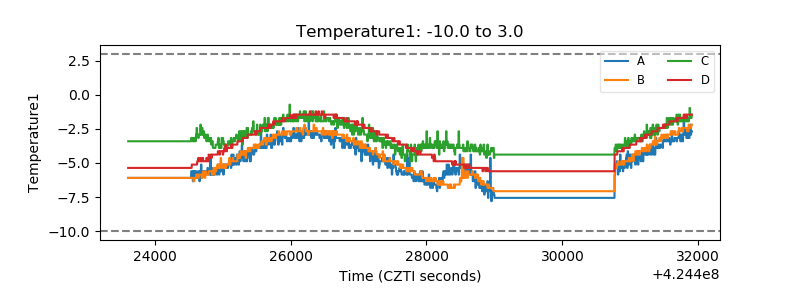 |
| Veto HV Monitor | 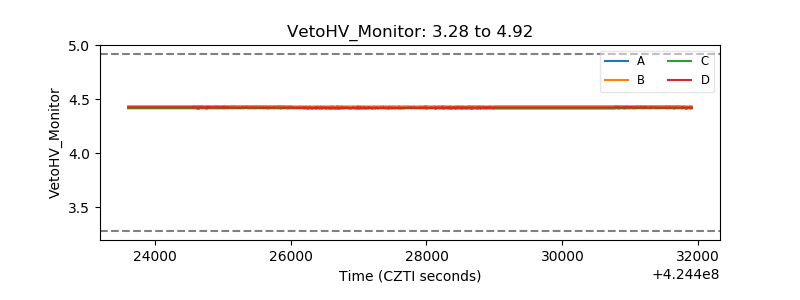 |
| Veto LLD | 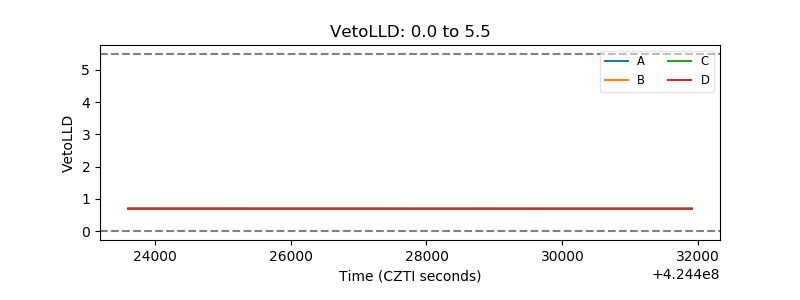 |
| Alpha Counter | 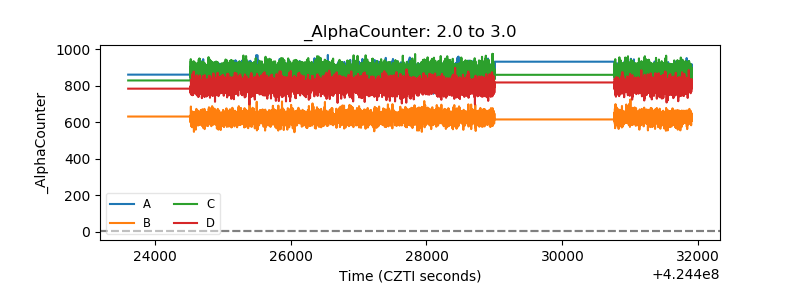 |
| _CPM_Rate |  |
| CZT Counter | 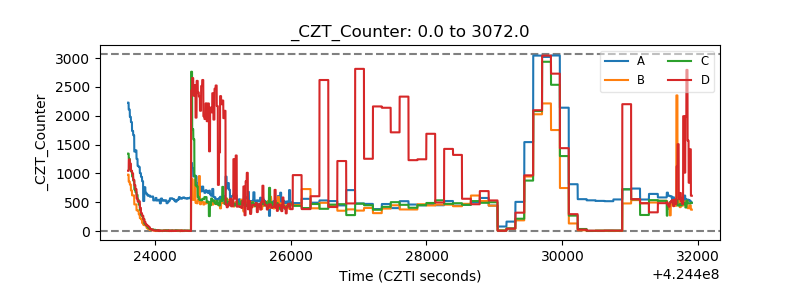 |
| +2.5 Volts monitor | 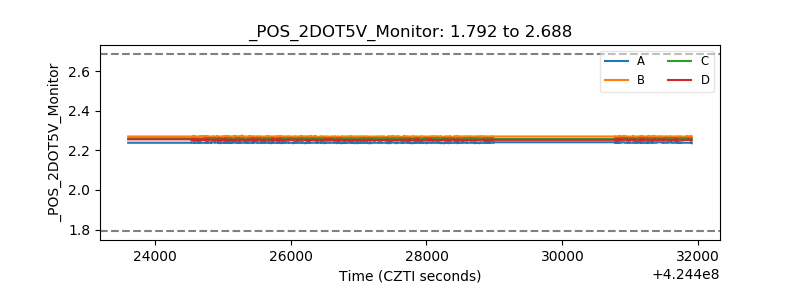 |
| +5 Volts monitor | 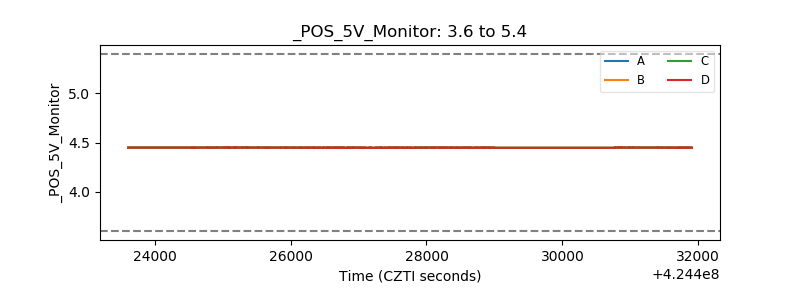 |
| _ROLL_ROT | 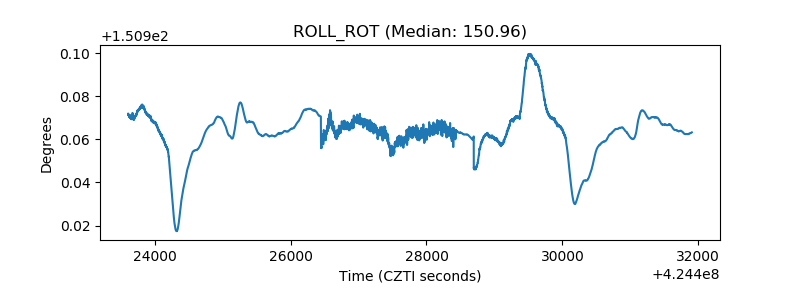 |
| _Roll_DEC | 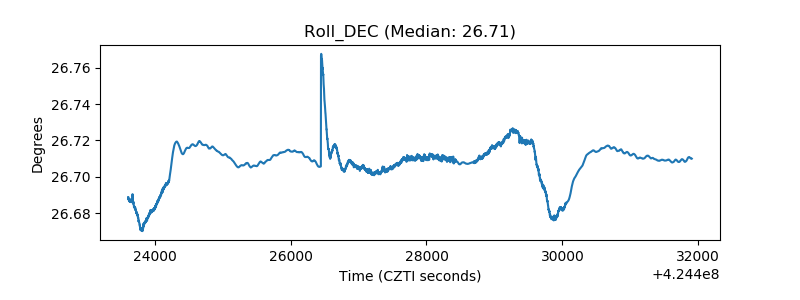 |
| _Roll_RA | 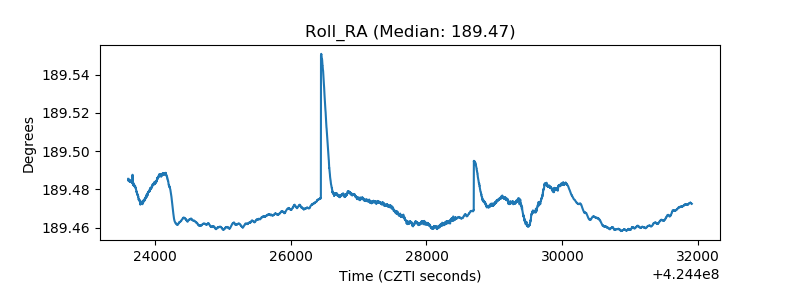 |
| Veto Counter | 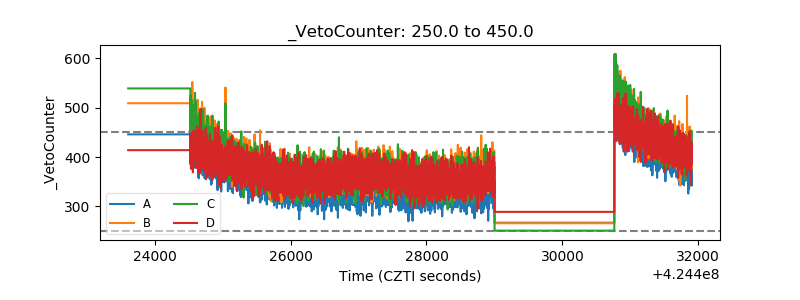 |