| Param | Original file | Final file |
|---|---|---|
| Filename | modeM0/AS1A12_044T21_9000005688_41690cztM0_level2.fits | modeM0/AS1A12_044T21_9000005688_41690cztM0_level2_quad_clean.evt |
| Size (bytes) | 215,087,040 | 56,885,760 |
| Size | 205.1 MB | 54.3 MB |
| Events in quadrant A | 1,796,478 | 396,111 |
| Events in quadrant B | 1,574,486 | 399,290 |
| Events in quadrant C | 1,659,318 | 374,133 |
| Events in quadrant D | 2,673,593 | 319,483 |
| Mode SS | |||
|---|---|---|---|
| Quadrant | BADHDUFLAG | Total packets | Discarded packets |
| A | 0 | 66 | 0 |
| B | 0 | 66 | 0 |
| C | 0 | 66 | 0 |
| D | 0 | 66 | 0 |
| Mode M9 | |||
|---|---|---|---|
| Quadrant | BADHDUFLAG | Total packets | Discarded packets |
| A | 0 | 10 | 0 |
| B | 0 | 10 | 0 |
| C | 0 | 10 | 0 |
| D | 0 | 11 | 0 |
| Mode M0 | |||
|---|---|---|---|
| Quadrant | BADHDUFLAG | Total packets | Discarded packets |
| A | 0 | 7262 | 1 |
| B | 0 | 6876 | 1 |
| C | 0 | 6941 | 1 |
| D | 0 | 10150 | 1 |
| Quadrant | Total seconds | Saturated seconds | Saturation percentage |
|---|---|---|---|
| A | 3292 | 5 | 0.151883% |
| B | 3292 | 20 | 0.607533% |
| C | 3292 | 30 | 0.911300% |
| D | 3292 | 376 | 11.421628% |
Noise dominated data is calculated using 1-second bins in cleaned event files. If a bin has >2000 counts, and if more than 50% of those come from <1% of pixels, then it is considered to be noise-dominated and hence unusable.
| Quadrant | # 1 sec bins | Bins with >0 counts | Bins with >2000 counts | High rate bins dominated by noise | Noise dominated (total time) | Noise dominated (detector-on time) | Marked lightcurve |
|---|---|---|---|---|---|---|---|
| A | 3292 | 3292 | 1 | 1 | 0.03% | 0.03% | 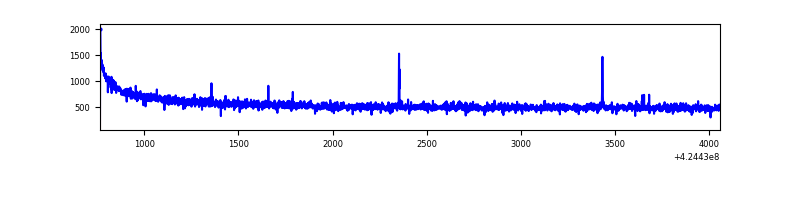 |
| B | 3292 | 3292 | 15 | 15 | 0.46% | 0.46% | 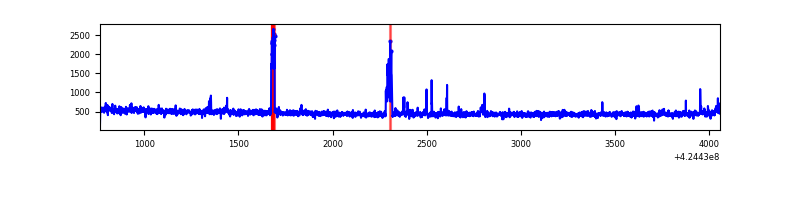 |
| C | 3292 | 3292 | 26 | 26 | 0.79% | 0.79% | 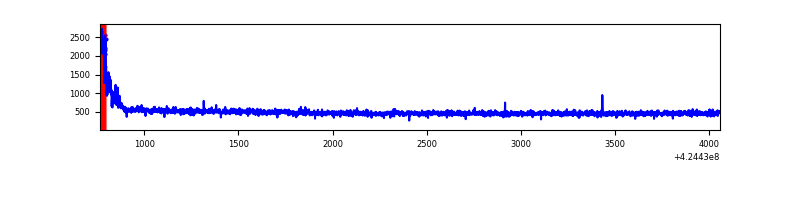 |
| D | 3291 | 3291 | 345 | 345 | 10.48% | 10.48% | 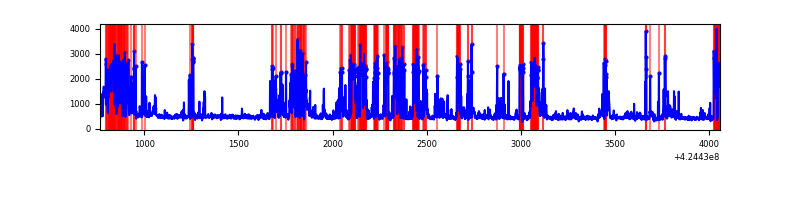 |
Top three noisy pixels from each quadrant. If the there are fewer than three noisy pixels in the level2.evt file, extra rows are filled as -1
| Pixel properties | Quadrant properties | ||||||
|---|---|---|---|---|---|---|---|
| Quadrant | DetID | PixID | Counts | Sigma | Mean | Median | Sigma |
| A | 10 | 83 | 303676 | 3781.94 | 382 | 373 | 80.2 |
| A | 13 | 248 | 7857 | 93.32 | 382 | 373 | 80.2 |
| A | 15 | 223 | 4117 | 46.68 | 382 | 373 | 80.2 |
| B | 5 | 255 | 57401 | 777.7 | 373 | 362 | 73.3 |
| B | 0 | 186 | 33941 | 457.83 | 373 | 362 | 73.3 |
| B | 0 | 245 | 11567 | 152.77 | 373 | 362 | 73.3 |
| C | 15 | 214 | 135454 | 1571.07 | 366 | 368 | 86.0 |
| C | 0 | 10 | 94903 | 1099.46 | 366 | 368 | 86.0 |
| C | 13 | 61 | 2383 | 23.43 | 366 | 368 | 86.0 |
| D | 2 | 249 | 578873 | 6518.38 | 354 | 343 | 88.8 |
| D | 13 | 249 | 348728 | 3925.31 | 354 | 343 | 88.8 |
| D | 2 | 120 | 305156 | 3434.37 | 354 | 343 | 88.8 |
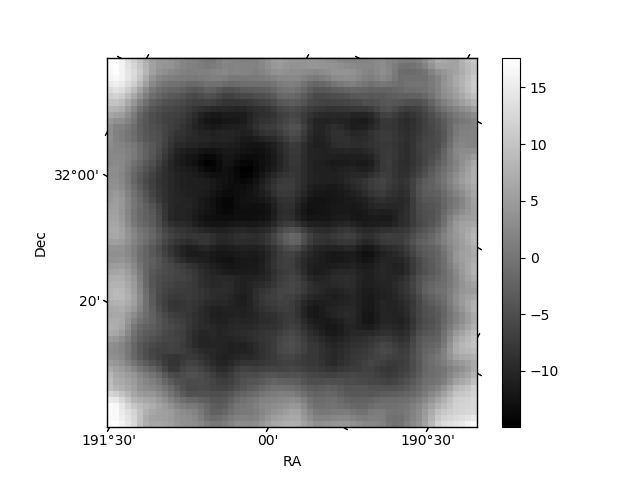
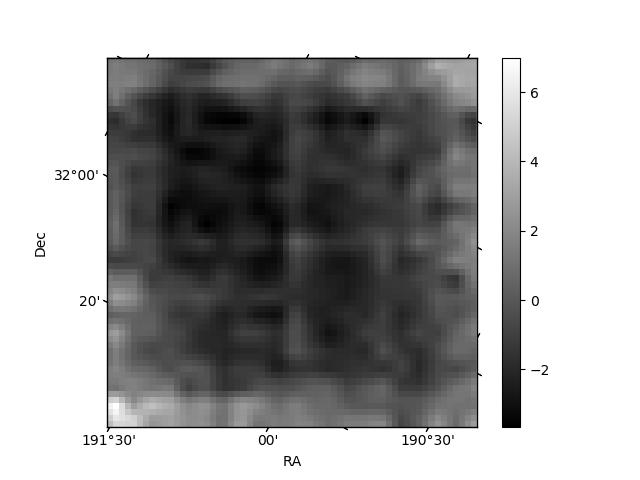
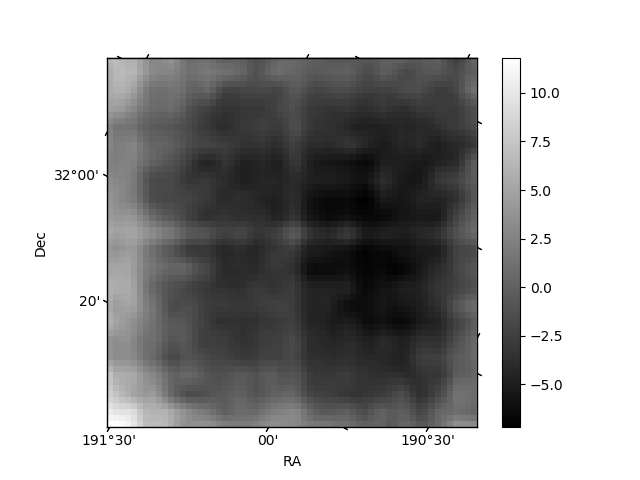
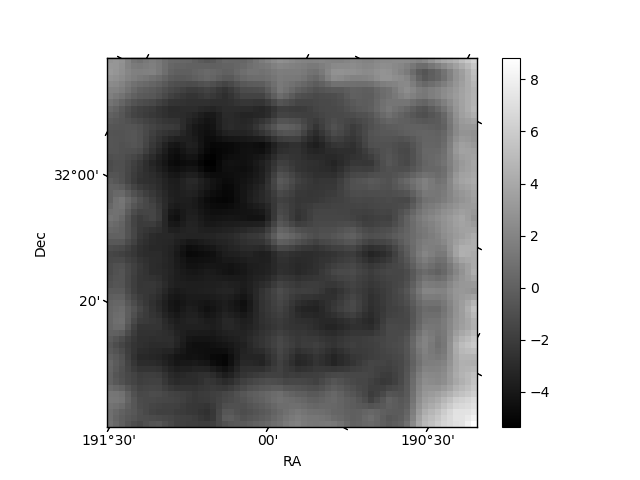
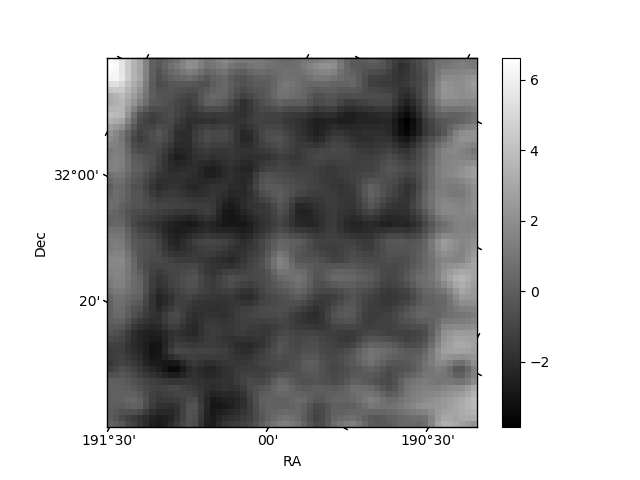
Histogram calculated using DETX and DETY for each event in the final _common_clean file
| Quadrant A | 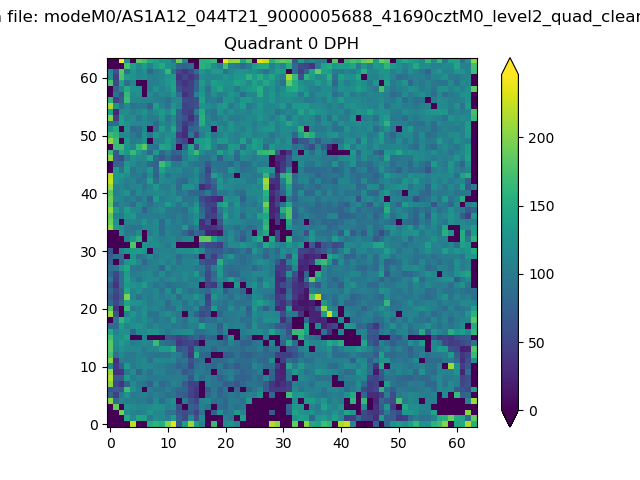 |
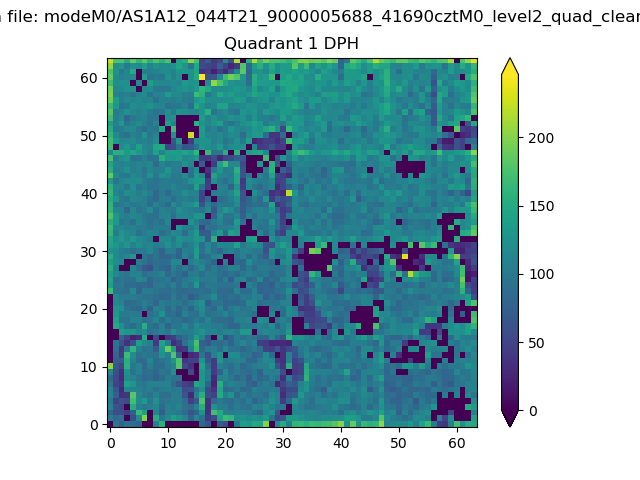 |
Quadrant B |
|---|---|---|---|
| Quadrant D | 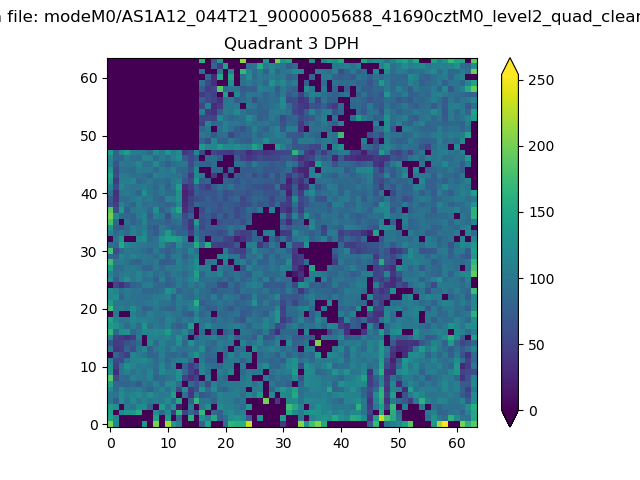 |
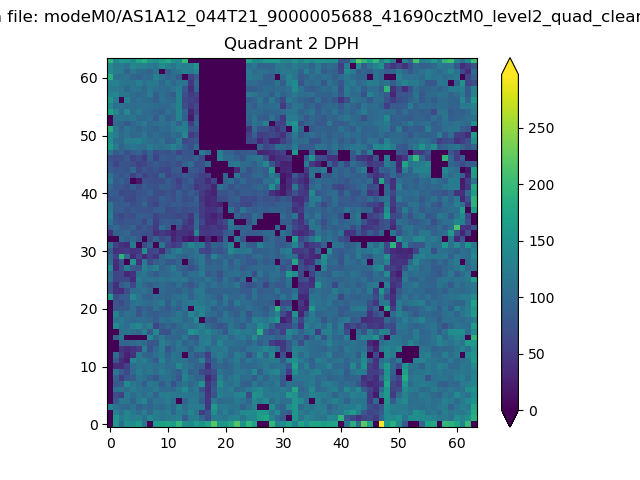 |
Quadrant C |
| Plot type | Count rate plots | Images |
|---|---|---|
| Comparison with Poisson distribution Blue bars denote a histogram of data divided into 1 sec bins. Red curve is a Poisson curve with rate = median count rate of data. |
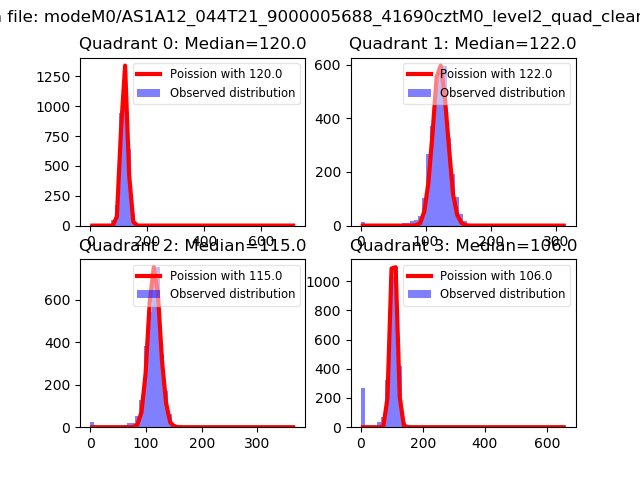 |
 |
| Quadrant-wise count rates Data is divided into 100 sec bins |
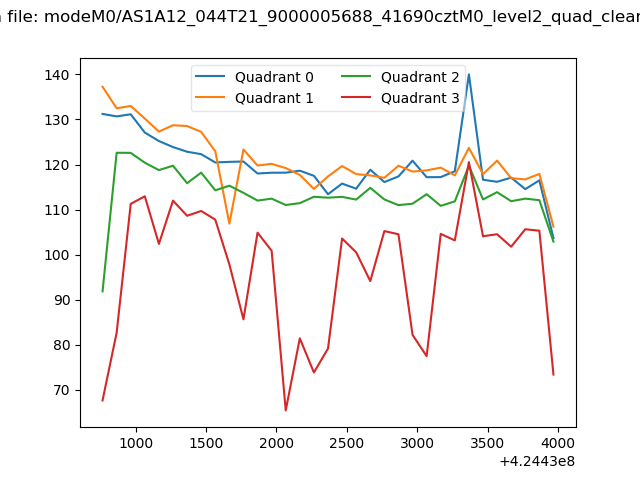 |
|
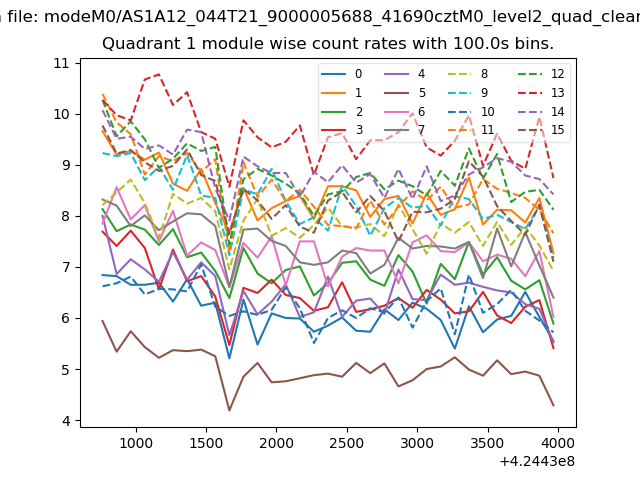
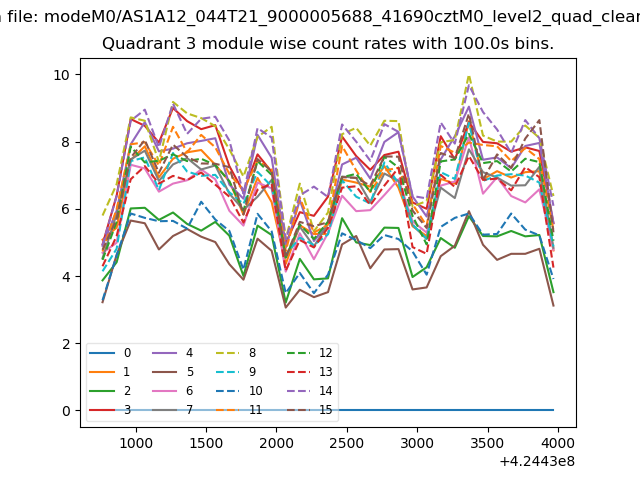
| Module-wise count rates for Quadrant A Data is divided into 100 sec bins |
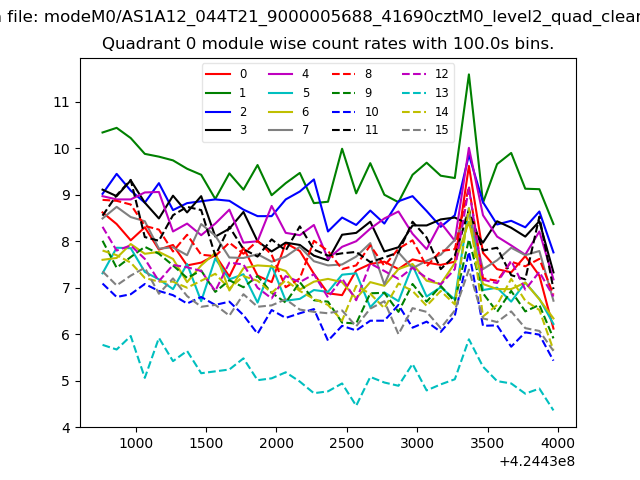 |
 |
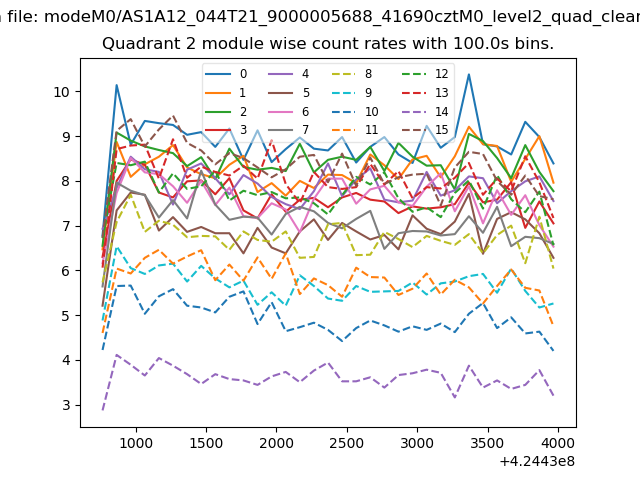
| Module-wise count rates for Quadrant B Data is divided into 100 sec bins |
 |
 |
| Module-wise count rates for Quadrant C Data is divided into 100 sec bins |
 |
 |
| Module-wise count rates for Quadrant D Data is divided into 100 sec bins |
 |
 |
| Parameter | Plot |
|---|---|
| CZT HV Monitor | 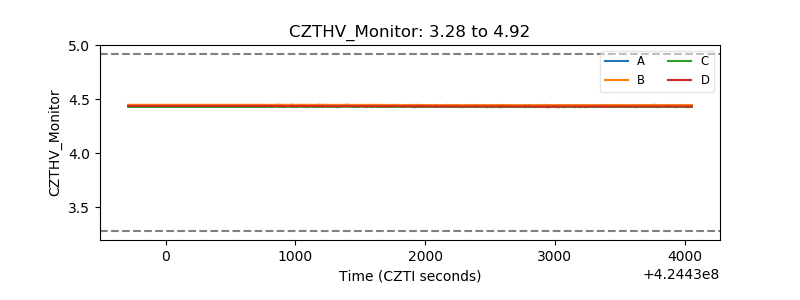 |
| D_VDD | 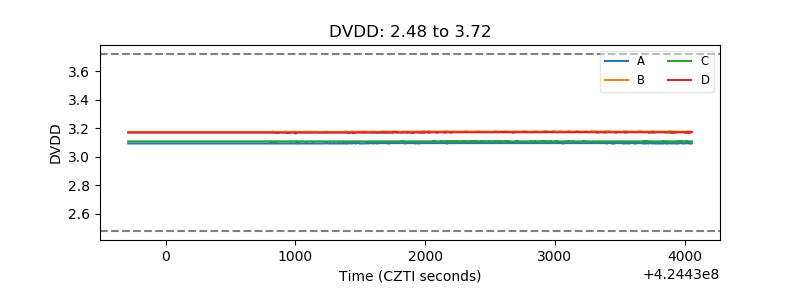 |
| Temperature 1 | 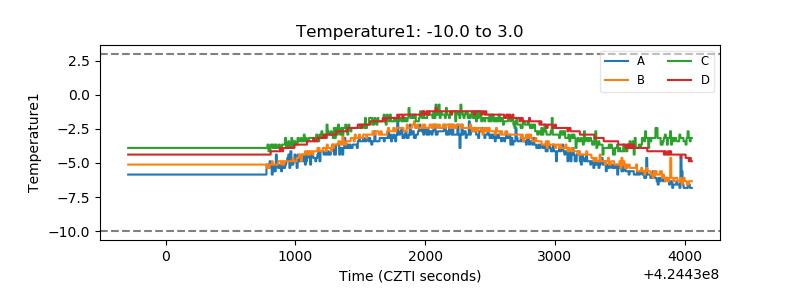 |
| Veto HV Monitor | 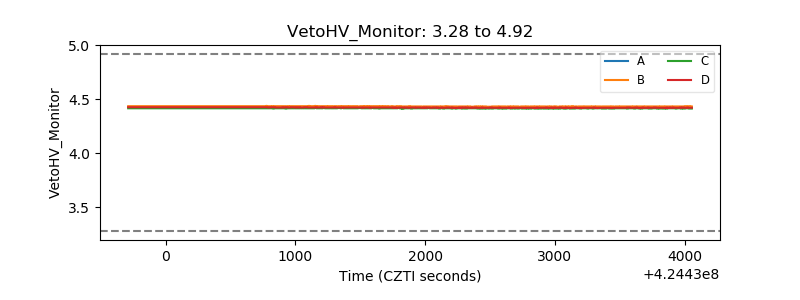 |
| Veto LLD | 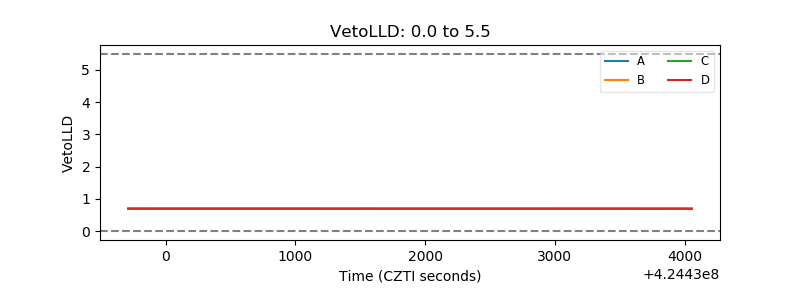 |
| Alpha Counter | 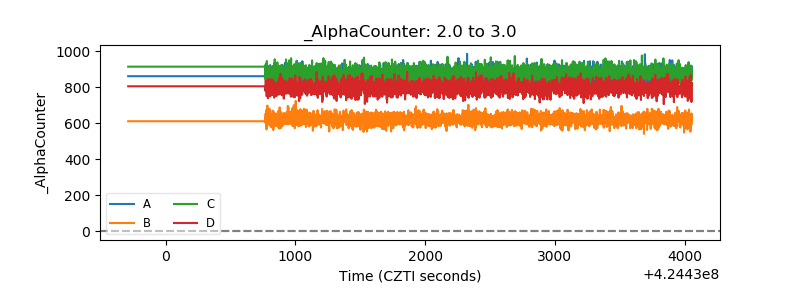 |
| _CPM_Rate | 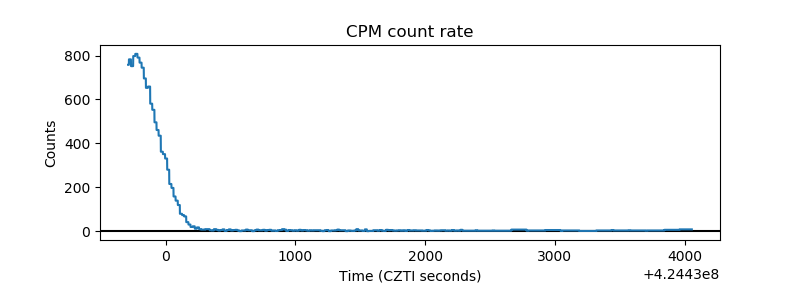 |
| CZT Counter | 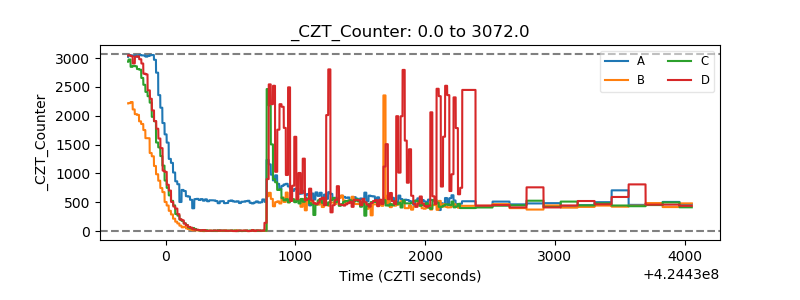 |
| +2.5 Volts monitor | 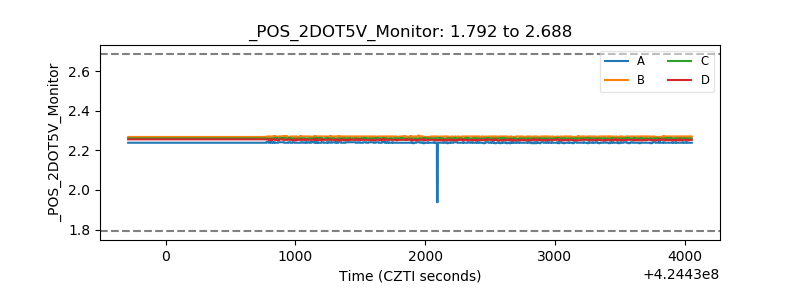 |
| +5 Volts monitor | 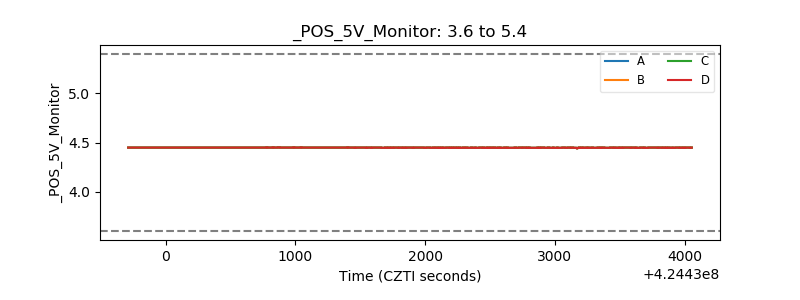 |
| _ROLL_ROT | 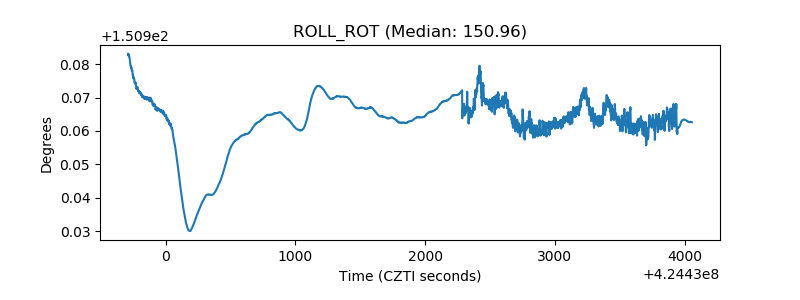 |
| _Roll_DEC | 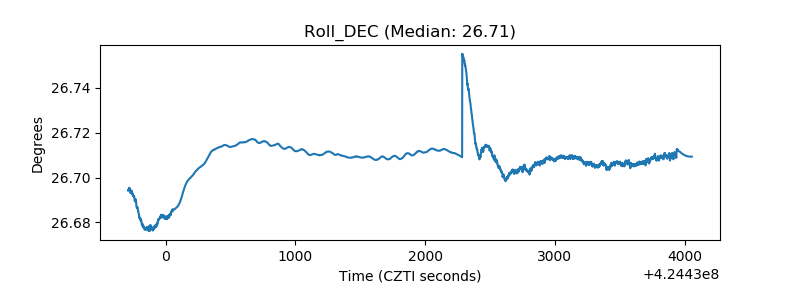 |
| _Roll_RA | 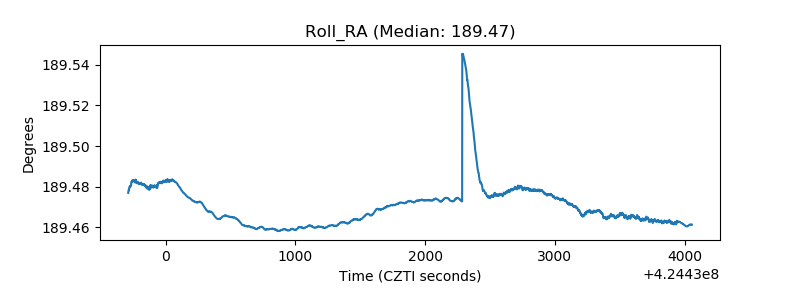 |
| Veto Counter | 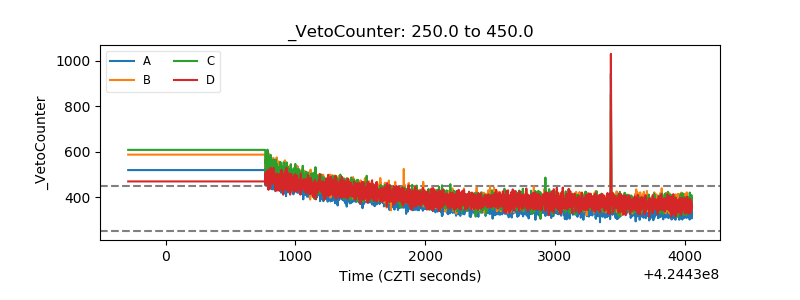 |