| Param | Original file | Final file |
|---|---|---|
| Filename | modeM0/AS1T05_110T01_9000005686_41676cztM0_level2.fits | modeM0/AS1T05_110T01_9000005686_41676cztM0_level2_quad_clean.evt |
| Size (bytes) | 340,620,480 | 96,217,920 |
| Size | 324.8 MB | 91.8 MB |
| Events in quadrant A | 3,033,746 | 664,747 |
| Events in quadrant B | 2,651,101 | 674,745 |
| Events in quadrant C | 2,975,996 | 623,212 |
| Events in quadrant D | 3,526,754 | 572,621 |
| Mode SS | |||
|---|---|---|---|
| Quadrant | BADHDUFLAG | Total packets | Discarded packets |
| A | 0 | 110 | 0 |
| B | 0 | 110 | 0 |
| C | 0 | 110 | 0 |
| D | 0 | 110 | 0 |
| Mode M0 | |||
|---|---|---|---|
| Quadrant | BADHDUFLAG | Total packets | Discarded packets |
| A | 0 | 12273 | 2 |
| B | 0 | 11311 | 2 |
| C | 0 | 12121 | 3 |
| D | 0 | 14100 | 2 |
| Mode M9 | |||
|---|---|---|---|
| Quadrant | BADHDUFLAG | Total packets | Discarded packets |
| A | 0 | 20 | 0 |
| B | 0 | 20 | 0 |
| C | 0 | 20 | 0 |
| D | 0 | 20 | 0 |
| Quadrant | Total seconds | Saturated seconds | Saturation percentage |
|---|---|---|---|
| A | 5405 | 15 | 0.277521% |
| B | 5405 | 9 | 0.166512% |
| C | 5405 | 124 | 2.294172% |
| D | 5405 | 238 | 4.403330% |
Noise dominated data is calculated using 1-second bins in cleaned event files. If a bin has >2000 counts, and if more than 50% of those come from <1% of pixels, then it is considered to be noise-dominated and hence unusable.
| Quadrant | # 1 sec bins | Bins with >0 counts | Bins with >2000 counts | High rate bins dominated by noise | Noise dominated (total time) | Noise dominated (detector-on time) | Marked lightcurve |
|---|---|---|---|---|---|---|---|
| A | 7379 | 5406 | 2 | 2 | 0.03% | 0.04% | 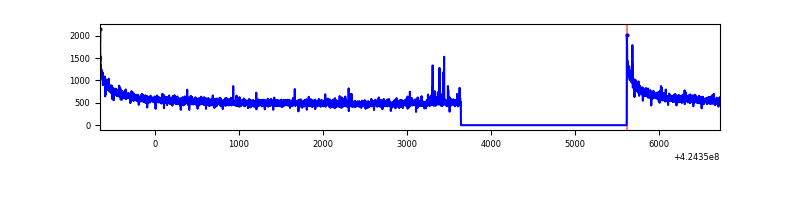 |
| B | 7379 | 5406 | 3 | 3 | 0.04% | 0.06% | 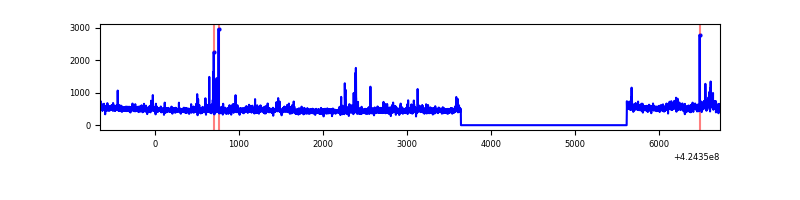 |
| C | 7379 | 5406 | 112 | 112 | 1.52% | 2.07% | 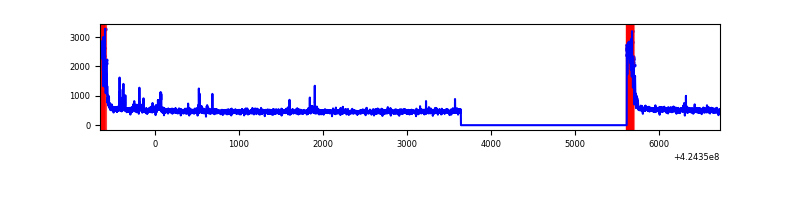 |
| D | 7379 | 5406 | 219 | 219 | 2.97% | 4.05% | 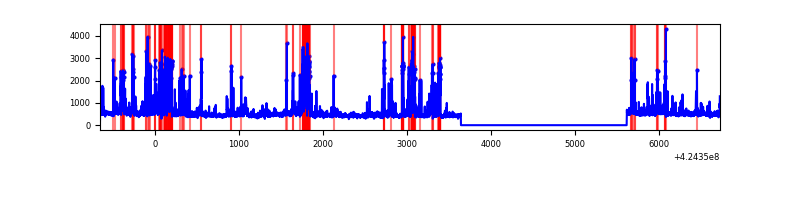 |
Top three noisy pixels from each quadrant. If the there are fewer than three noisy pixels in the level2.evt file, extra rows are filled as -1
| Pixel properties | Quadrant properties | ||||||
|---|---|---|---|---|---|---|---|
| Quadrant | DetID | PixID | Counts | Sigma | Mean | Median | Sigma |
| A | 10 | 83 | 560721 | 4347.25 | 631 | 618 | 128.8 |
| A | 13 | 248 | 23666 | 178.89 | 631 | 618 | 128.8 |
| A | 2 | 79 | 7693 | 54.91 | 631 | 618 | 128.8 |
| B | 0 | 186 | 74220 | 626.36 | 620 | 604 | 117.5 |
| B | 0 | 190 | 43067 | 361.29 | 620 | 604 | 117.5 |
| B | 0 | 245 | 39909 | 334.42 | 620 | 604 | 117.5 |
| C | 0 | 10 | 350492 | 2525.27 | 603 | 608 | 138.6 |
| C | 15 | 214 | 220047 | 1583.79 | 603 | 608 | 138.6 |
| C | 12 | 249 | 33227 | 235.43 | 603 | 608 | 138.6 |
| D | 13 | 249 | 577272 | 3926.48 | 603 | 585 | 146.9 |
| D | 2 | 249 | 455347 | 3096.33 | 603 | 585 | 146.9 |
| D | 12 | 6 | 62138 | 419.09 | 603 | 585 | 146.9 |
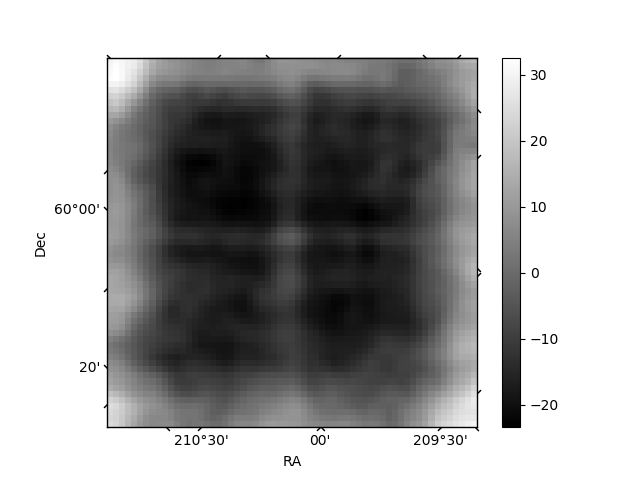
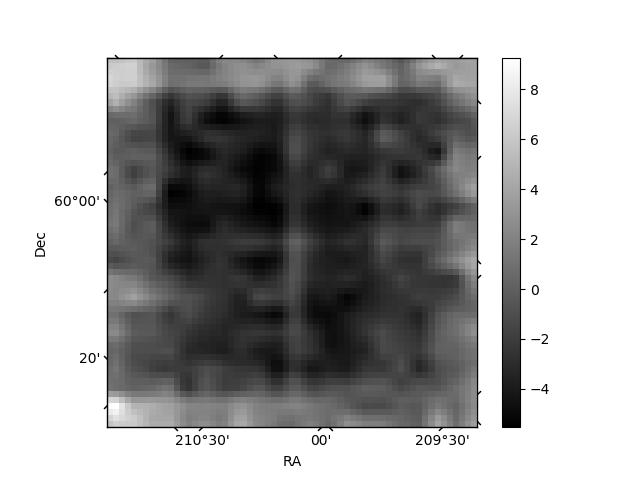
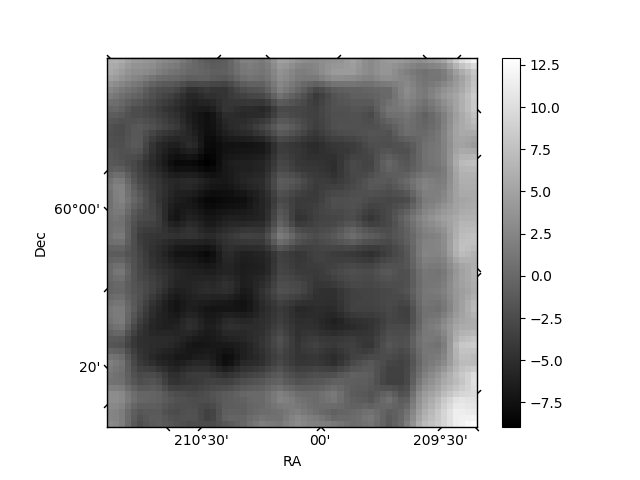
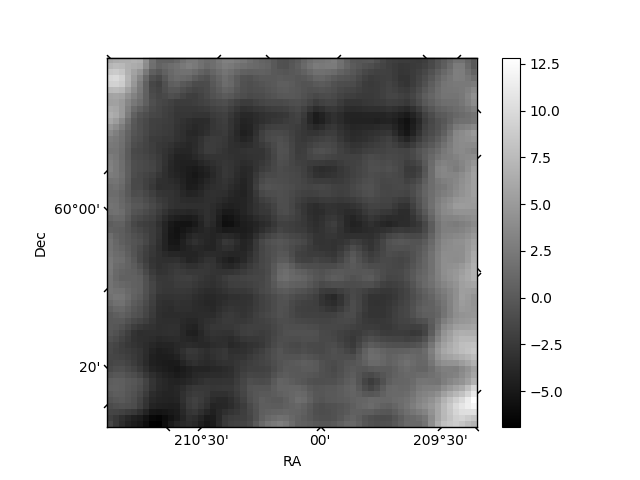
Histogram calculated using DETX and DETY for each event in the final _common_clean file
| Quadrant A | 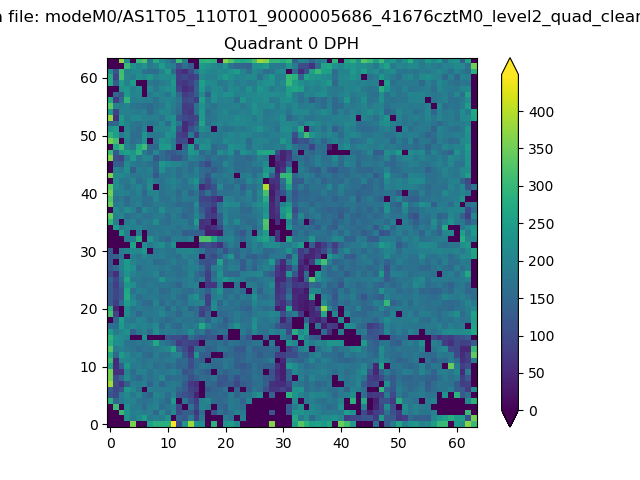 |
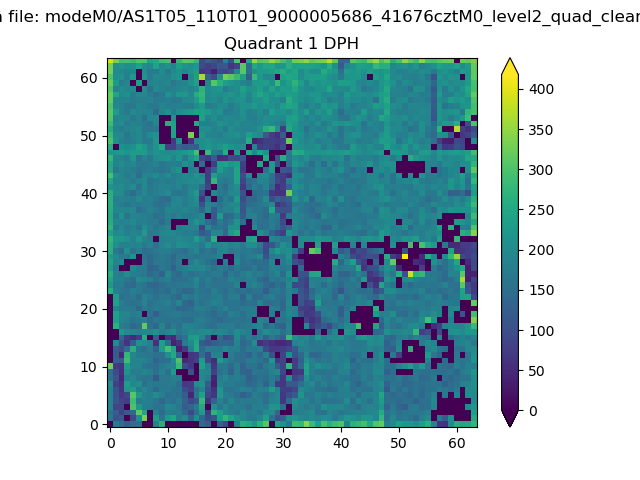 |
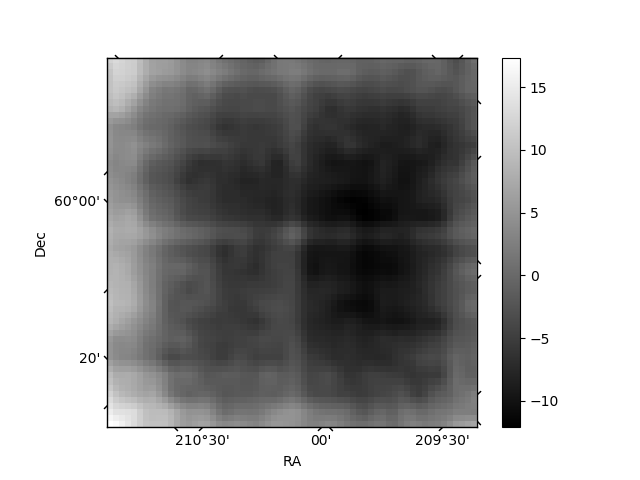
Quadrant B |
|---|---|---|---|
| Quadrant D | 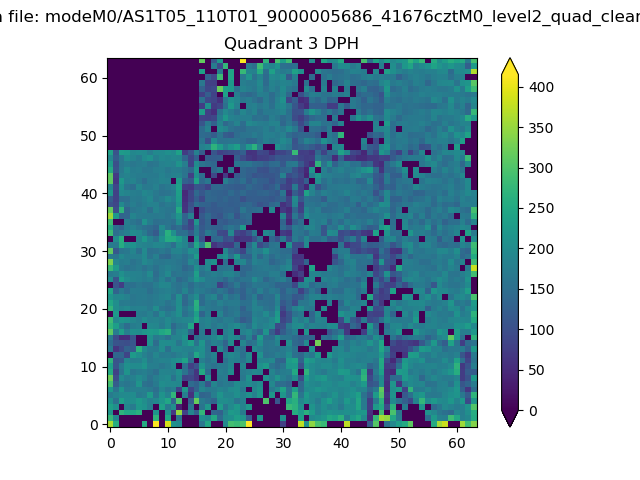 |
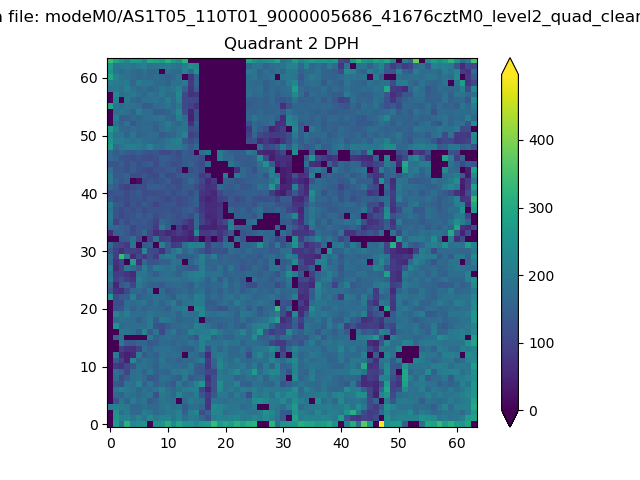 |
Quadrant C |
| Plot type | Count rate plots | Images |
|---|---|---|
| Comparison with Poisson distribution Blue bars denote a histogram of data divided into 1 sec bins. Red curve is a Poisson curve with rate = median count rate of data. |
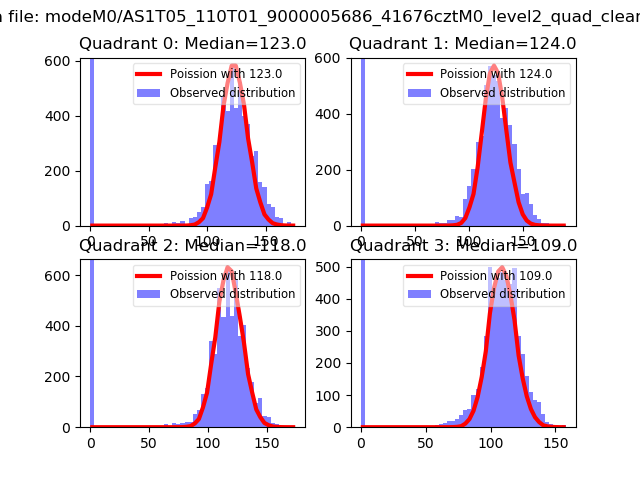 |
 |
| Quadrant-wise count rates Data is divided into 100 sec bins |
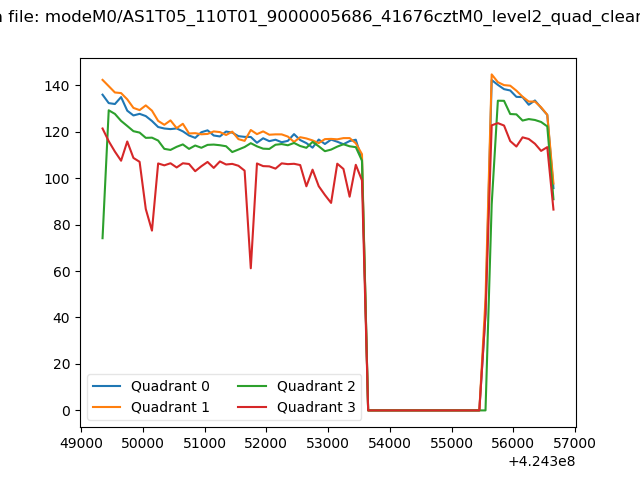 |
|
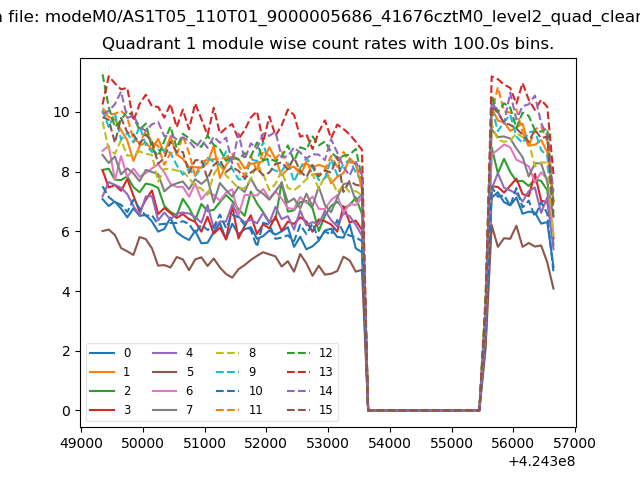
| Module-wise count rates for Quadrant A Data is divided into 100 sec bins |
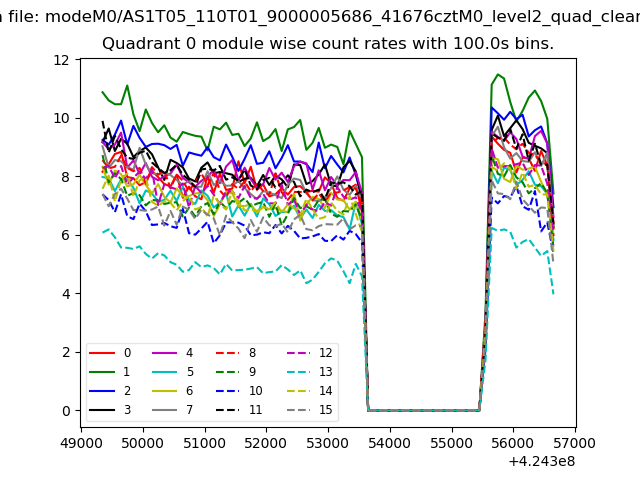 |
 |
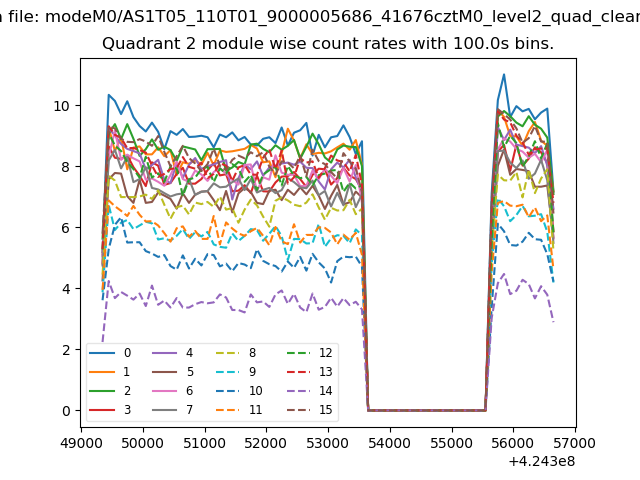
| Module-wise count rates for Quadrant B Data is divided into 100 sec bins |
 |
 |
| Module-wise count rates for Quadrant C Data is divided into 100 sec bins |
 |
 |
| Module-wise count rates for Quadrant D Data is divided into 100 sec bins |
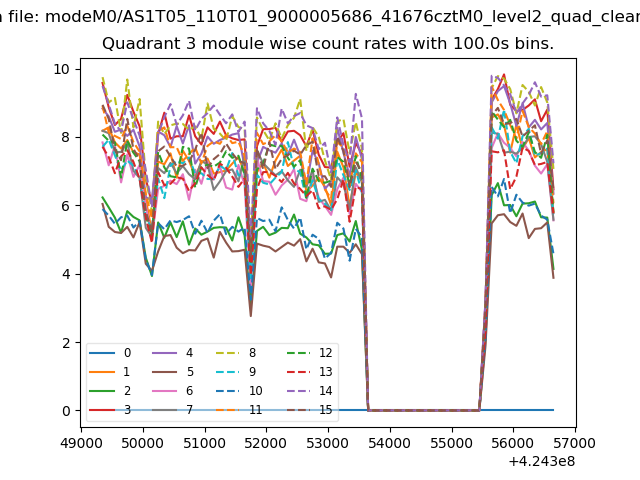 |
 |
| Parameter | Plot |
|---|---|
| CZT HV Monitor | 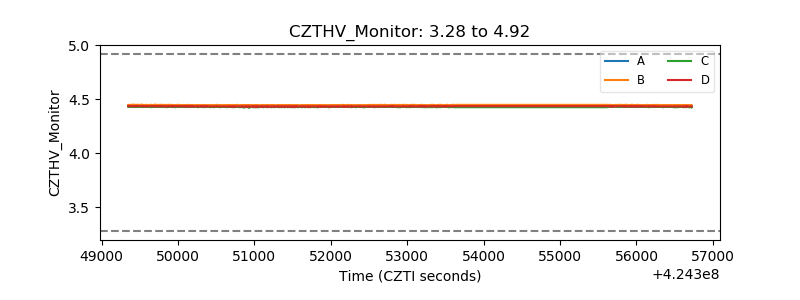 |
| D_VDD | 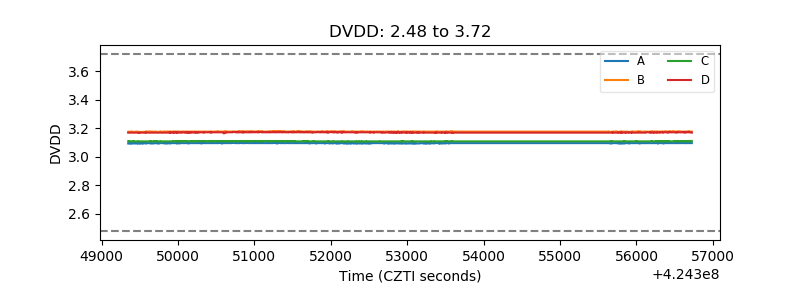 |
| Temperature 1 | 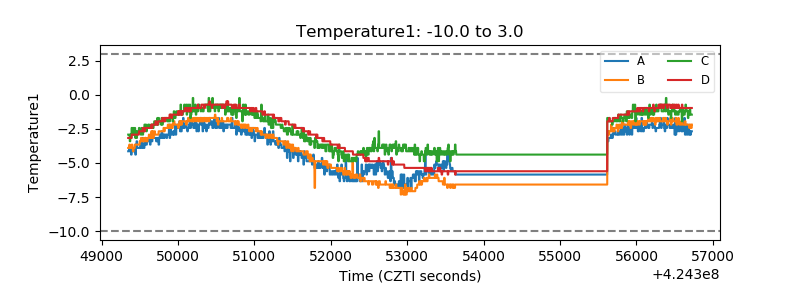 |
| Veto HV Monitor | 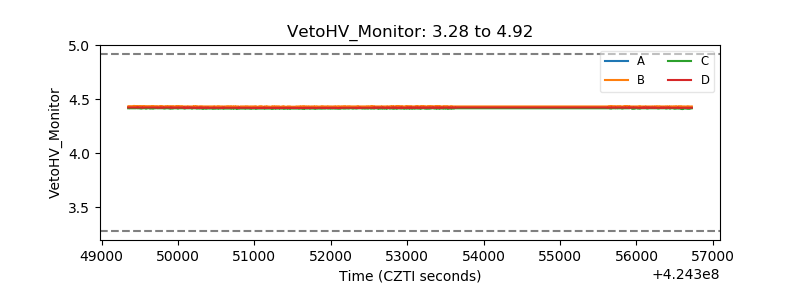 |
| Veto LLD | 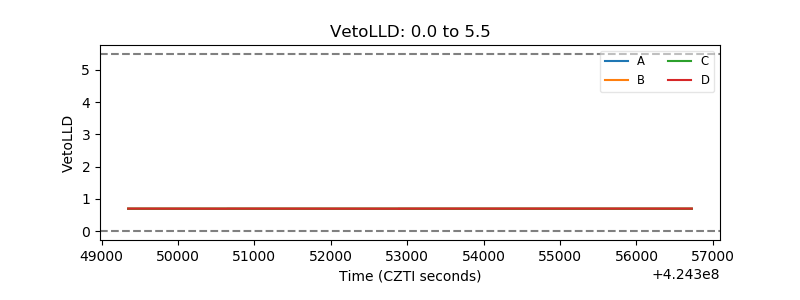 |
| Alpha Counter | 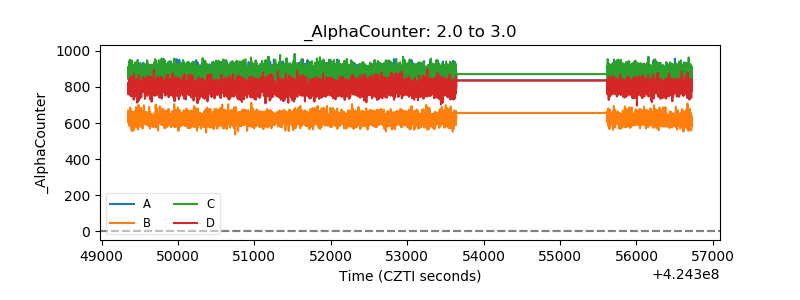 |
| _CPM_Rate | 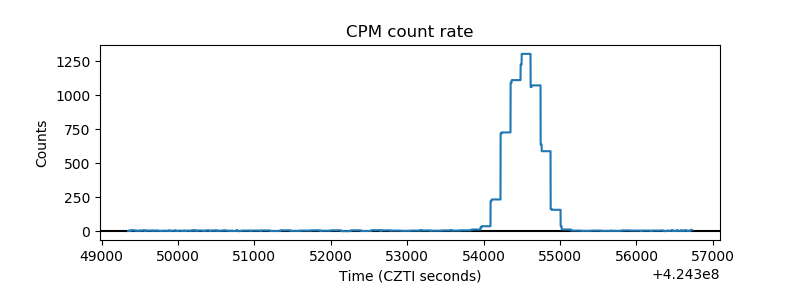 |
| CZT Counter | 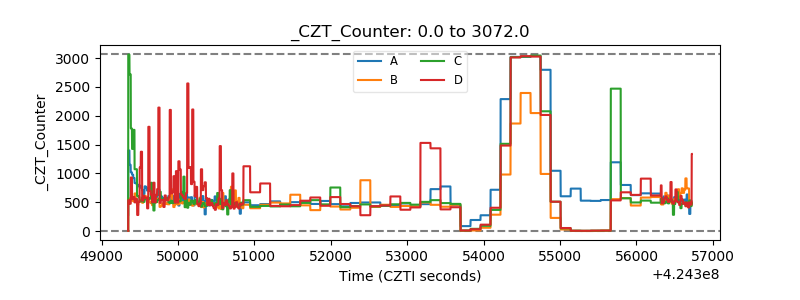 |
| +2.5 Volts monitor | 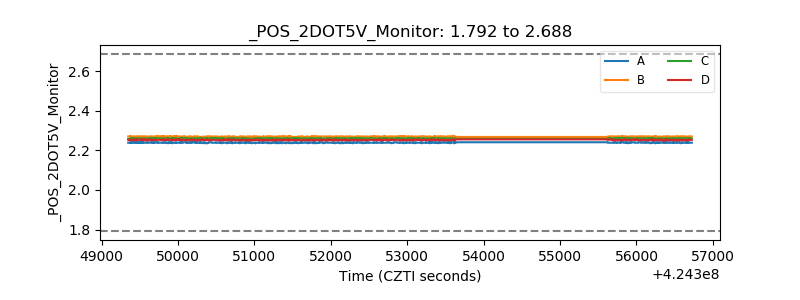 |
| +5 Volts monitor | 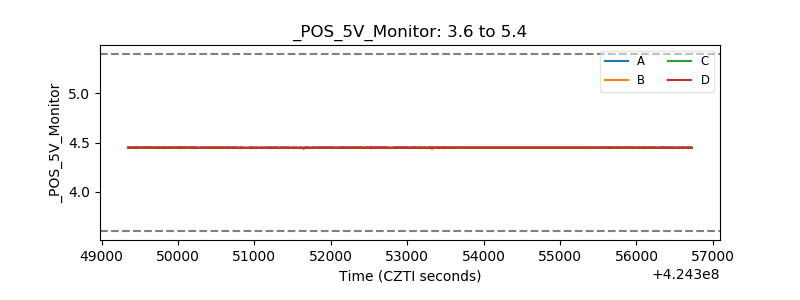 |
| _ROLL_ROT | 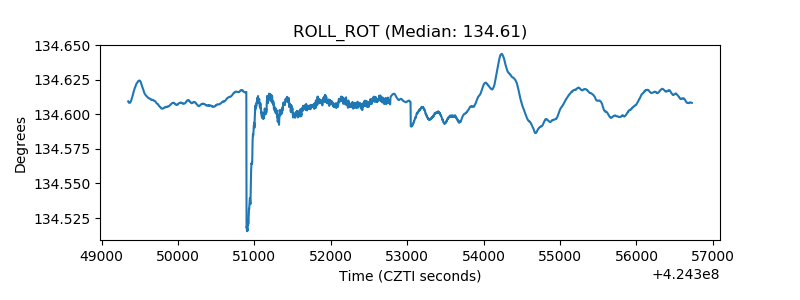 |
| _Roll_DEC | 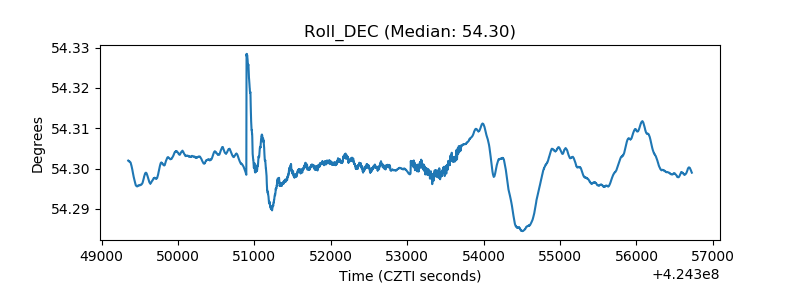 |
| _Roll_RA | 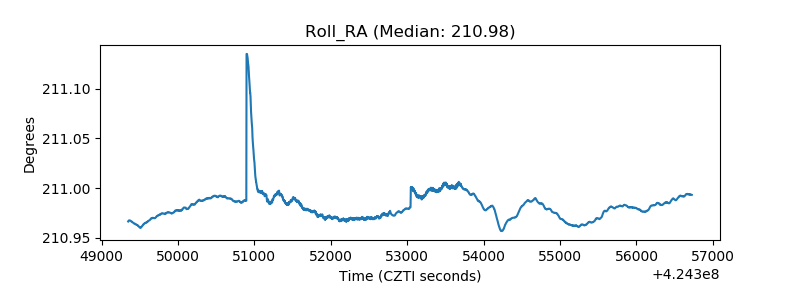 |
| Veto Counter | 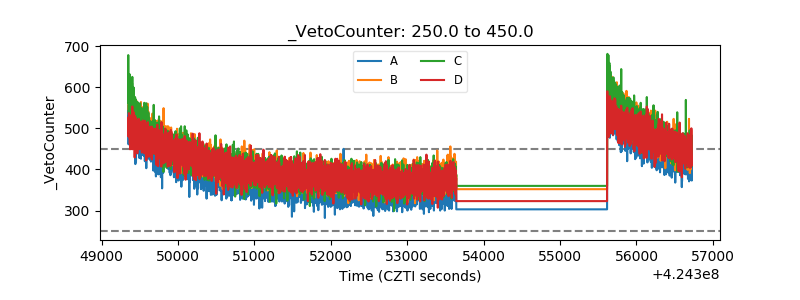 |