| Param | Original file | Final file |
|---|---|---|
| Filename | modeM0/AS1T05_110T01_9000005686_41677cztM0_level2.fits | modeM0/AS1T05_110T01_9000005686_41677cztM0_level2_quad_clean.evt |
| Size (bytes) | 319,798,080 | 92,162,880 |
| Size | 305.0 MB | 87.9 MB |
| Events in quadrant A | 2,832,107 | 635,484 |
| Events in quadrant B | 2,575,453 | 640,448 |
| Events in quadrant C | 2,598,264 | 610,882 |
| Events in quadrant D | 3,437,710 | 549,172 |
| Mode SS | |||
|---|---|---|---|
| Quadrant | BADHDUFLAG | Total packets | Discarded packets |
| A | 0 | 104 | 0 |
| B | 0 | 104 | 0 |
| C | 0 | 104 | 0 |
| D | 0 | 104 | 0 |
| Mode M0 | |||
|---|---|---|---|
| Quadrant | BADHDUFLAG | Total packets | Discarded packets |
| A | 0 | 11512 | 2 |
| B | 0 | 10903 | 2 |
| C | 0 | 10691 | 2 |
| D | 0 | 13594 | 2 |
| Mode M9 | |||
|---|---|---|---|
| Quadrant | BADHDUFLAG | Total packets | Discarded packets |
| A | 0 | 21 | 0 |
| B | 0 | 21 | 0 |
| C | 0 | 21 | 0 |
| D | 0 | 21 | 0 |
| Quadrant | Total seconds | Saturated seconds | Saturation percentage |
|---|---|---|---|
| A | 5061 | 10 | 0.197589% |
| B | 5062 | 28 | 0.553141% |
| C | 5062 | 42 | 0.829712% |
| D | 5062 | 249 | 4.919004% |
Noise dominated data is calculated using 1-second bins in cleaned event files. If a bin has >2000 counts, and if more than 50% of those come from <1% of pixels, then it is considered to be noise-dominated and hence unusable.
| Quadrant | # 1 sec bins | Bins with >0 counts | Bins with >2000 counts | High rate bins dominated by noise | Noise dominated (total time) | Noise dominated (detector-on time) | Marked lightcurve |
|---|---|---|---|---|---|---|---|
| A | 7123 | 5062 | 4 | 4 | 0.06% | 0.08% | 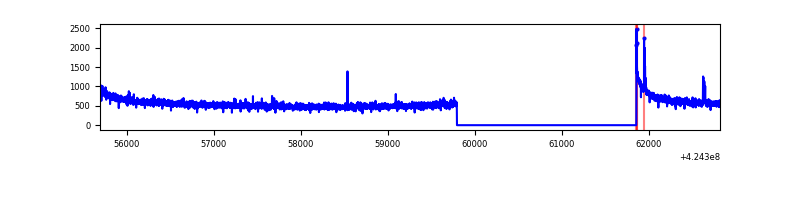 |
| B | 7124 | 5063 | 18 | 18 | 0.25% | 0.36% | 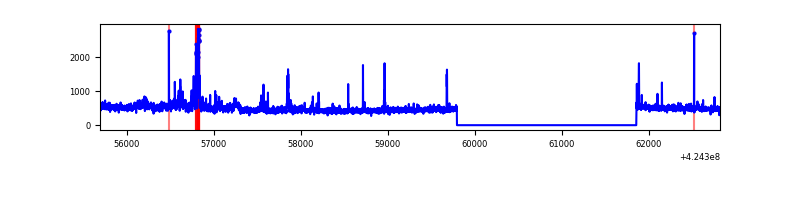 |
| C | 7124 | 5063 | 34 | 34 | 0.48% | 0.67% | 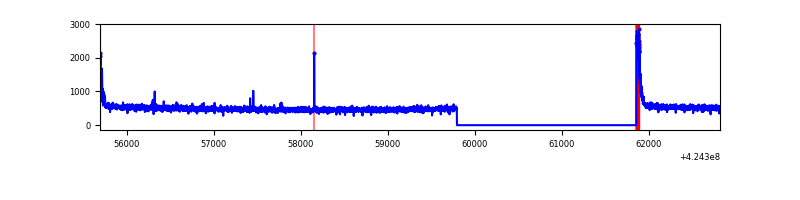 |
| D | 7124 | 5063 | 236 | 236 | 3.31% | 4.66% | 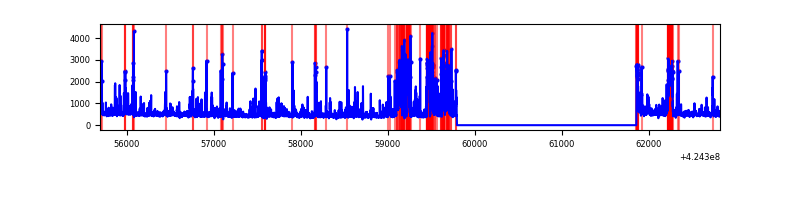 |
Top three noisy pixels from each quadrant. If the there are fewer than three noisy pixels in the level2.evt file, extra rows are filled as -1
| Pixel properties | Quadrant properties | ||||||
|---|---|---|---|---|---|---|---|
| Quadrant | DetID | PixID | Counts | Sigma | Mean | Median | Sigma |
| A | 10 | 83 | 500986 | 4191.05 | 590 | 579 | 119.4 |
| A | 13 | 248 | 15803 | 127.51 | 590 | 579 | 119.4 |
| A | 15 | 223 | 15028 | 121.01 | 590 | 579 | 119.4 |
| B | 0 | 186 | 171216 | 1537.48 | 582 | 566 | 111.0 |
| B | 0 | 190 | 73845 | 660.21 | 582 | 566 | 111.0 |
| B | 5 | 255 | 34920 | 309.51 | 582 | 566 | 111.0 |
| C | 15 | 214 | 205921 | 1540.3 | 576 | 579 | 133.3 |
| C | 0 | 10 | 136189 | 1017.23 | 576 | 579 | 133.3 |
| C | 15 | 111 | 7883 | 54.79 | 576 | 579 | 133.3 |
| D | 13 | 249 | 614314 | 4438.88 | 570 | 555 | 138.3 |
| D | 2 | 249 | 454280 | 3281.47 | 570 | 555 | 138.3 |
| D | 3 | 14 | 41544 | 296.44 | 570 | 555 | 138.3 |
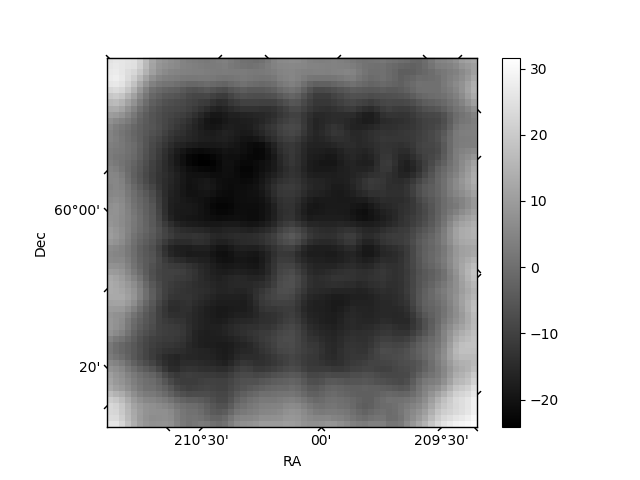
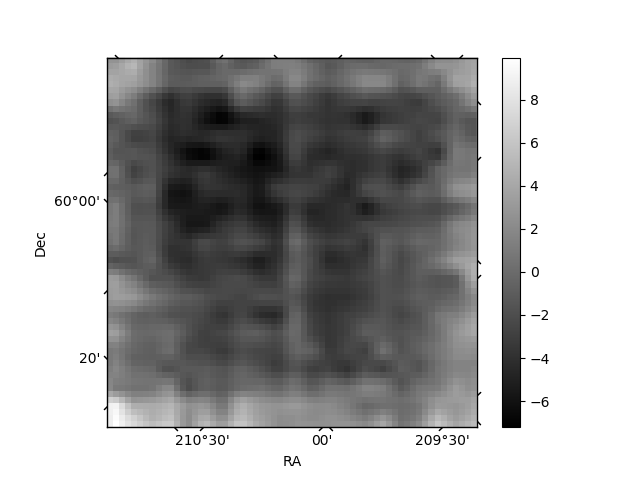
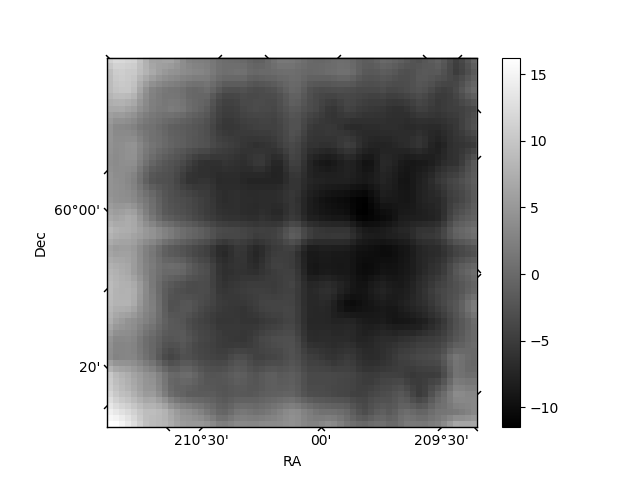
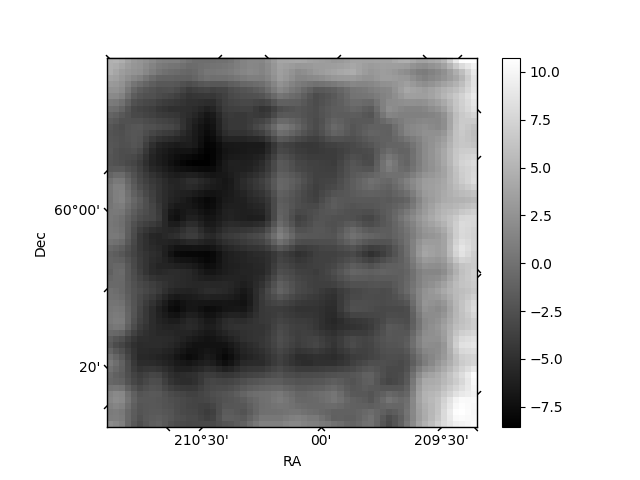
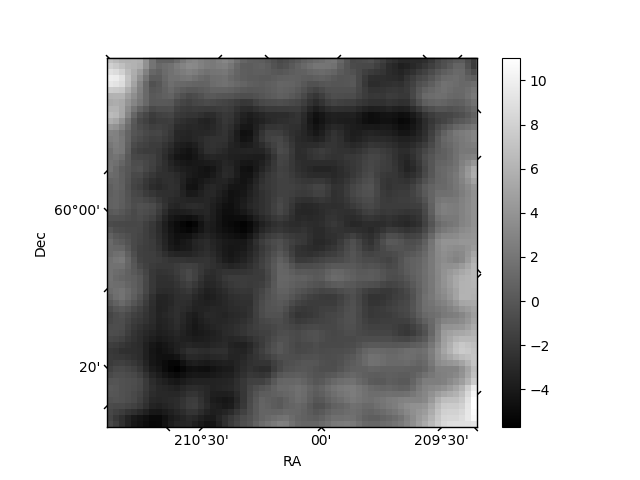
Histogram calculated using DETX and DETY for each event in the final _common_clean file
| Quadrant A | 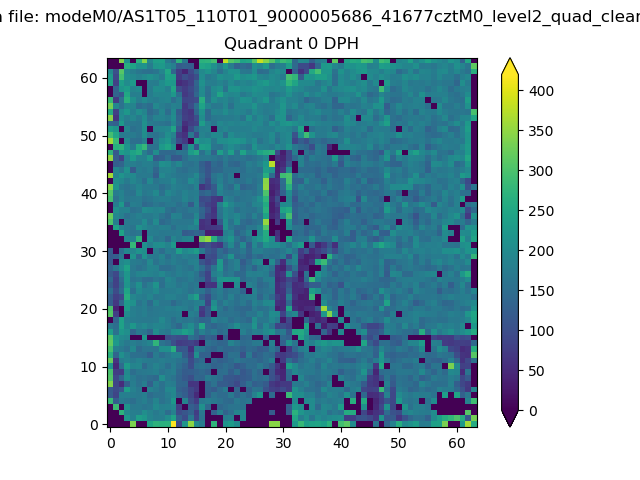 |
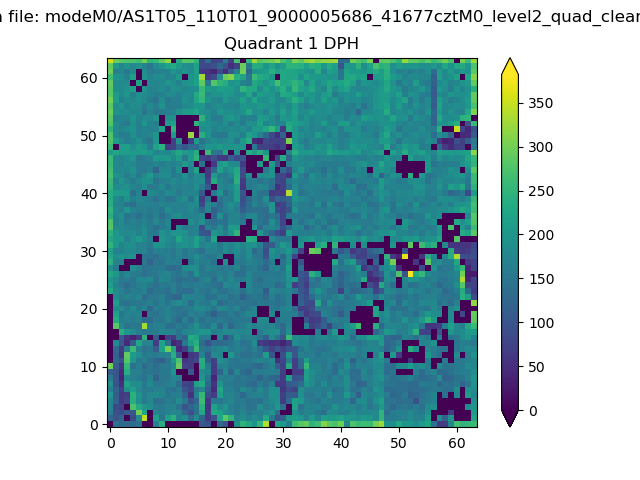 |
Quadrant B |
|---|---|---|---|
| Quadrant D | 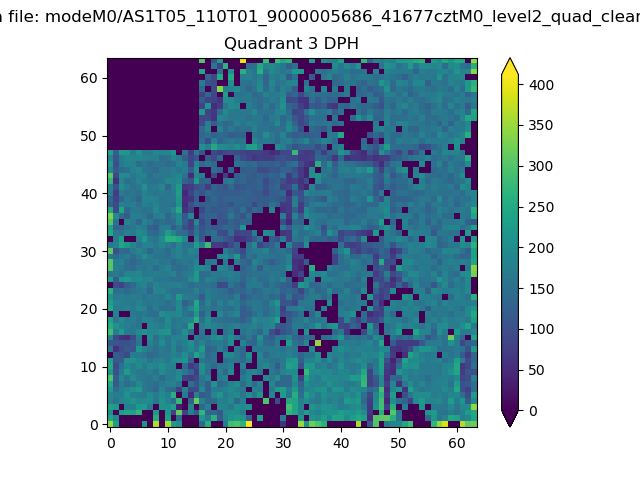 |
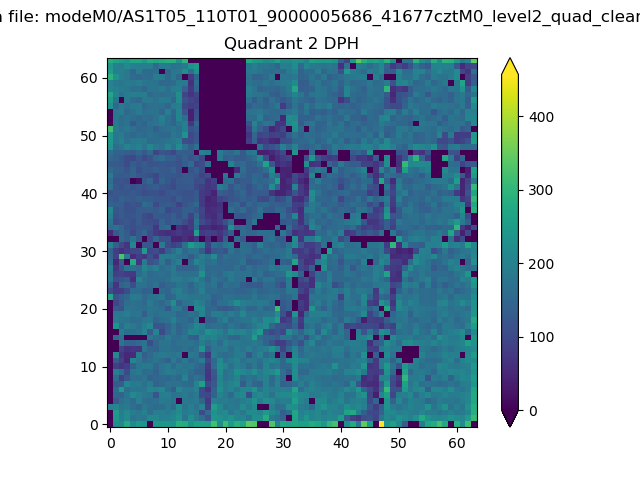 |
Quadrant C |
| Plot type | Count rate plots | Images |
|---|---|---|
| Comparison with Poisson distribution Blue bars denote a histogram of data divided into 1 sec bins. Red curve is a Poisson curve with rate = median count rate of data. |
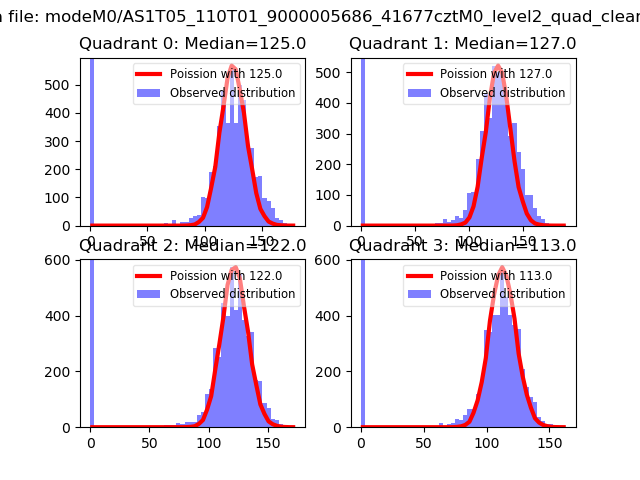 |
 |
| Quadrant-wise count rates Data is divided into 100 sec bins |
 |
|
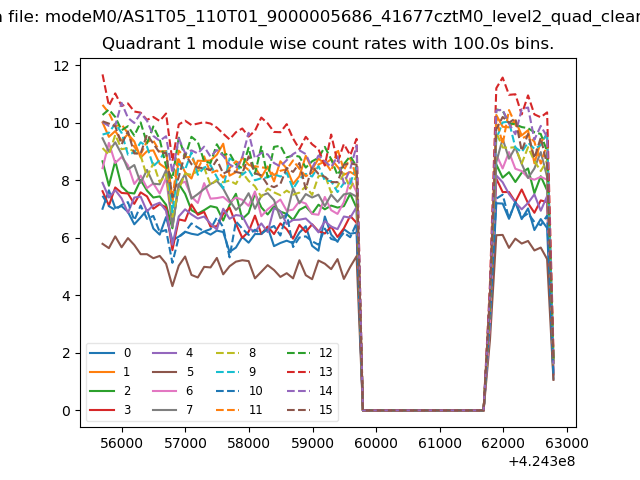
| Module-wise count rates for Quadrant A Data is divided into 100 sec bins |
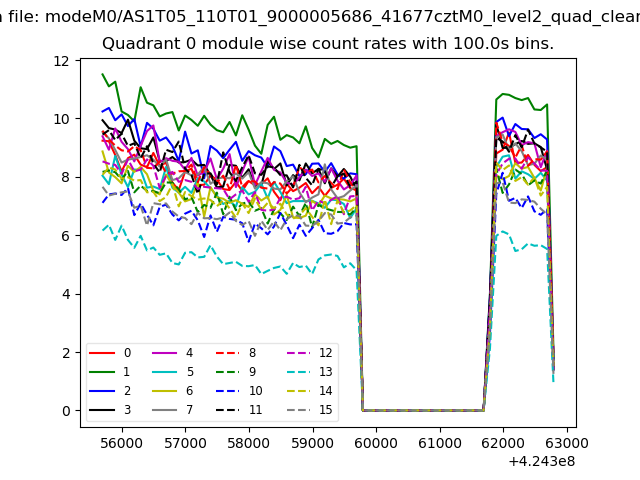 |
 |
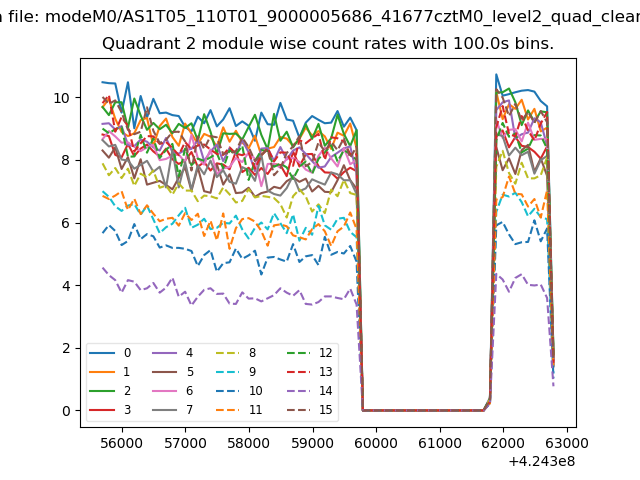
| Module-wise count rates for Quadrant B Data is divided into 100 sec bins |
 |
 |
| Module-wise count rates for Quadrant C Data is divided into 100 sec bins |
 |
 |
| Module-wise count rates for Quadrant D Data is divided into 100 sec bins |
 |
 |
| Parameter | Plot |
|---|---|
| CZT HV Monitor | 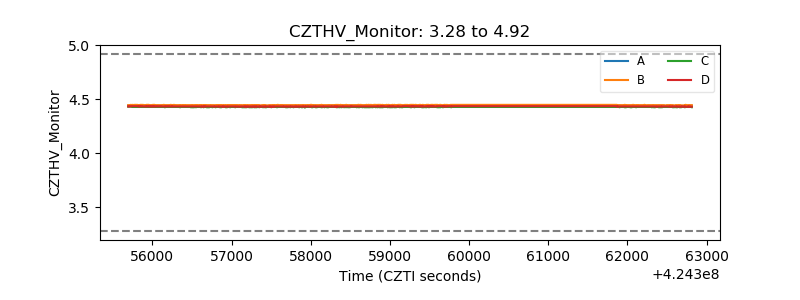 |
| D_VDD | 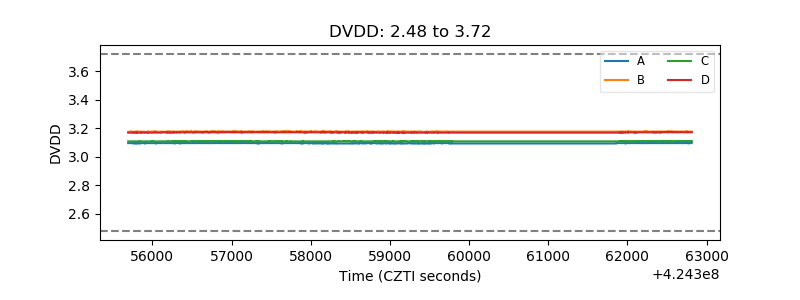 |
| Temperature 1 | 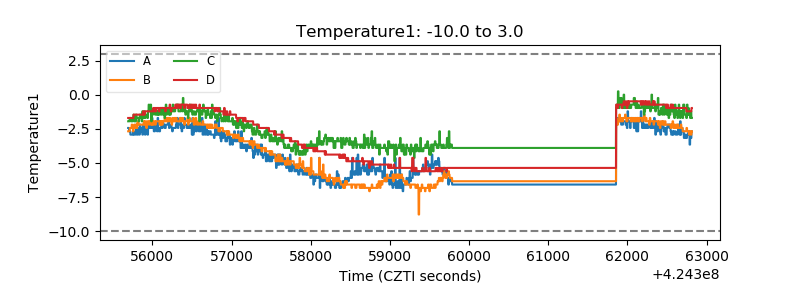 |
| Veto HV Monitor | 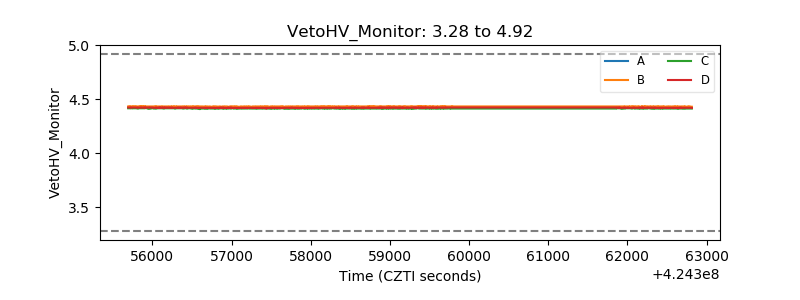 |
| Veto LLD | 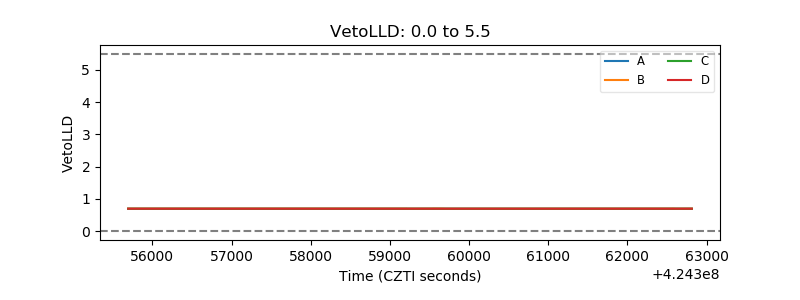 |
| Alpha Counter |  |
| _CPM_Rate |  |
| CZT Counter | 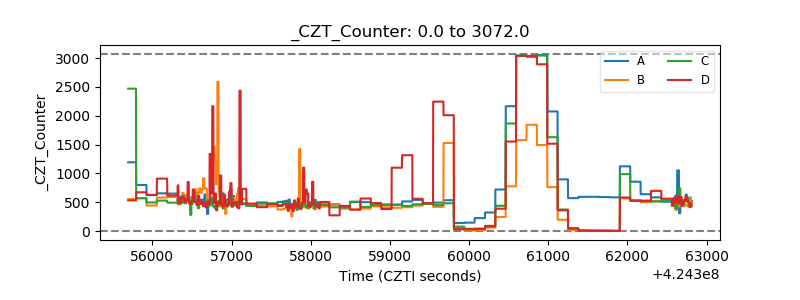 |
| +2.5 Volts monitor | 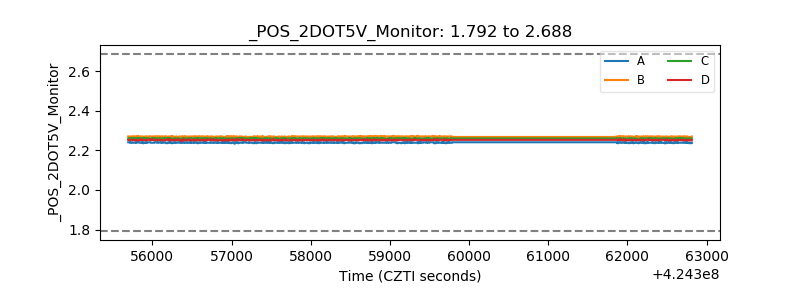 |
| +5 Volts monitor | 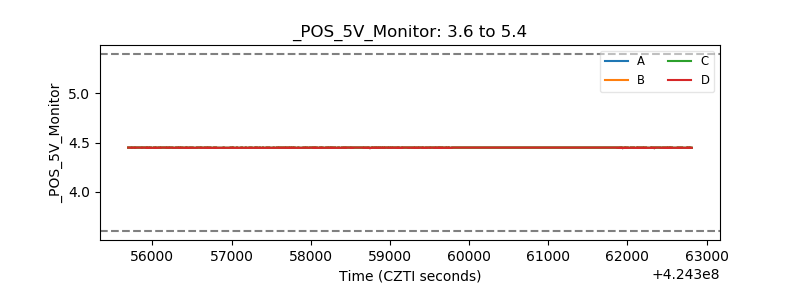 |
| _ROLL_ROT | 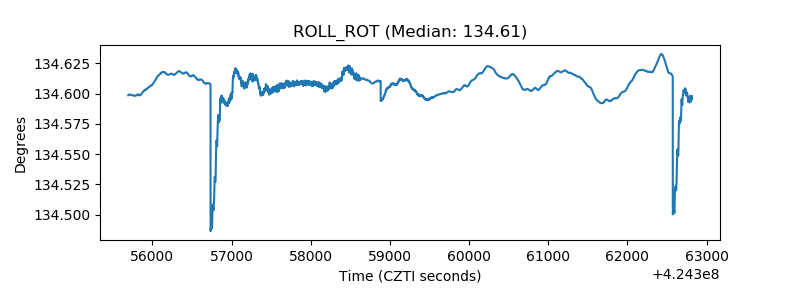 |
| _Roll_DEC | 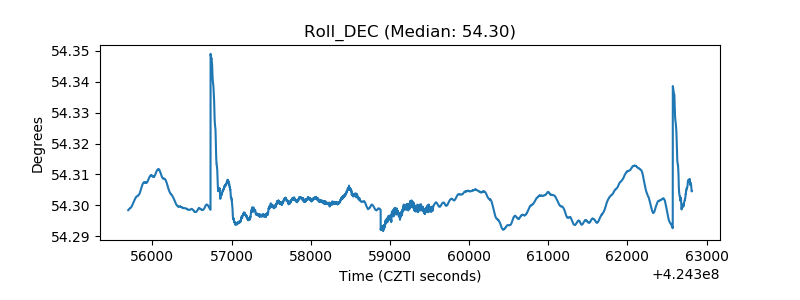 |
| _Roll_RA | 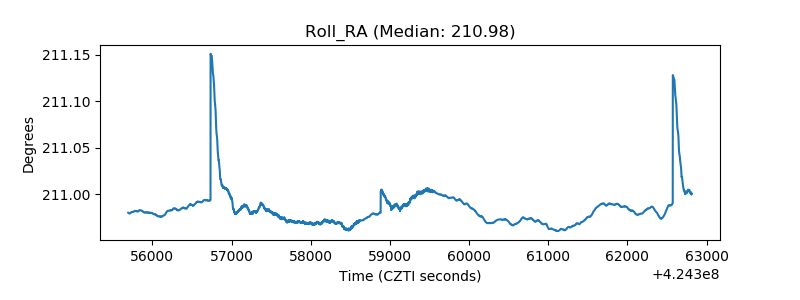 |
| Veto Counter |  |