| Param | Original file | Final file |
|---|---|---|
| Filename | modeM0/AS1T05_110T01_9000005686_41679cztM0_level2.fits | modeM0/AS1T05_110T01_9000005686_41679cztM0_level2_quad_clean.evt |
| Size (bytes) | 84,021,120 | 25,211,520 |
| Size | 80.1 MB | 24.0 MB |
| Events in quadrant A | 847,169 | 171,246 |
| Events in quadrant B | 650,020 | 173,723 |
| Events in quadrant C | 799,462 | 161,259 |
| Events in quadrant D | 703,551 | 155,122 |
| Mode SS | |||
|---|---|---|---|
| Quadrant | BADHDUFLAG | Total packets | Discarded packets |
| A | 0 | 26 | 0 |
| B | 0 | 26 | 0 |
| C | 0 | 26 | 0 |
| D | 0 | 26 | 0 |
| Mode M0 | |||
|---|---|---|---|
| Quadrant | BADHDUFLAG | Total packets | Discarded packets |
| A | 0 | 3369 | 1 |
| B | 0 | 2799 | 1 |
| C | 0 | 3174 | 1 |
| D | 0 | 2970 | 1 |
| Mode M9 | |||
|---|---|---|---|
| Quadrant | BADHDUFLAG | Total packets | Discarded packets |
| A | 0 | 8 | 0 |
| B | 0 | 9 | 0 |
| C | 0 | 9 | 0 |
| D | 0 | 9 | 0 |
| Quadrant | Total seconds | Saturated seconds | Saturation percentage |
|---|---|---|---|
| A | 1376 | 10 | 0.726744% |
| B | 1376 | 4 | 0.290698% |
| C | 1376 | 46 | 3.343023% |
| D | 1376 | 8 | 0.581395% |
Noise dominated data is calculated using 1-second bins in cleaned event files. If a bin has >2000 counts, and if more than 50% of those come from <1% of pixels, then it is considered to be noise-dominated and hence unusable.
| Quadrant | # 1 sec bins | Bins with >0 counts | Bins with >2000 counts | High rate bins dominated by noise | Noise dominated (total time) | Noise dominated (detector-on time) | Marked lightcurve |
|---|---|---|---|---|---|---|---|
| A | 1376 | 1376 | 4 | 4 | 0.29% | 0.29% | 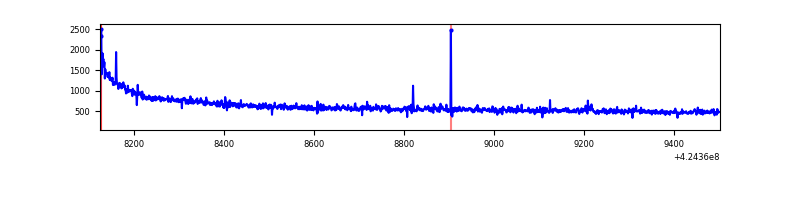 |
| B | 1376 | 1376 | 1 | 1 | 0.07% | 0.07% | 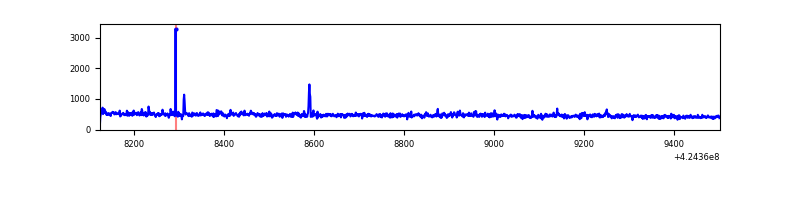 |
| C | 1376 | 1376 | 39 | 39 | 2.83% | 2.83% | 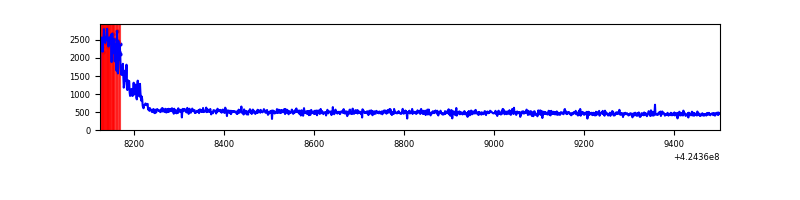 |
| D | 1376 | 1376 | 5 | 5 | 0.36% | 0.36% | 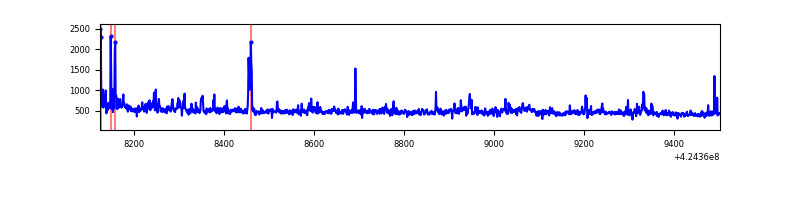 |
Top three noisy pixels from each quadrant. If the there are fewer than three noisy pixels in the level2.evt file, extra rows are filled as -1
| Pixel properties | Quadrant properties | ||||||
|---|---|---|---|---|---|---|---|
| Quadrant | DetID | PixID | Counts | Sigma | Mean | Median | Sigma |
| A | 10 | 83 | 205386 | 5961.58 | 160 | 156 | 34.4 |
| A | 7 | 3 | 13038 | 374.2 | 160 | 156 | 34.4 |
| A | 15 | 223 | 3697 | 102.86 | 160 | 156 | 34.4 |
| B | 5 | 255 | 12033 | 370.14 | 158 | 154 | 32.1 |
| B | 0 | 190 | 6379 | 193.96 | 158 | 154 | 32.1 |
| B | 4 | 141 | 4895 | 147.72 | 158 | 154 | 32.1 |
| C | 0 | 10 | 128095 | 3365.23 | 156 | 156 | 38.0 |
| C | 15 | 214 | 58291 | 1529.15 | 156 | 156 | 38.0 |
| C | 15 | 159 | 1383 | 32.27 | 156 | 156 | 38.0 |
| D | 2 | 249 | 32386 | 800.31 | 160 | 156 | 40.3 |
| D | 13 | 249 | 18132 | 446.37 | 160 | 156 | 40.3 |
| D | 12 | 233 | 15947 | 392.11 | 160 | 156 | 40.3 |
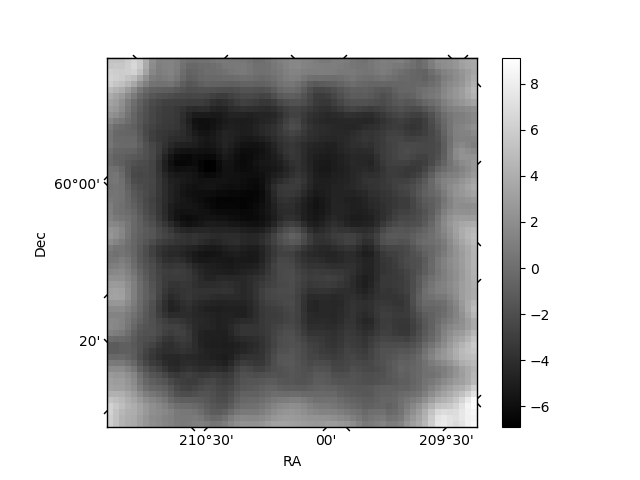
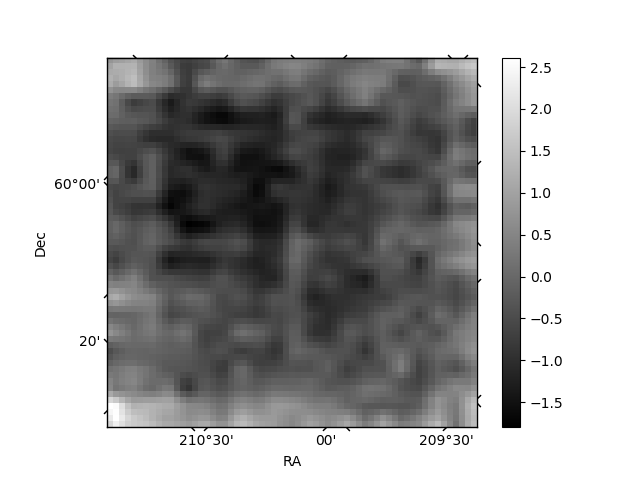
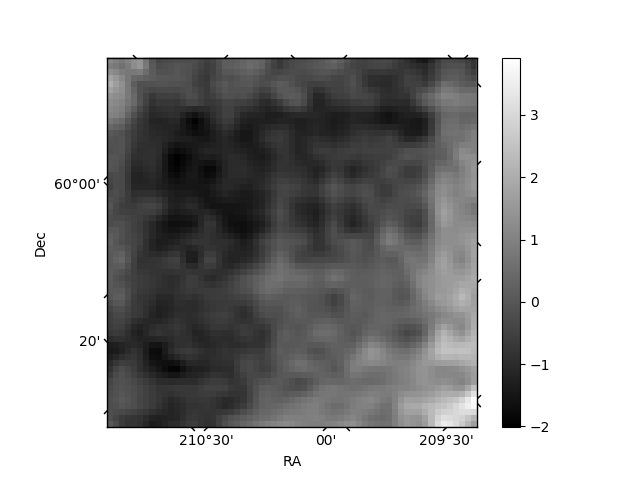
Histogram calculated using DETX and DETY for each event in the final _common_clean file
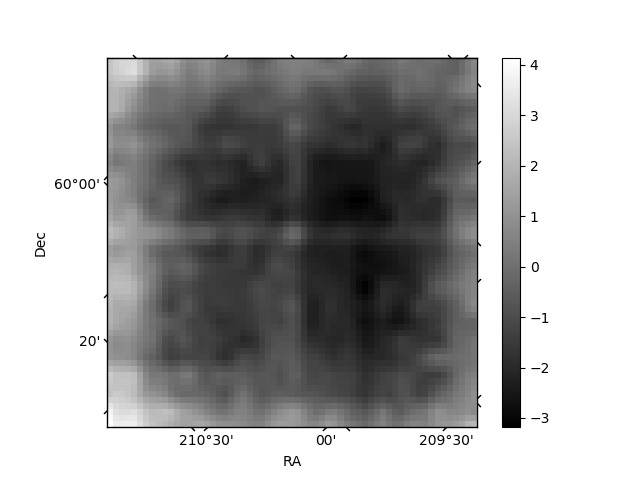
| Quadrant A | 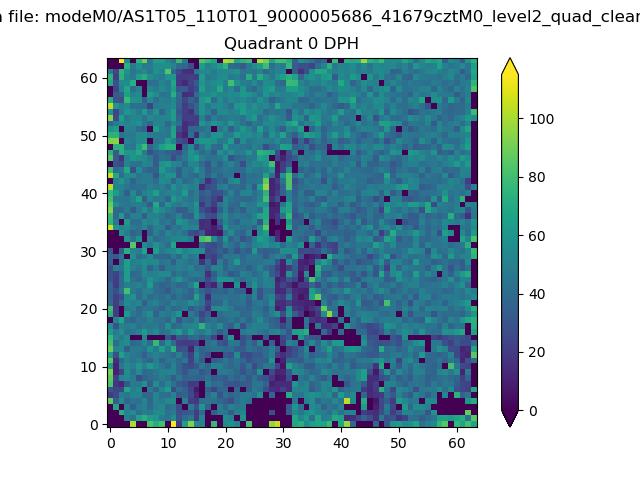 |
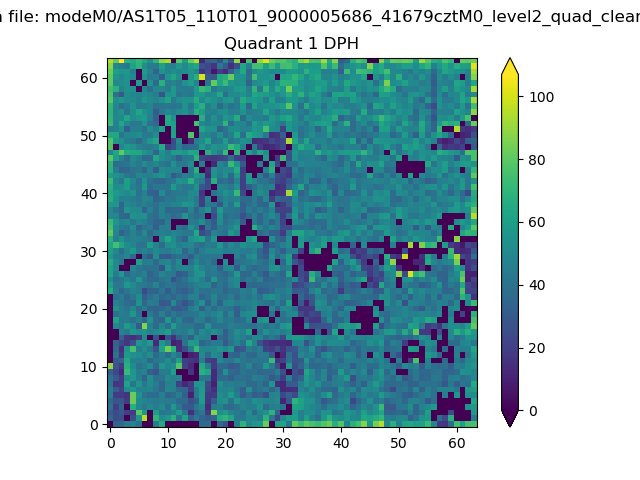 |
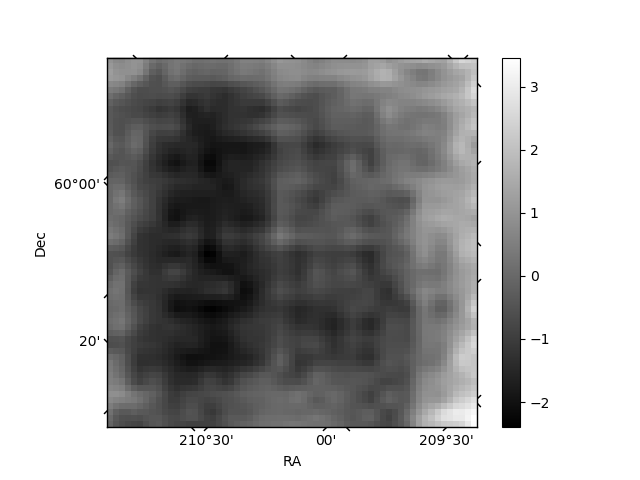
Quadrant B |
|---|---|---|---|
| Quadrant D | 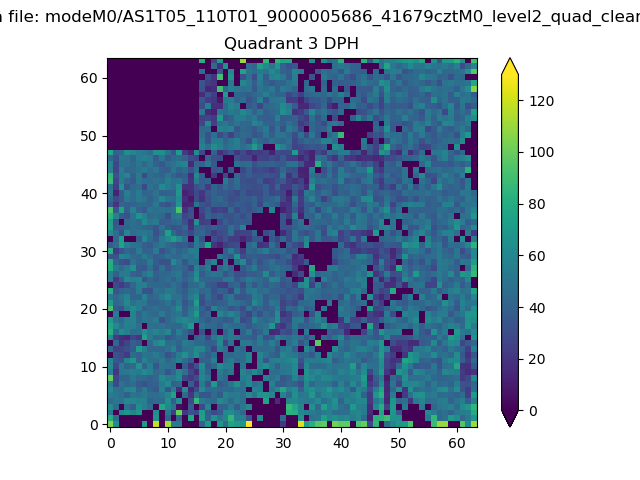 |
 |
Quadrant C |
| Plot type | Count rate plots | Images |
|---|---|---|
| Comparison with Poisson distribution Blue bars denote a histogram of data divided into 1 sec bins. Red curve is a Poisson curve with rate = median count rate of data. |
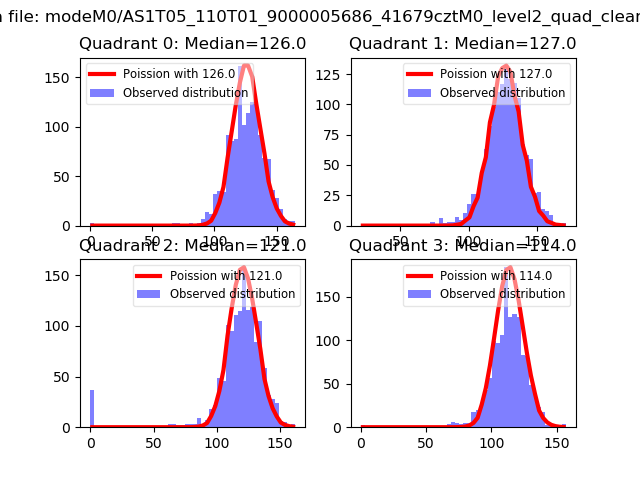 |
 |
| Quadrant-wise count rates Data is divided into 100 sec bins |
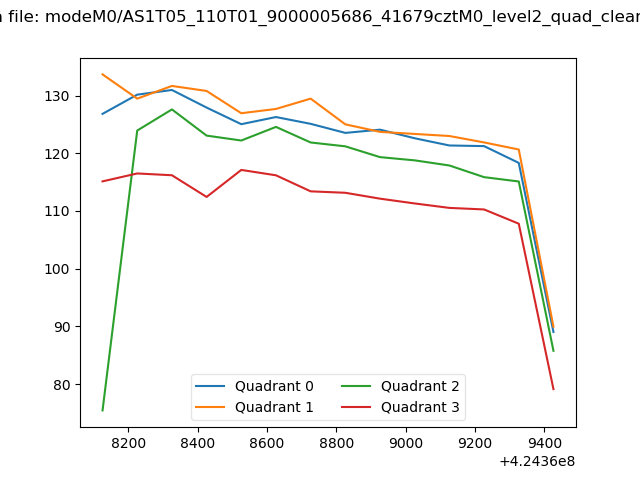 |
|
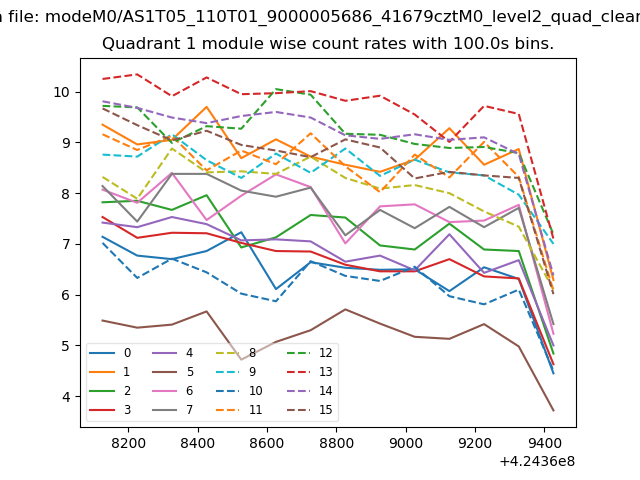
| Module-wise count rates for Quadrant A Data is divided into 100 sec bins |
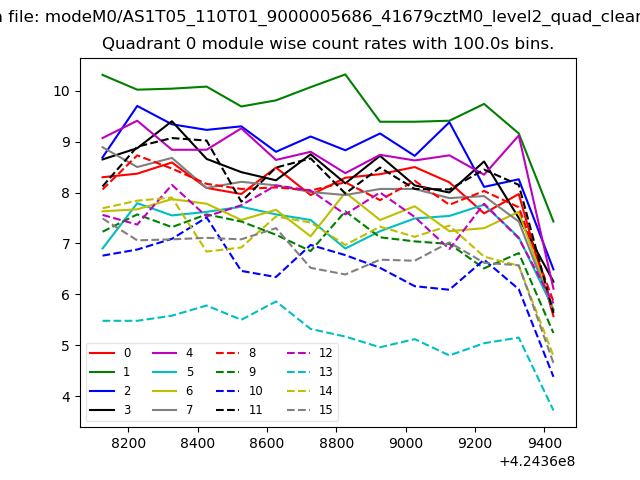 |
 |
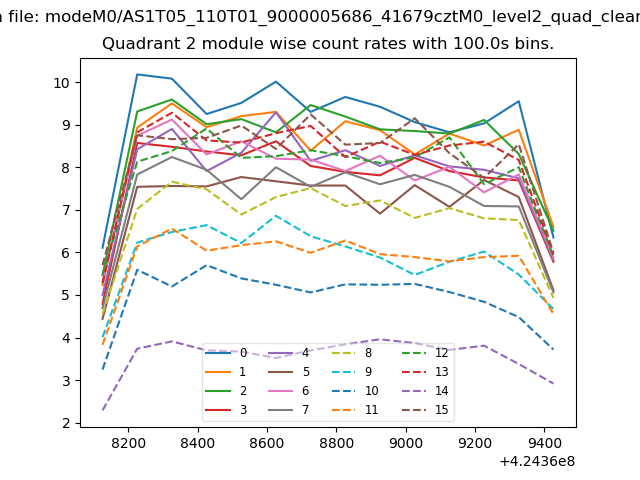
| Module-wise count rates for Quadrant B Data is divided into 100 sec bins |
 |
 |
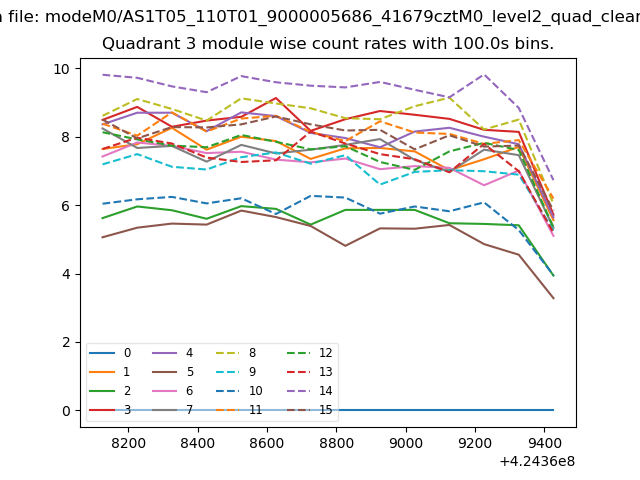
| Module-wise count rates for Quadrant C Data is divided into 100 sec bins |
 |
 |
| Module-wise count rates for Quadrant D Data is divided into 100 sec bins |
 |
 |
| Parameter | Plot |
|---|---|
| CZT HV Monitor | 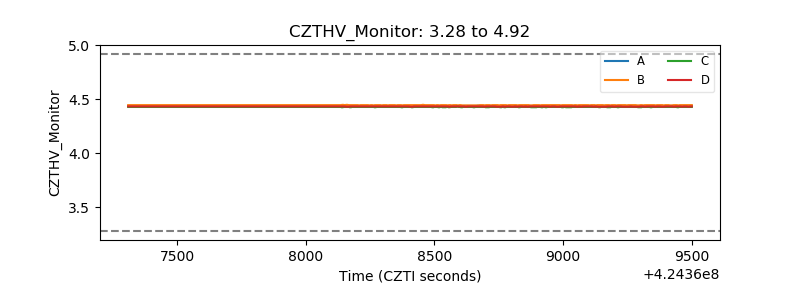 |
| D_VDD | 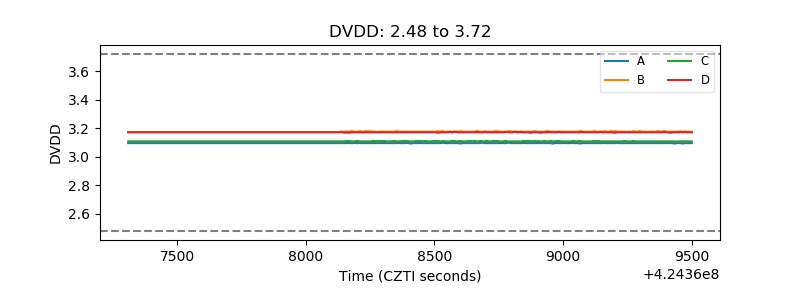 |
| Temperature 1 | 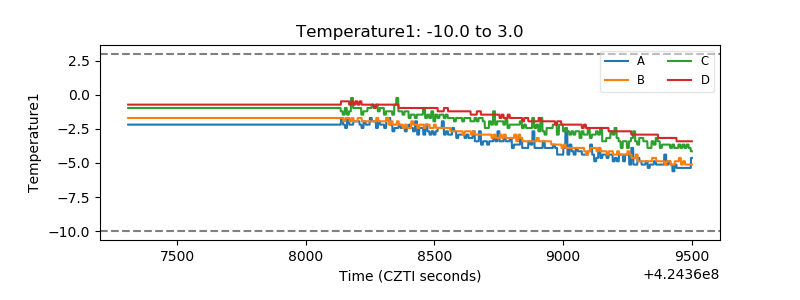 |
| Veto HV Monitor | 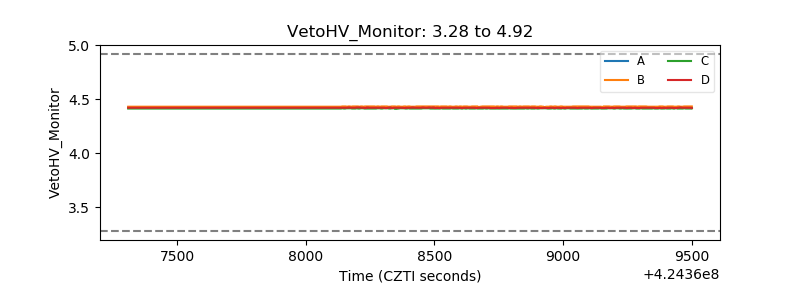 |
| Veto LLD | 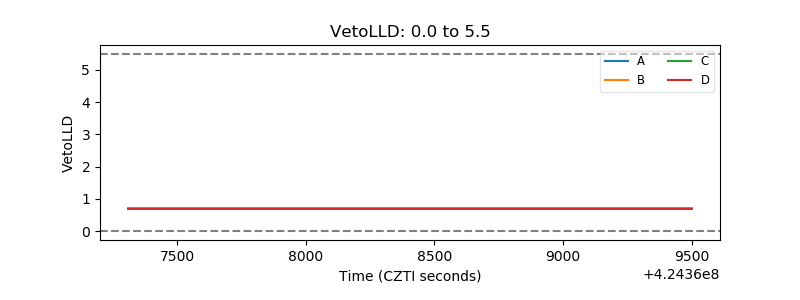 |
| Alpha Counter | 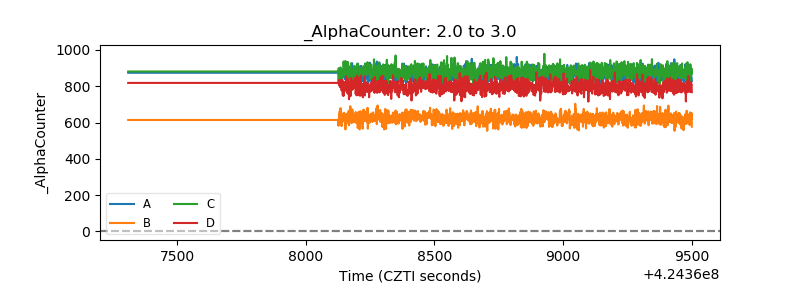 |
| _CPM_Rate | 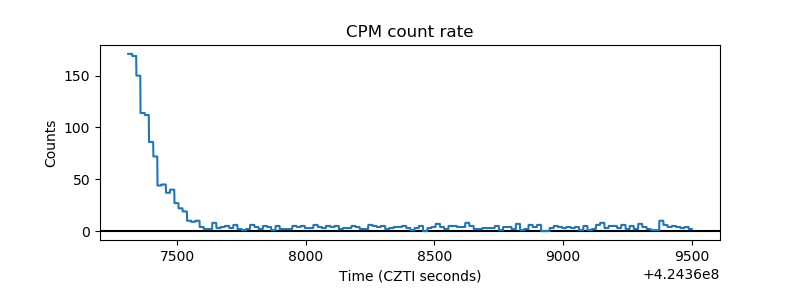 |
| CZT Counter | 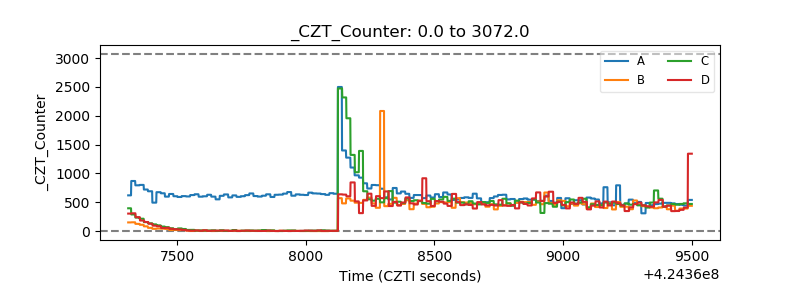 |
| +2.5 Volts monitor | 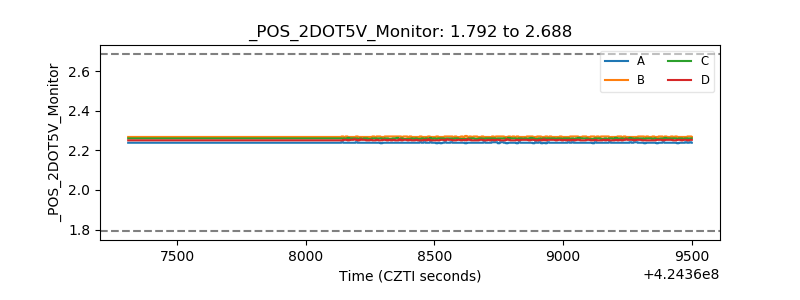 |
| +5 Volts monitor | 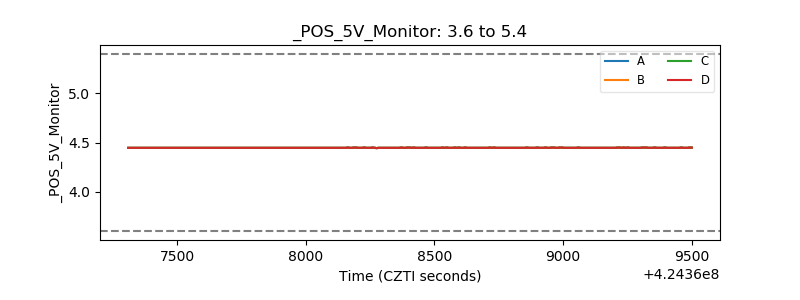 |
| _ROLL_ROT | 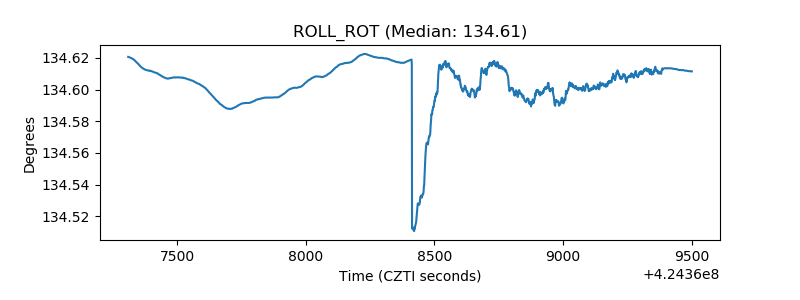 |
| _Roll_DEC | 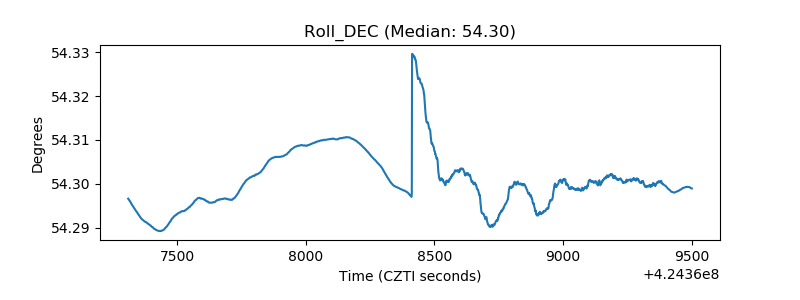 |
| _Roll_RA | 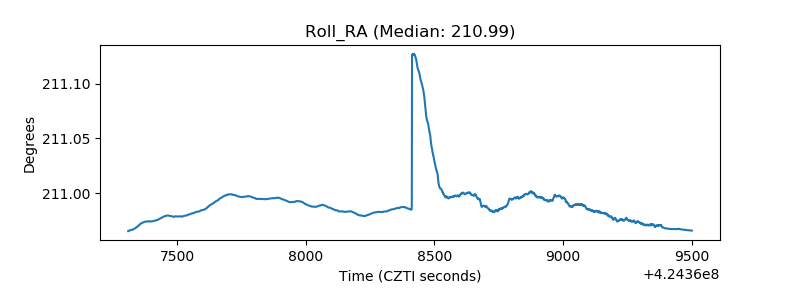 |
| Veto Counter | 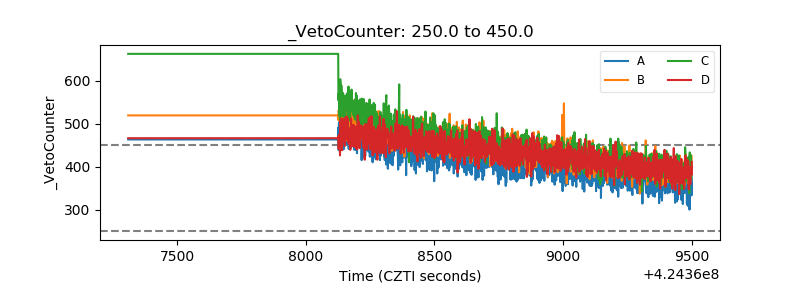 |