| Param | Original file | Final file |
|---|---|---|
| Filename | modeM0/AS1A12_035T02_9000005690_41690cztM0_level2.fits | modeM0/AS1A12_035T02_9000005690_41690cztM0_level2_quad_clean.evt |
| Size (bytes) | 83,615,040 | 20,980,800 |
| Size | 79.7 MB | 20.0 MB |
| Events in quadrant A | 717,270 | 145,254 |
| Events in quadrant B | 712,523 | 146,074 |
| Events in quadrant C | 753,117 | 132,400 |
| Events in quadrant D | 822,898 | 127,295 |
| Mode M9 | |||
|---|---|---|---|
| Quadrant | BADHDUFLAG | Total packets | Discarded packets |
| A | 0 | 14 | 0 |
| B | 0 | 14 | 0 |
| C | 0 | 14 | 0 |
| D | 0 | 14 | 0 |
| Mode M0 | |||
|---|---|---|---|
| Quadrant | BADHDUFLAG | Total packets | Discarded packets |
| A | 0 | 2847 | 2 |
| B | 0 | 2779 | 1 |
| C | 0 | 2842 | 1 |
| D | 0 | 3146 | 1 |
| Mode SS | |||
|---|---|---|---|
| Quadrant | BADHDUFLAG | Total packets | Discarded packets |
| A | 0 | 22 | 0 |
| B | 0 | 22 | 0 |
| C | 0 | 22 | 0 |
| D | 0 | 22 | 0 |
| Quadrant | Total seconds | Saturated seconds | Saturation percentage |
|---|---|---|---|
| A | 1111 | 5 | 0.450045% |
| B | 1111 | 46 | 4.140414% |
| C | 1111 | 71 | 6.390639% |
| D | 1111 | 62 | 5.580558% |
Noise dominated data is calculated using 1-second bins in cleaned event files. If a bin has >2000 counts, and if more than 50% of those come from <1% of pixels, then it is considered to be noise-dominated and hence unusable.
| Quadrant | # 1 sec bins | Bins with >0 counts | Bins with >2000 counts | High rate bins dominated by noise | Noise dominated (total time) | Noise dominated (detector-on time) | Marked lightcurve |
|---|---|---|---|---|---|---|---|
| A | 1111 | 1111 | 2 | 2 | 0.18% | 0.18% | 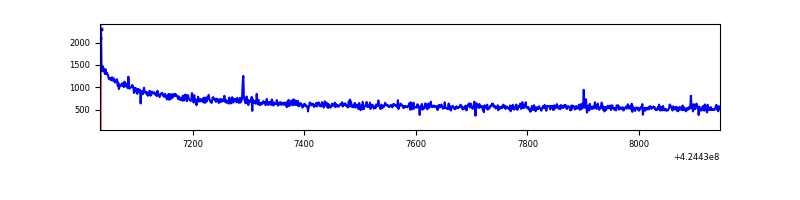 |
| B | 1111 | 1111 | 38 | 38 | 3.42% | 3.42% | 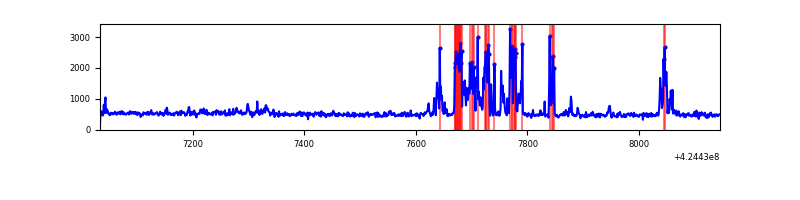 |
| C | 1111 | 1111 | 70 | 70 | 6.30% | 6.30% | 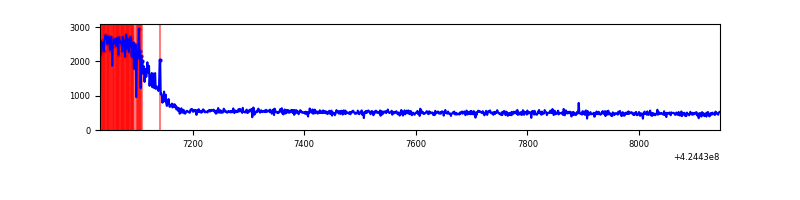 |
| D | 1111 | 1111 | 59 | 59 | 5.31% | 5.31% | 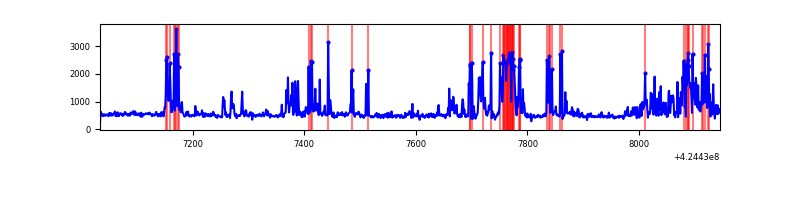 |
Top three noisy pixels from each quadrant. If the there are fewer than three noisy pixels in the level2.evt file, extra rows are filled as -1
| Pixel properties | Quadrant properties | ||||||
|---|---|---|---|---|---|---|---|
| Quadrant | DetID | PixID | Counts | Sigma | Mean | Median | Sigma |
| A | 10 | 83 | 171810 | 5659.44 | 140 | 137 | 30.3 |
| A | 13 | 248 | 2882 | 90.49 | 140 | 137 | 30.3 |
| A | 13 | 254 | 1529 | 45.89 | 140 | 137 | 30.3 |
| B | 0 | 245 | 147059 | 5313.83 | 134 | 131 | 27.7 |
| B | 5 | 255 | 21292 | 765.31 | 134 | 131 | 27.7 |
| B | 4 | 141 | 6791 | 240.87 | 134 | 131 | 27.7 |
| C | 0 | 10 | 204462 | 6648.5 | 128 | 128 | 30.7 |
| C | 15 | 214 | 48375 | 1569.83 | 128 | 128 | 30.7 |
| C | 14 | 254 | 1008 | 28.63 | 128 | 128 | 30.7 |
| D | 2 | 249 | 225006 | 6683.81 | 133 | 129 | 33.6 |
| D | 13 | 249 | 78423 | 2327.06 | 133 | 129 | 33.6 |
| D | 2 | 234 | 4457 | 128.64 | 133 | 129 | 33.6 |
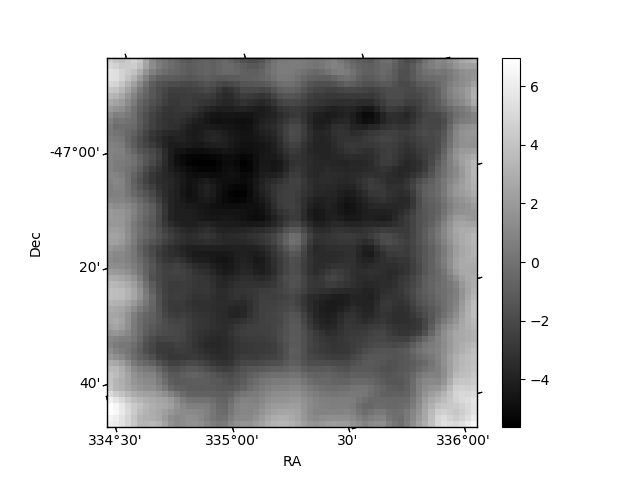
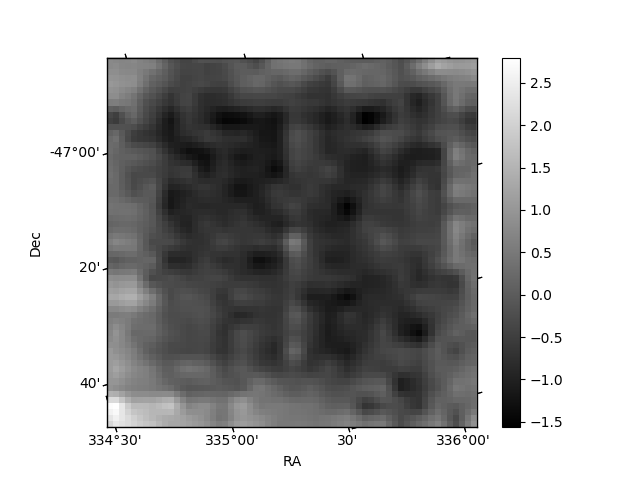
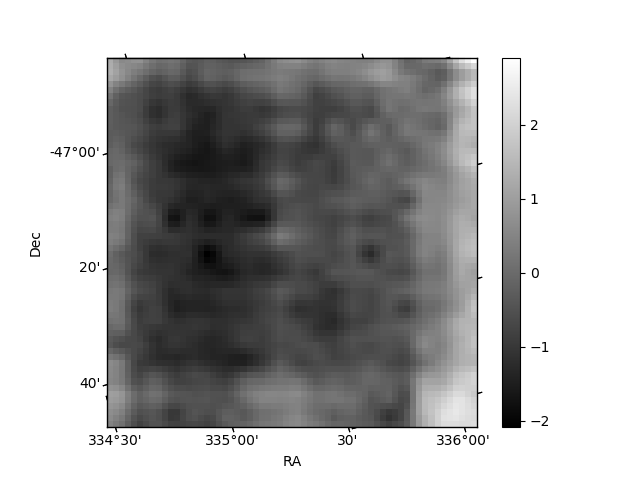
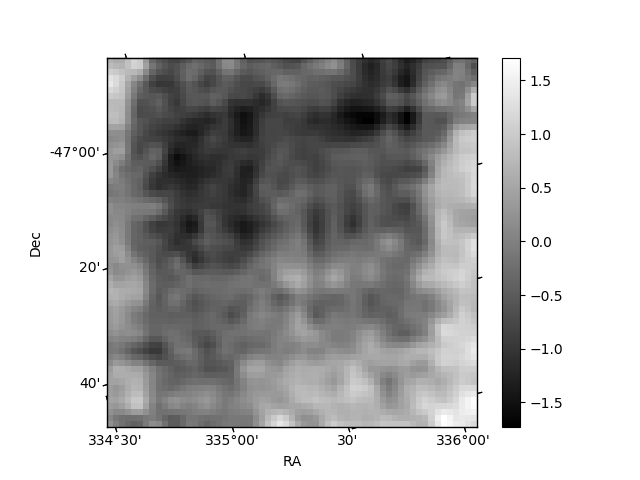
Histogram calculated using DETX and DETY for each event in the final _common_clean file
| Quadrant A | 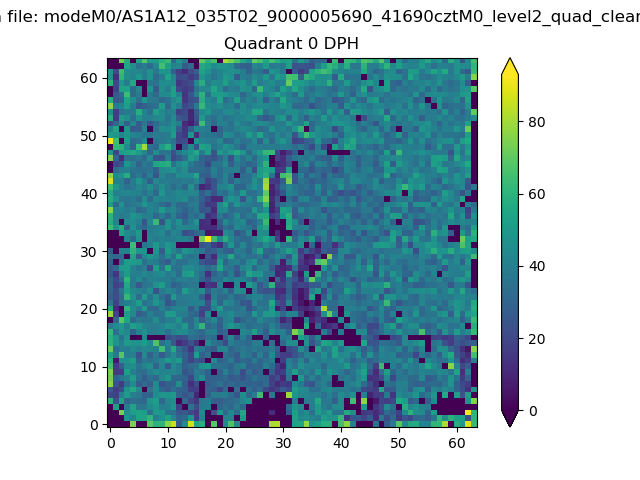 |
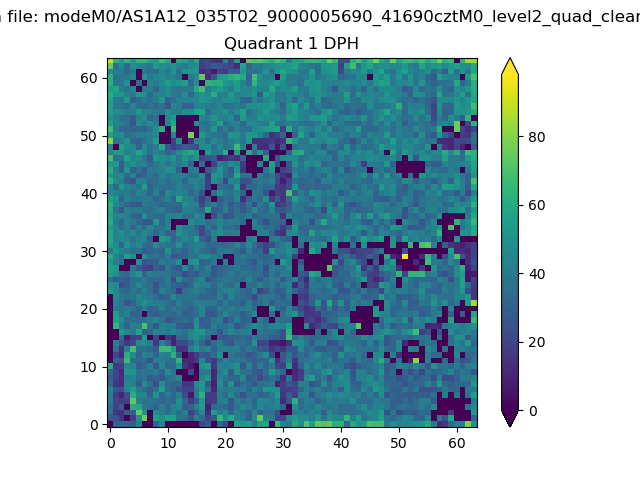 |
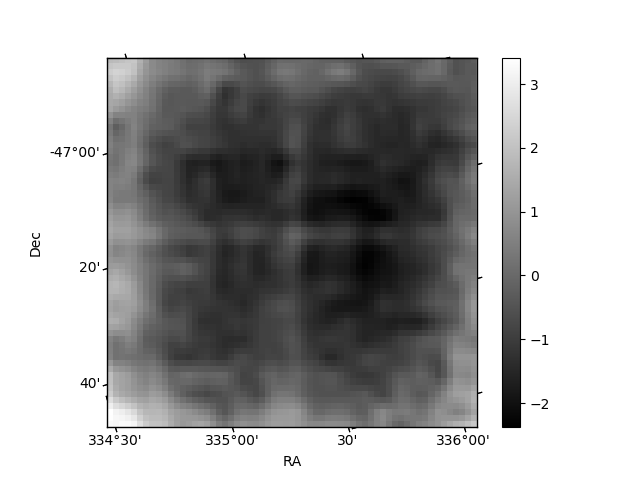
Quadrant B |
|---|---|---|---|
| Quadrant D | 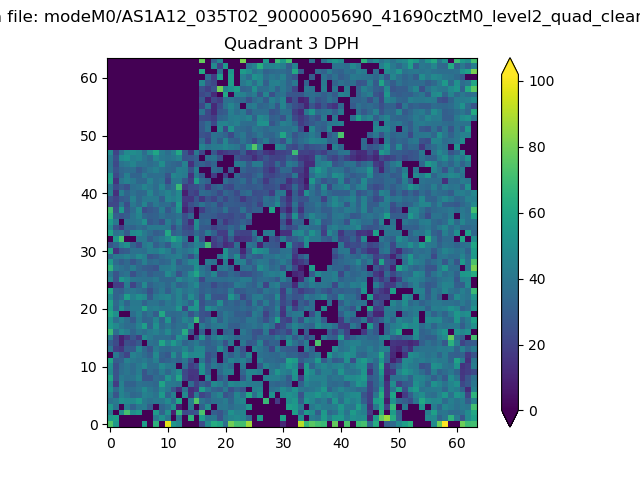 |
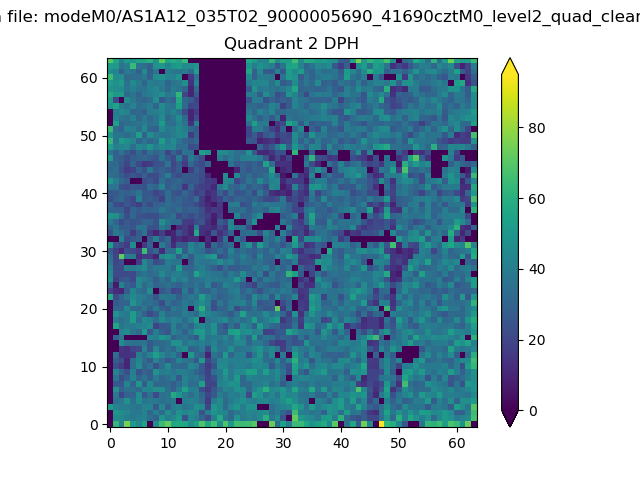 |
Quadrant C |
| Plot type | Count rate plots | Images |
|---|---|---|
| Comparison with Poisson distribution Blue bars denote a histogram of data divided into 1 sec bins. Red curve is a Poisson curve with rate = median count rate of data. |
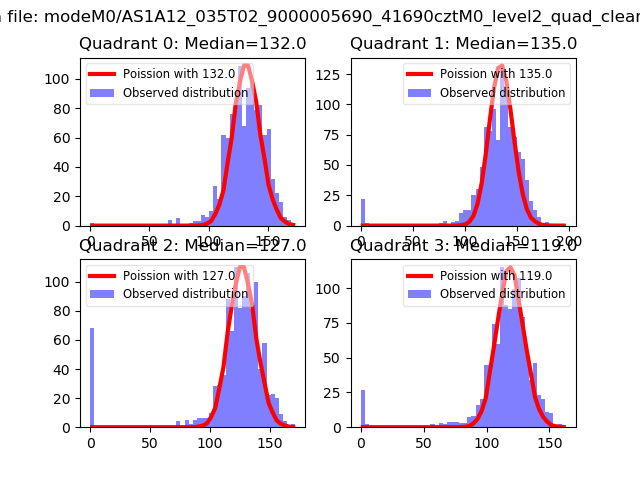 |
 |
| Quadrant-wise count rates Data is divided into 100 sec bins |
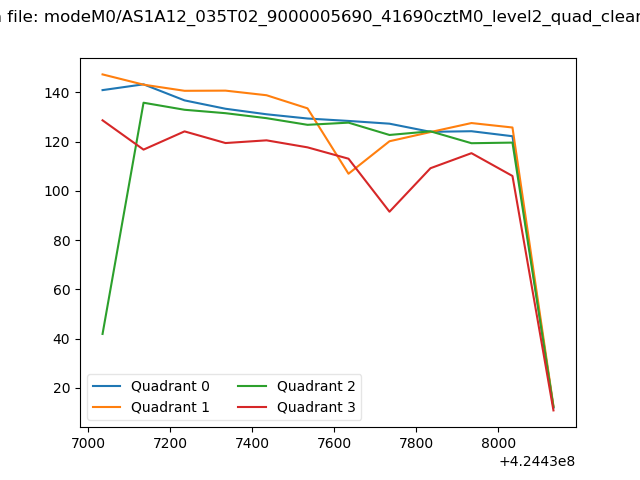 |
|
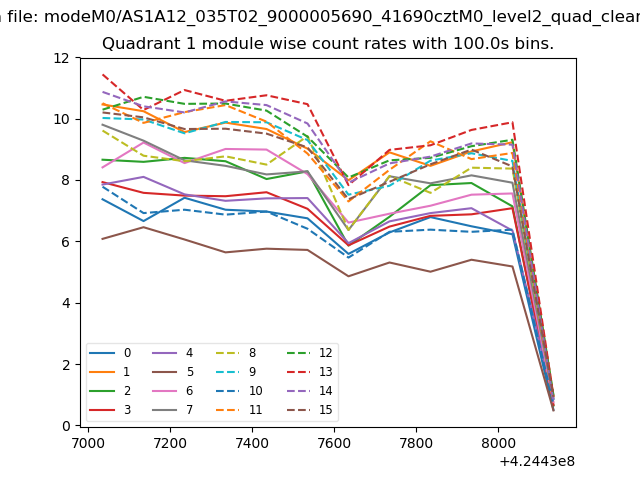
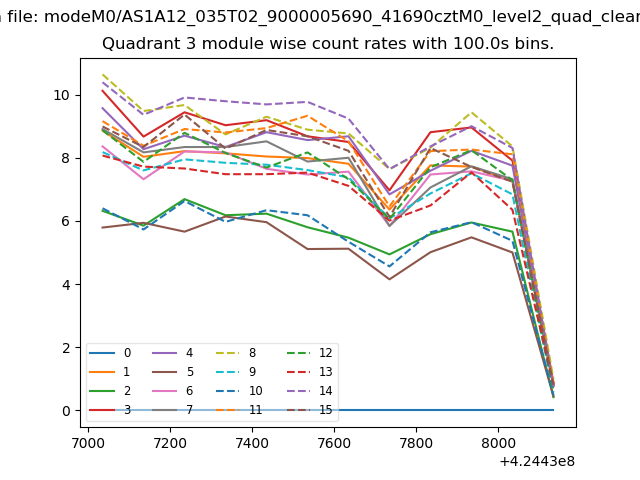
| Module-wise count rates for Quadrant A Data is divided into 100 sec bins |
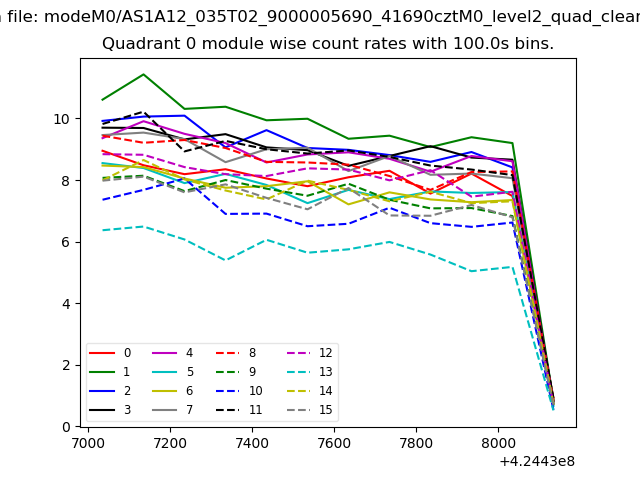 |
 |
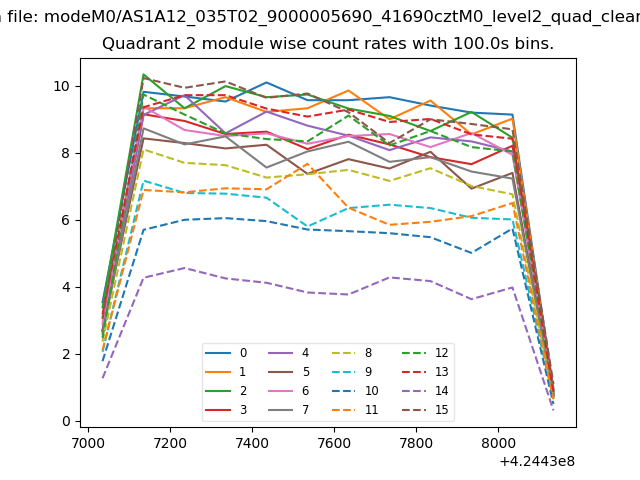
| Module-wise count rates for Quadrant B Data is divided into 100 sec bins |
 |
 |
| Module-wise count rates for Quadrant C Data is divided into 100 sec bins |
 |
 |
| Module-wise count rates for Quadrant D Data is divided into 100 sec bins |
 |
 |
| Parameter | Plot |
|---|---|
| CZT HV Monitor | 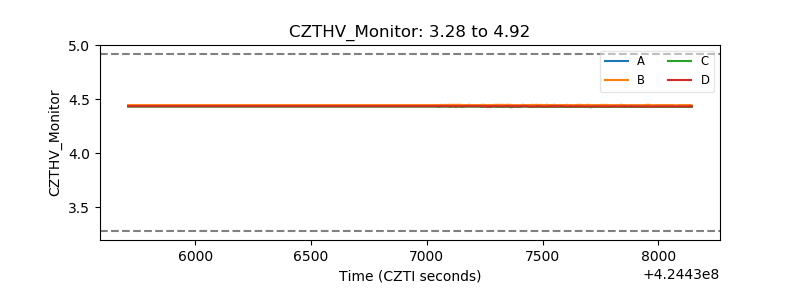 |
| D_VDD | 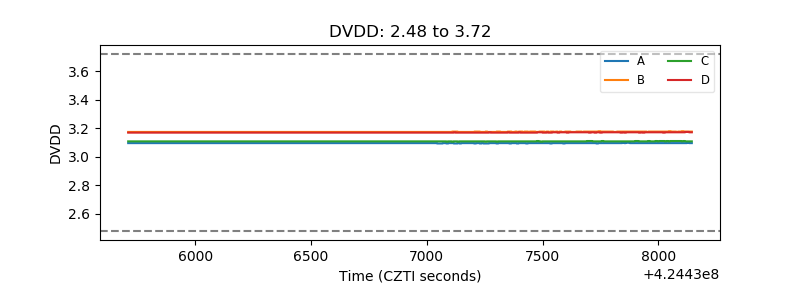 |
| Temperature 1 | 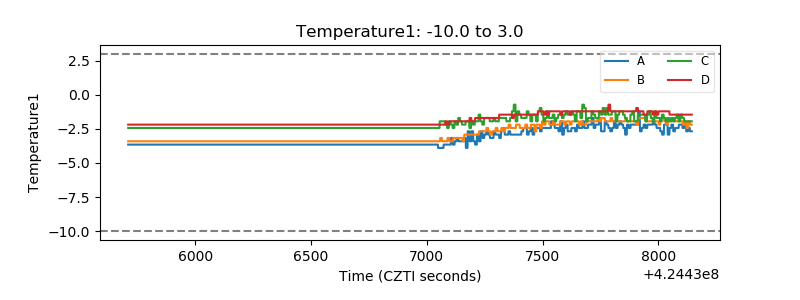 |
| Veto HV Monitor | 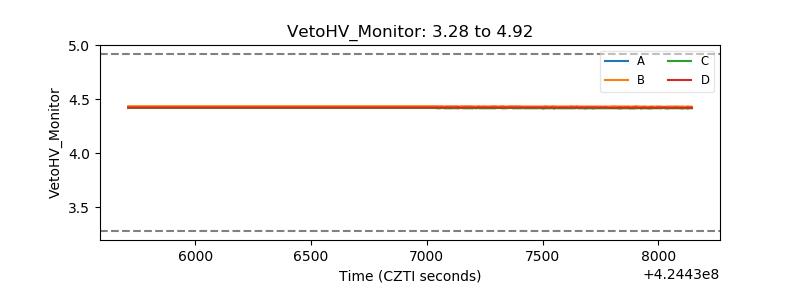 |
| Veto LLD | 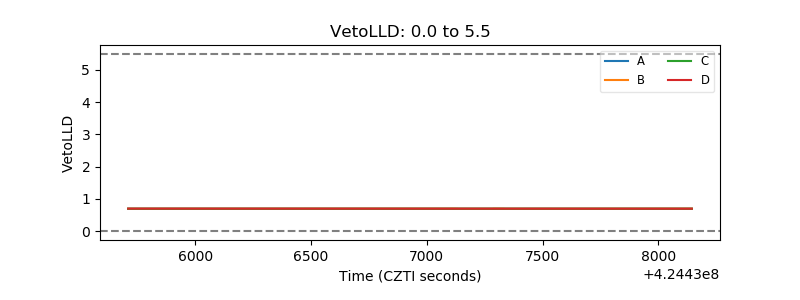 |
| Alpha Counter | 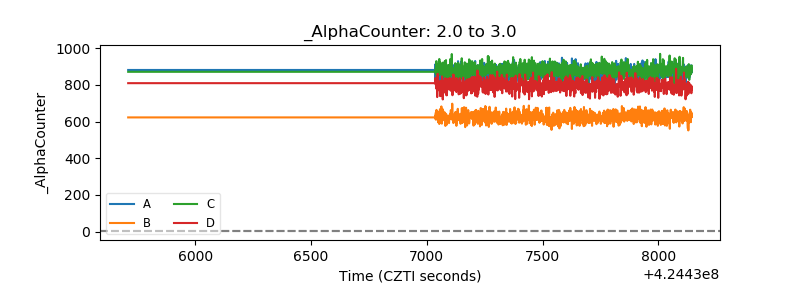 |
| _CPM_Rate | 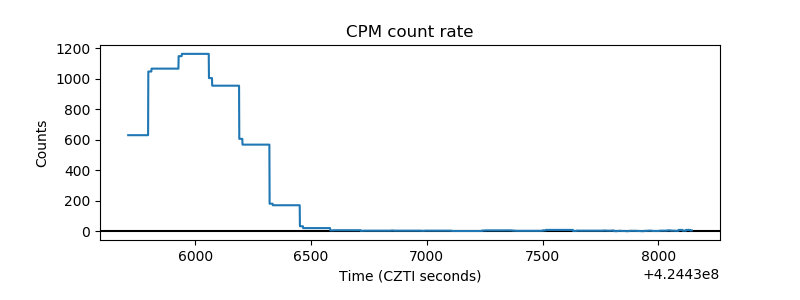 |
| CZT Counter | 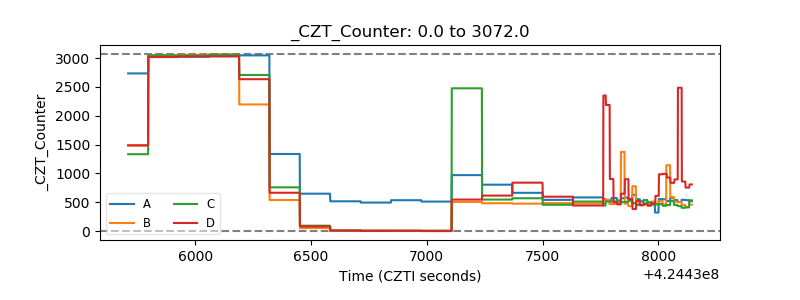 |
| +2.5 Volts monitor | 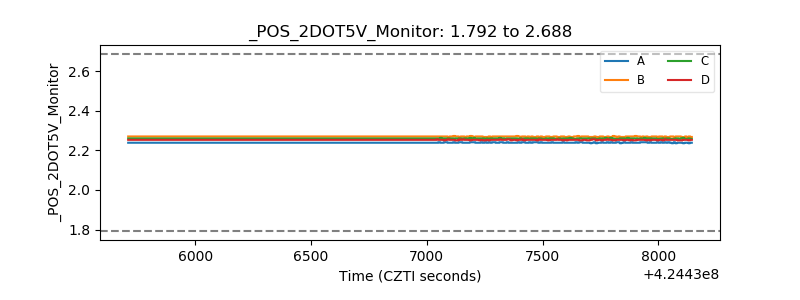 |
| +5 Volts monitor | 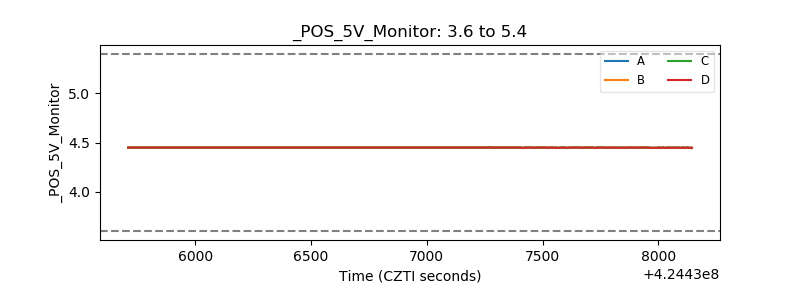 |
| _ROLL_ROT | 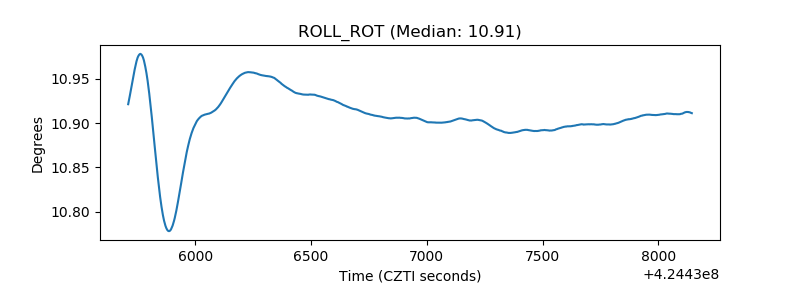 |
| _Roll_DEC | 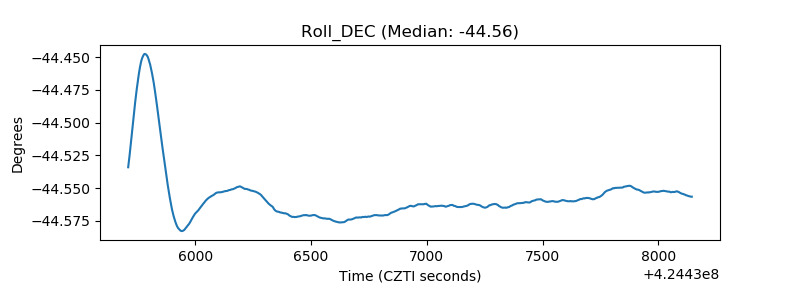 |
| _Roll_RA | 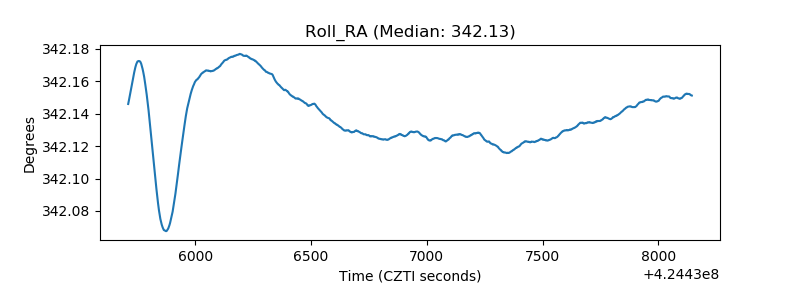 |
| Veto Counter | 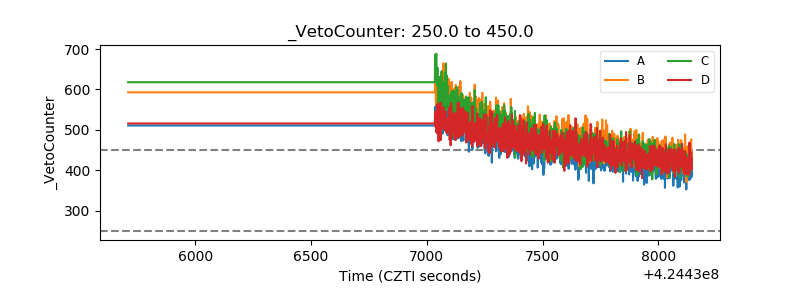 |