| Param | Original file | Final file |
|---|---|---|
| Filename | modeM0/AS1A12_035T02_9000005690_41691cztM0_level2.fits | modeM0/AS1A12_035T02_9000005690_41691cztM0_level2_quad_clean.evt |
| Size (bytes) | 370,255,680 | 95,296,320 |
| Size | 353.1 MB | 90.9 MB |
| Events in quadrant A | 3,674,016 | 659,343 |
| Events in quadrant B | 2,791,012 | 670,039 |
| Events in quadrant C | 2,968,128 | 617,585 |
| Events in quadrant D | 3,861,702 | 569,155 |
| Mode M9 | |||
|---|---|---|---|
| Quadrant | BADHDUFLAG | Total packets | Discarded packets |
| A | 0 | 20 | 0 |
| B | 0 | 20 | 0 |
| C | 0 | 20 | 0 |
| D | 0 | 20 | 0 |
| Mode M0 | |||
|---|---|---|---|
| Quadrant | BADHDUFLAG | Total packets | Discarded packets |
| A | 0 | 14256 | 3 |
| B | 0 | 11597 | 2 |
| C | 0 | 11885 | 2 |
| D | 0 | 15052 | 2 |
| Mode SS | |||
|---|---|---|---|
| Quadrant | BADHDUFLAG | Total packets | Discarded packets |
| A | 0 | 108 | 0 |
| B | 0 | 108 | 0 |
| C | 0 | 108 | 0 |
| D | 0 | 108 | 0 |
| Quadrant | Total seconds | Saturated seconds | Saturation percentage |
|---|---|---|---|
| A | 5279 | 81 | 1.534382% |
| B | 5279 | 61 | 1.155522% |
| C | 5280 | 158 | 2.992424% |
| D | 5280 | 337 | 6.382576% |
Noise dominated data is calculated using 1-second bins in cleaned event files. If a bin has >2000 counts, and if more than 50% of those come from <1% of pixels, then it is considered to be noise-dominated and hence unusable.
| Quadrant | # 1 sec bins | Bins with >0 counts | Bins with >2000 counts | High rate bins dominated by noise | Noise dominated (total time) | Noise dominated (detector-on time) | Marked lightcurve |
|---|---|---|---|---|---|---|---|
| A | 7312 | 5280 | 59 | 59 | 0.81% | 1.12% | 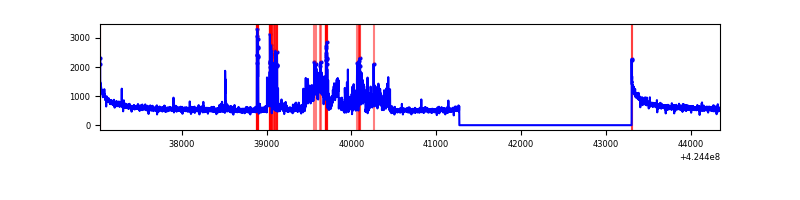 |
| B | 7312 | 5280 | 45 | 45 | 0.62% | 0.85% | 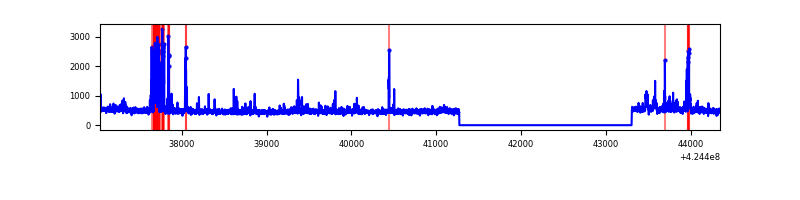 |
| C | 7313 | 5281 | 153 | 153 | 2.09% | 2.90% | 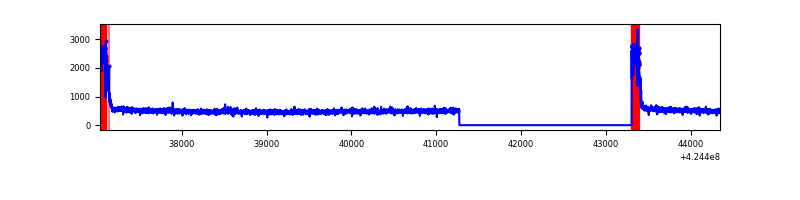 |
| D | 7313 | 5281 | 322 | 322 | 4.40% | 6.10% | 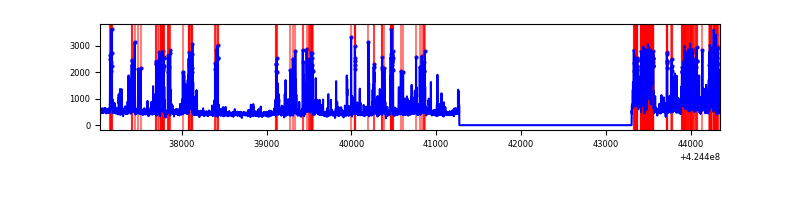 |
Top three noisy pixels from each quadrant. If the there are fewer than three noisy pixels in the level2.evt file, extra rows are filled as -1
| Pixel properties | Quadrant properties | ||||||
|---|---|---|---|---|---|---|---|
| Quadrant | DetID | PixID | Counts | Sigma | Mean | Median | Sigma |
| A | 15 | 223 | 676688 | 5270.57 | 631 | 617 | 128.3 |
| A | 10 | 83 | 547797 | 4265.75 | 631 | 617 | 128.3 |
| A | 3 | 1 | 7652 | 54.84 | 631 | 617 | 128.3 |
| B | 0 | 245 | 176064 | 1489.27 | 622 | 606 | 117.8 |
| B | 0 | 190 | 83053 | 699.8 | 622 | 606 | 117.8 |
| B | 5 | 255 | 47044 | 394.16 | 622 | 606 | 117.8 |
| C | 0 | 10 | 426102 | 3104.07 | 595 | 598 | 137.1 |
| C | 15 | 214 | 215125 | 1564.98 | 595 | 598 | 137.1 |
| C | 13 | 61 | 4180 | 26.13 | 595 | 598 | 137.1 |
| D | 2 | 249 | 776860 | 5409.75 | 597 | 583 | 143.5 |
| D | 2 | 120 | 506704 | 3527.08 | 597 | 583 | 143.5 |
| D | 13 | 249 | 186942 | 1298.71 | 597 | 583 | 143.5 |
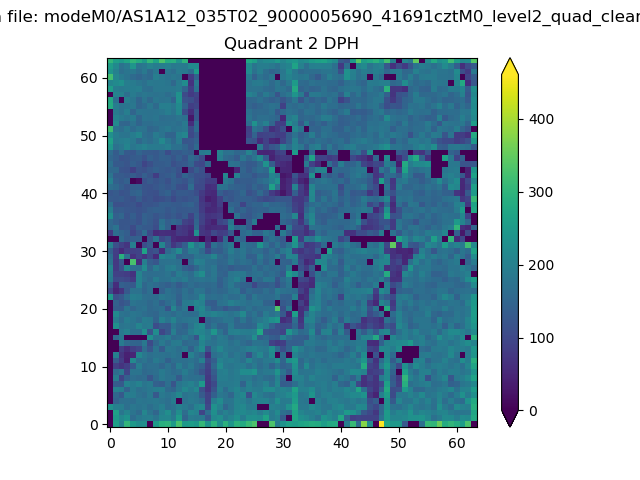
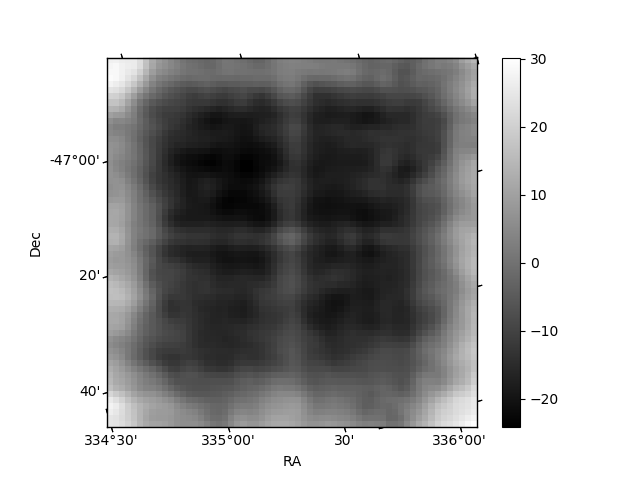
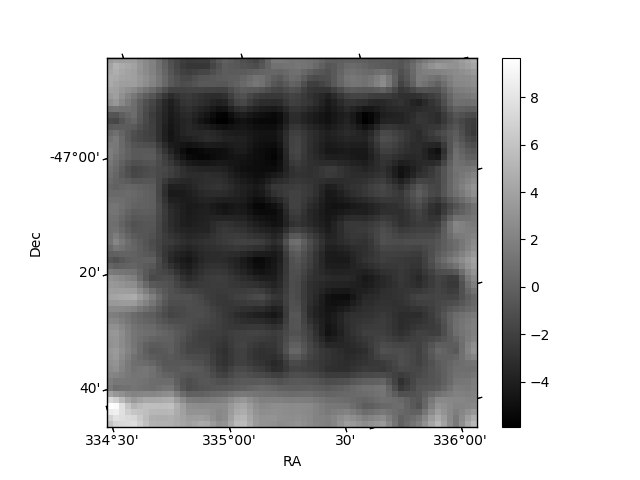
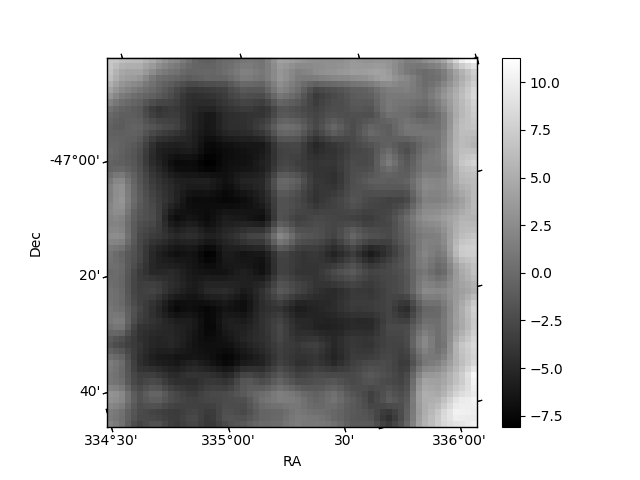
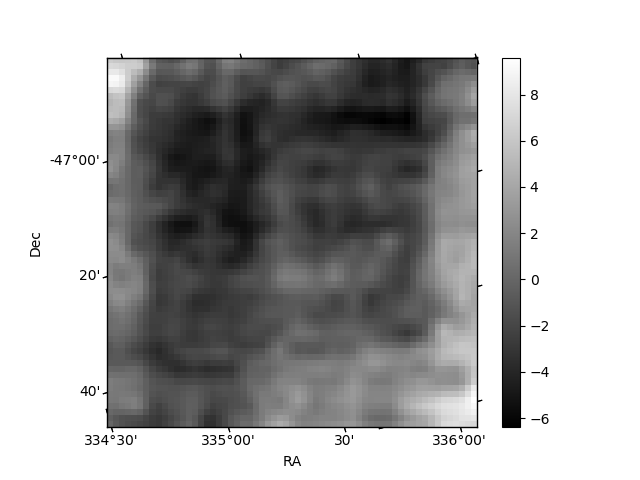
Histogram calculated using DETX and DETY for each event in the final _common_clean file
| Quadrant A | 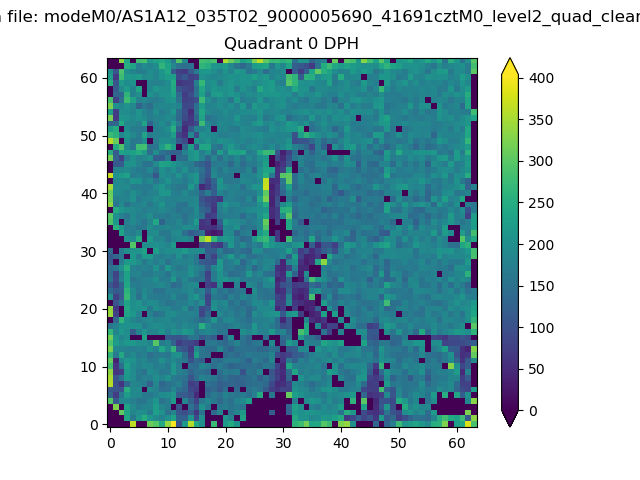 |
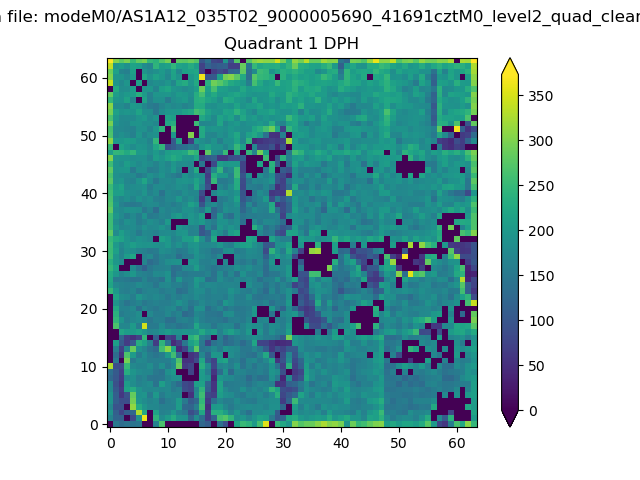 |
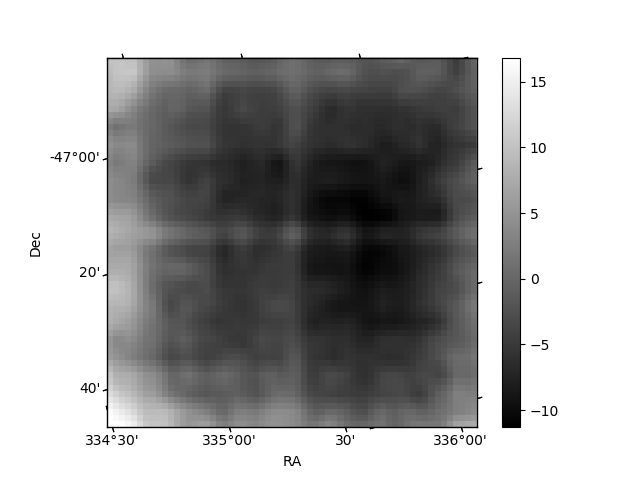
Quadrant B |
|---|---|---|---|
| Quadrant D | 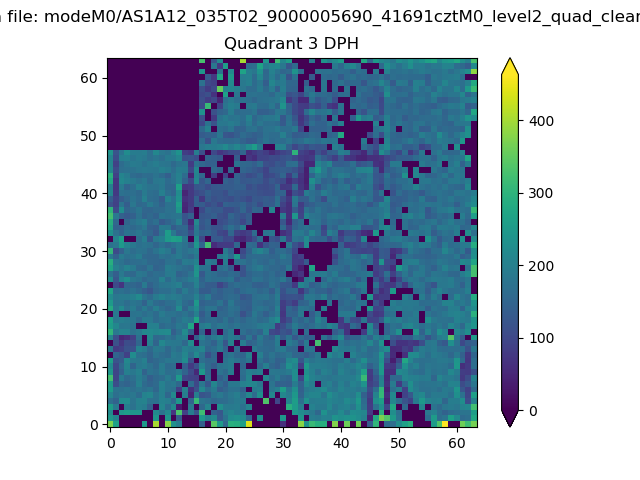 |
 |
Quadrant C |
| Plot type | Count rate plots | Images |
|---|---|---|
| Comparison with Poisson distribution Blue bars denote a histogram of data divided into 1 sec bins. Red curve is a Poisson curve with rate = median count rate of data. |
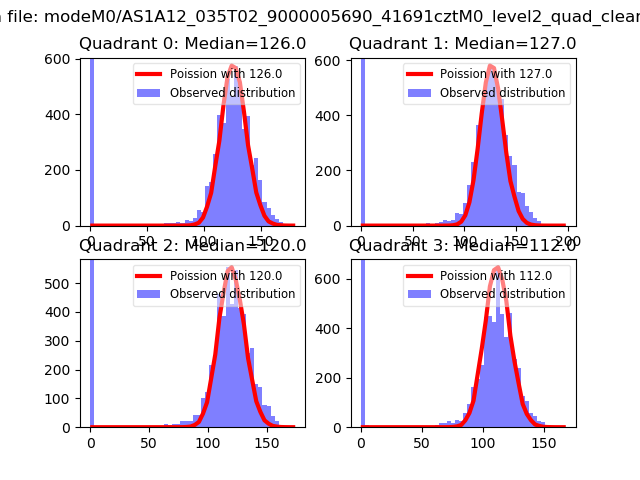 |
 |
| Quadrant-wise count rates Data is divided into 100 sec bins |
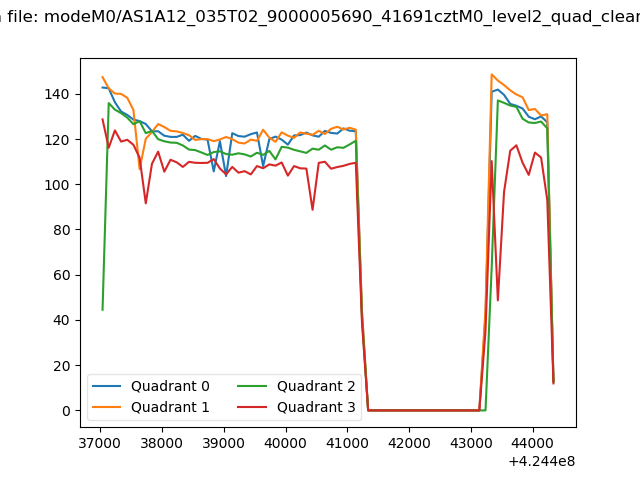 |
|
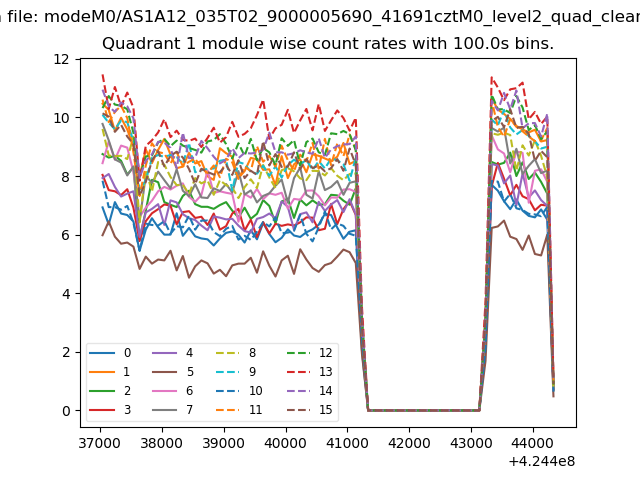
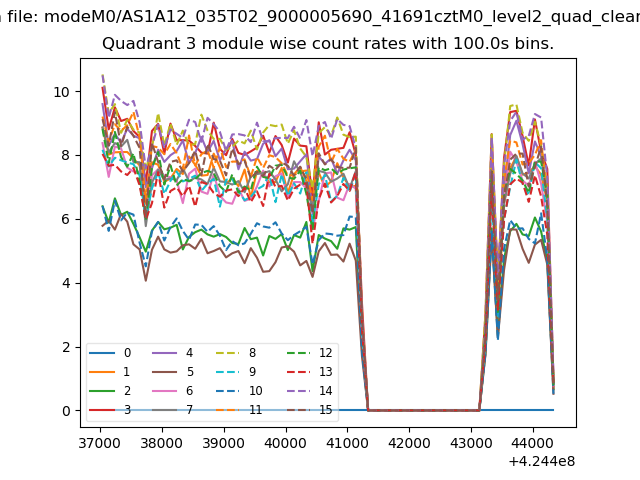
| Module-wise count rates for Quadrant A Data is divided into 100 sec bins |
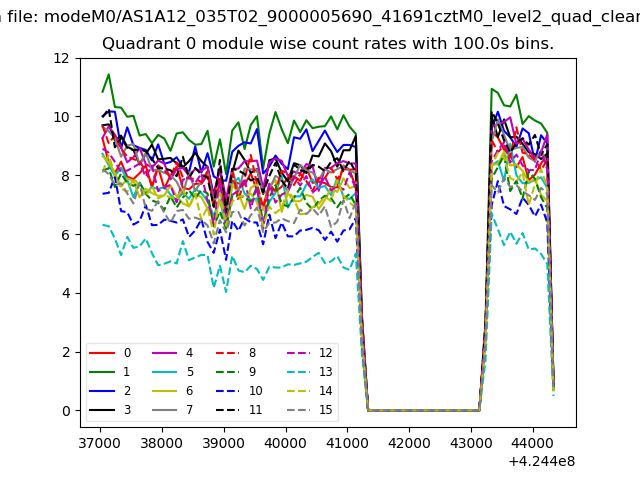 |
 |
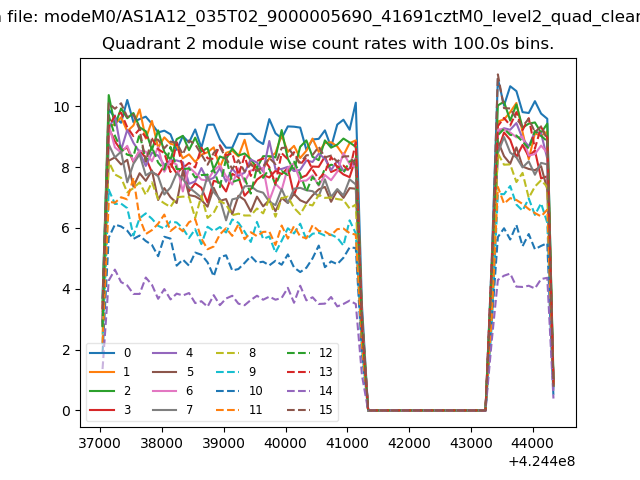
| Module-wise count rates for Quadrant B Data is divided into 100 sec bins |
 |
 |
| Module-wise count rates for Quadrant C Data is divided into 100 sec bins |
 |
 |
| Module-wise count rates for Quadrant D Data is divided into 100 sec bins |
 |
 |
| Parameter | Plot |
|---|---|
| CZT HV Monitor | 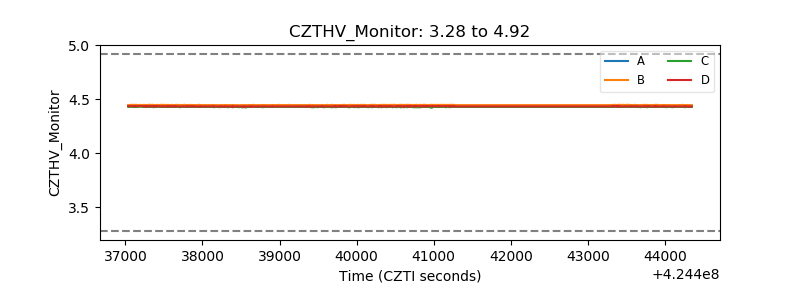 |
| D_VDD | 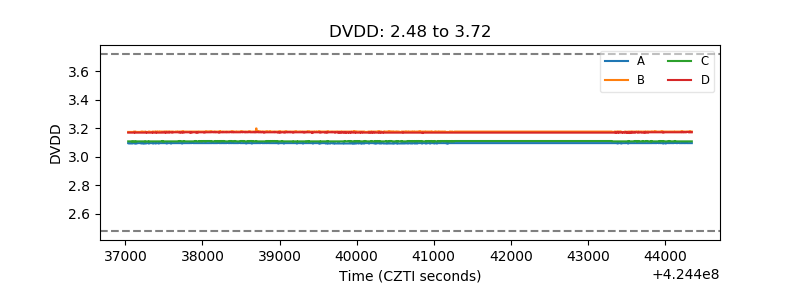 |
| Temperature 1 | 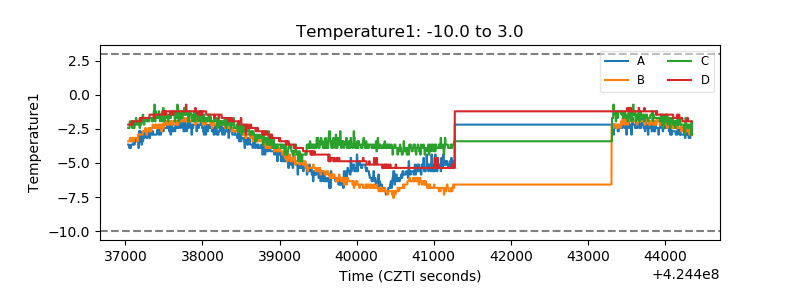 |
| Veto HV Monitor | 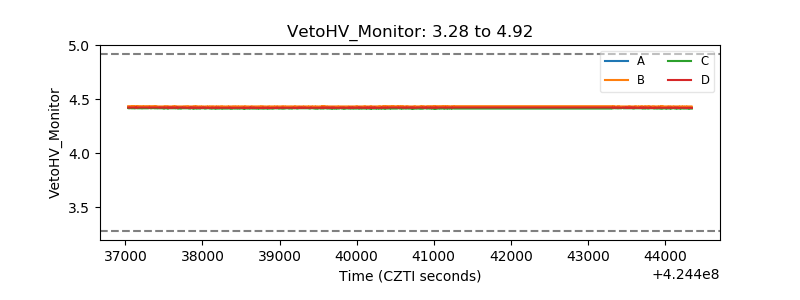 |
| Veto LLD | 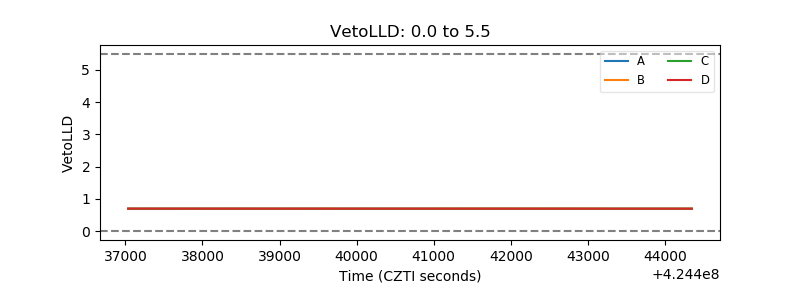 |
| Alpha Counter | 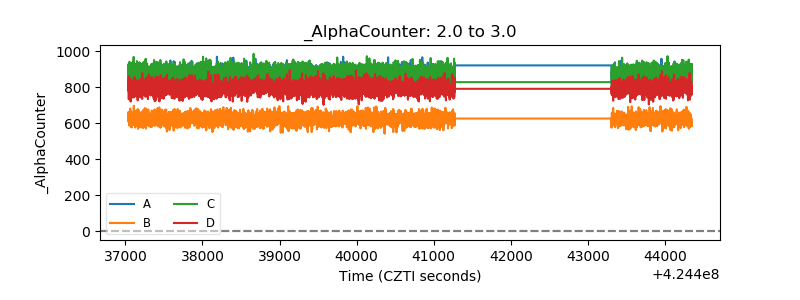 |
| _CPM_Rate | 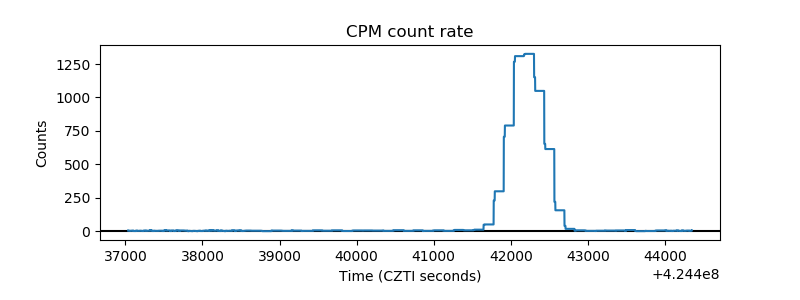 |
| CZT Counter | 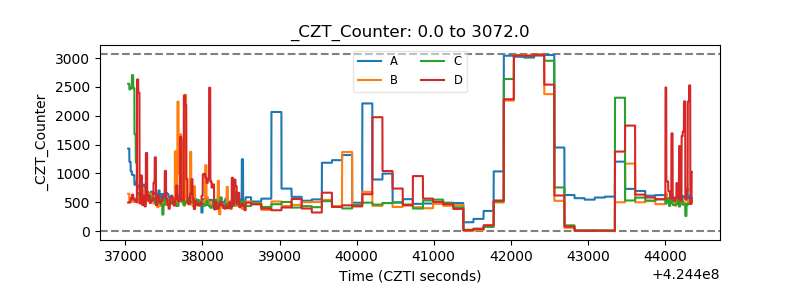 |
| +2.5 Volts monitor | 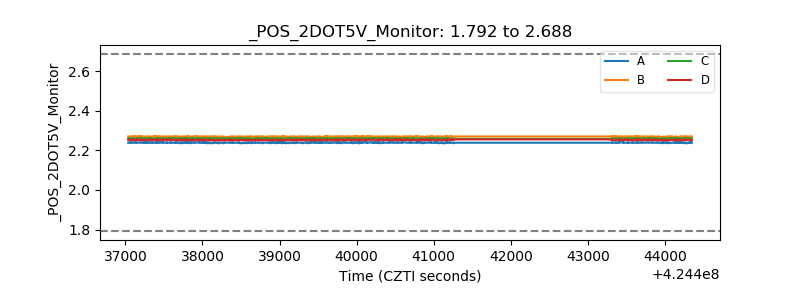 |
| +5 Volts monitor | 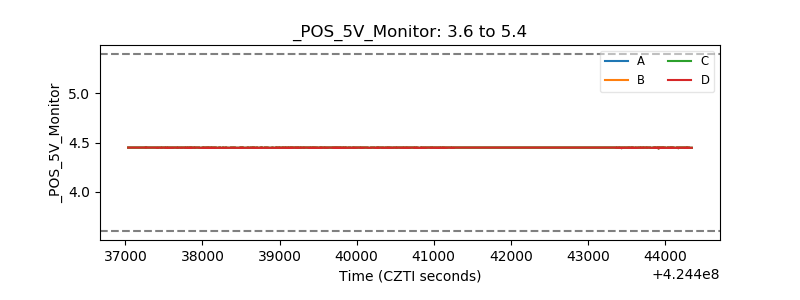 |
| _ROLL_ROT | 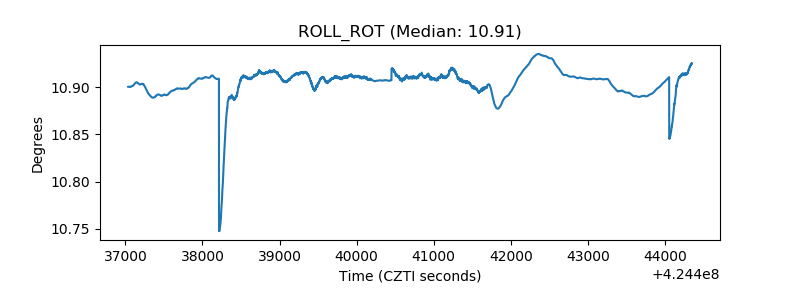 |
| _Roll_DEC | 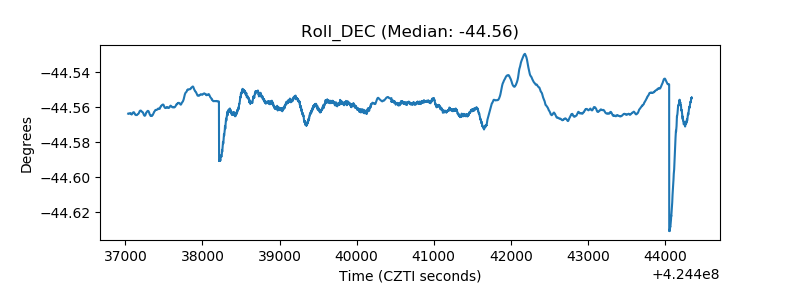 |
| _Roll_RA | 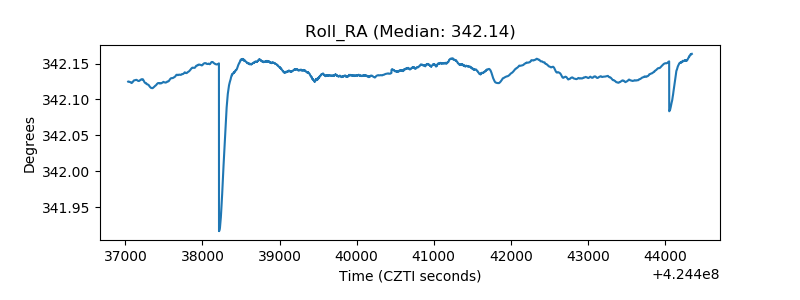 |
| Veto Counter | 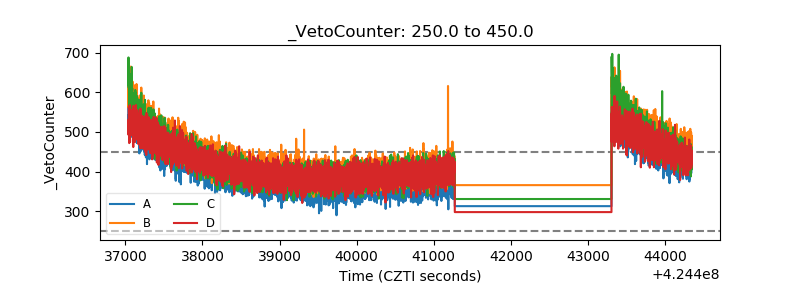 |