| Param | Original file | Final file |
|---|---|---|
| Filename | modeM0/AS1A12_035T02_9000005690_41692cztM0_level2.fits | modeM0/AS1A12_035T02_9000005690_41692cztM0_level2_quad_clean.evt |
| Size (bytes) | 371,249,280 | 92,352,960 |
| Size | 354.1 MB | 88.1 MB |
| Events in quadrant A | 2,938,891 | 650,909 |
| Events in quadrant B | 2,667,193 | 661,907 |
| Events in quadrant C | 2,914,218 | 598,395 |
| Events in quadrant D | 4,824,266 | 526,776 |
| Mode M9 | |||
|---|---|---|---|
| Quadrant | BADHDUFLAG | Total packets | Discarded packets |
| A | 0 | 31 | 0 |
| B | 0 | 31 | 0 |
| C | 0 | 31 | 0 |
| D | 0 | 32 | 0 |
| Mode M0 | |||
|---|---|---|---|
| Quadrant | BADHDUFLAG | Total packets | Discarded packets |
| A | 0 | 11770 | 3 |
| B | 0 | 11109 | 2 |
| C | 0 | 11627 | 2 |
| D | 0 | 17765 | 2 |
| Mode SS | |||
|---|---|---|---|
| Quadrant | BADHDUFLAG | Total packets | Discarded packets |
| A | 0 | 106 | 0 |
| B | 0 | 106 | 0 |
| C | 0 | 106 | 0 |
| D | 0 | 106 | 0 |
| Quadrant | Total seconds | Saturated seconds | Saturation percentage |
|---|---|---|---|
| A | 5112 | 20 | 0.391236% |
| B | 5112 | 25 | 0.489045% |
| C | 5112 | 180 | 3.521127% |
| D | 5112 | 618 | 12.089202% |
Noise dominated data is calculated using 1-second bins in cleaned event files. If a bin has >2000 counts, and if more than 50% of those come from <1% of pixels, then it is considered to be noise-dominated and hence unusable.
| Quadrant | # 1 sec bins | Bins with >0 counts | Bins with >2000 counts | High rate bins dominated by noise | Noise dominated (total time) | Noise dominated (detector-on time) | Marked lightcurve |
|---|---|---|---|---|---|---|---|
| A | 7235 | 5113 | 5 | 5 | 0.07% | 0.10% | 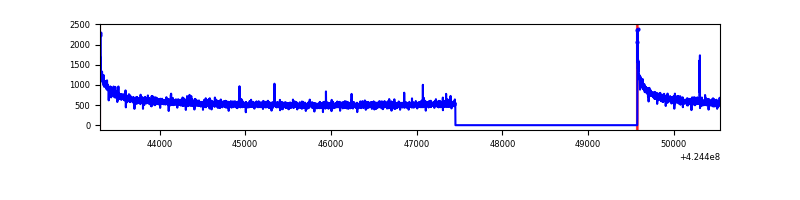 |
| B | 7235 | 5113 | 9 | 9 | 0.12% | 0.18% | 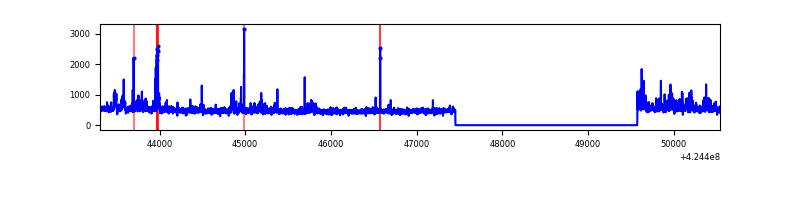 |
| C | 7235 | 5113 | 170 | 170 | 2.35% | 3.32% | 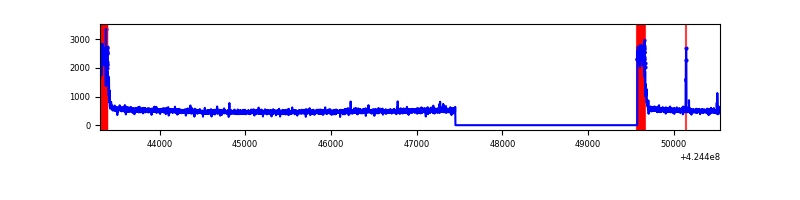 |
| D | 7235 | 5113 | 574 | 574 | 7.93% | 11.23% | 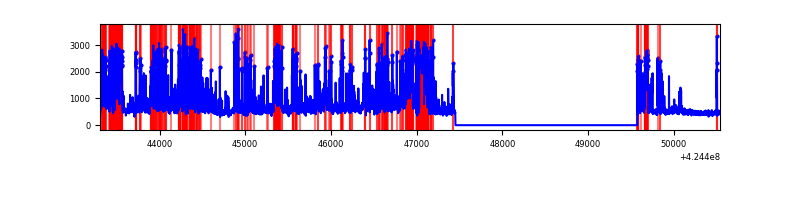 |
Top three noisy pixels from each quadrant. If the there are fewer than three noisy pixels in the level2.evt file, extra rows are filled as -1
| Pixel properties | Quadrant properties | ||||||
|---|---|---|---|---|---|---|---|
| Quadrant | DetID | PixID | Counts | Sigma | Mean | Median | Sigma |
| A | 10 | 83 | 546796 | 4450.32 | 614 | 605 | 122.7 |
| A | 13 | 254 | 7832 | 58.89 | 614 | 605 | 122.7 |
| A | 3 | 137 | 6490 | 47.95 | 614 | 605 | 122.7 |
| B | 0 | 190 | 134627 | 1169.74 | 606 | 592 | 114.6 |
| B | 5 | 255 | 55710 | 481.02 | 606 | 592 | 114.6 |
| B | 0 | 245 | 39521 | 339.74 | 606 | 592 | 114.6 |
| C | 0 | 10 | 436933 | 3252.94 | 577 | 582 | 134.1 |
| C | 15 | 214 | 207056 | 1539.24 | 577 | 582 | 134.1 |
| C | 15 | 111 | 13111 | 93.4 | 577 | 582 | 134.1 |
| D | 2 | 120 | 1448923 | 10431.77 | 564 | 547 | 138.8 |
| D | 2 | 249 | 912158 | 6565.78 | 564 | 547 | 138.8 |
| D | 13 | 249 | 107589 | 770.96 | 564 | 547 | 138.8 |
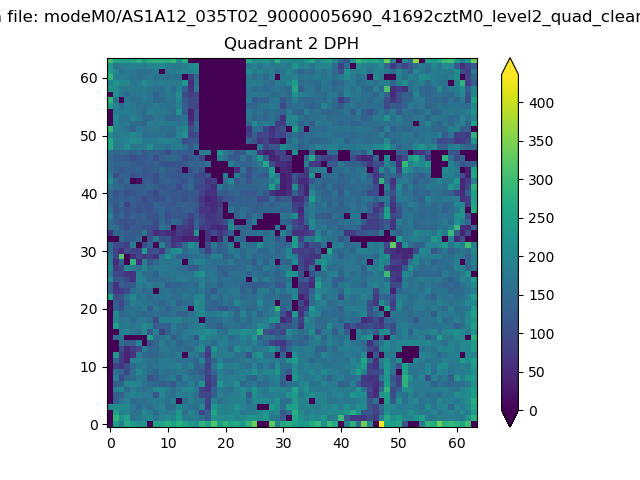
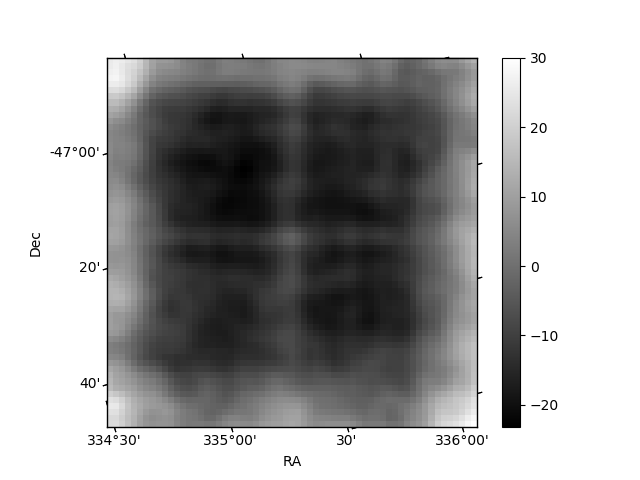
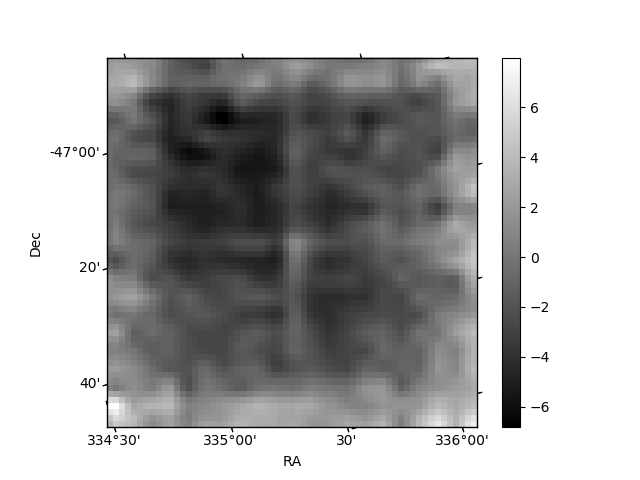
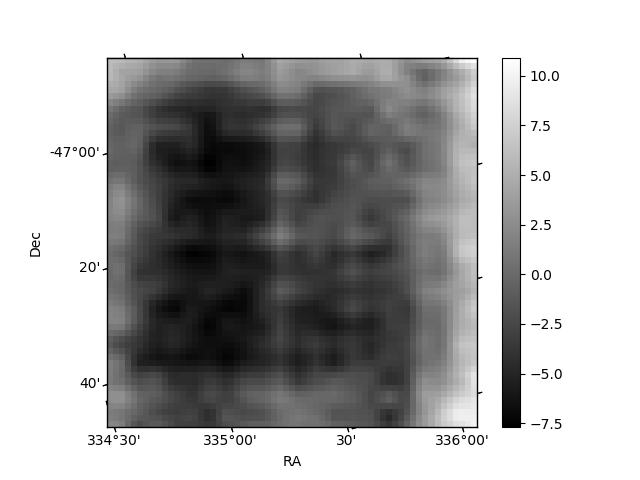
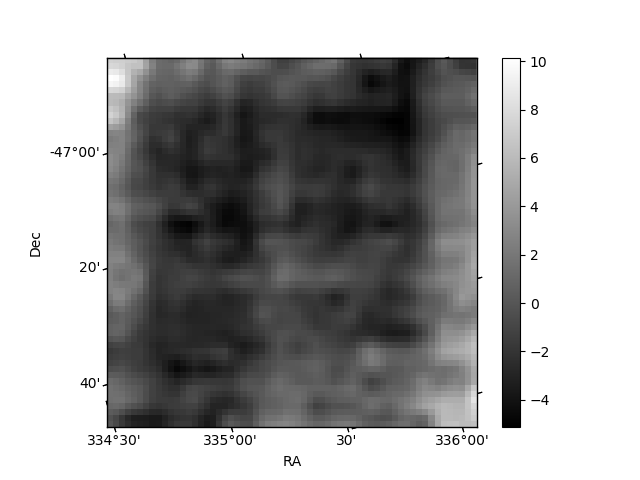
Histogram calculated using DETX and DETY for each event in the final _common_clean file
| Quadrant A | 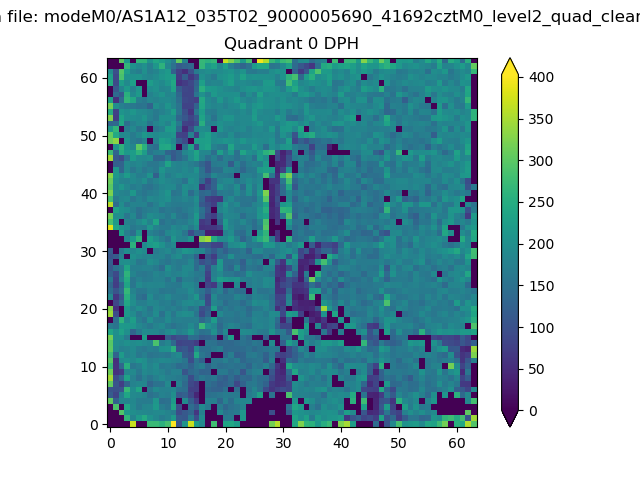 |
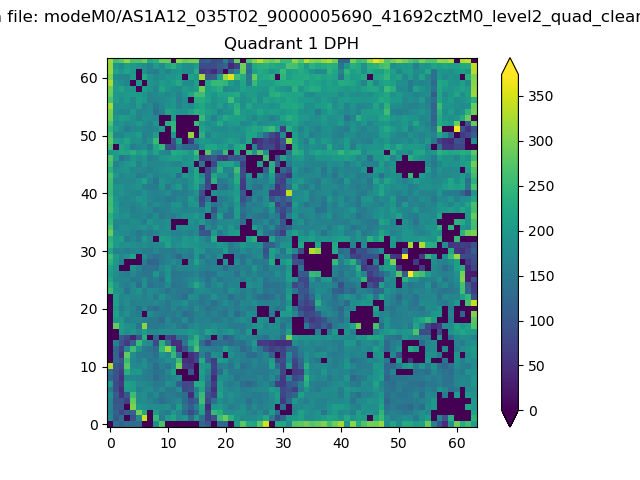 |
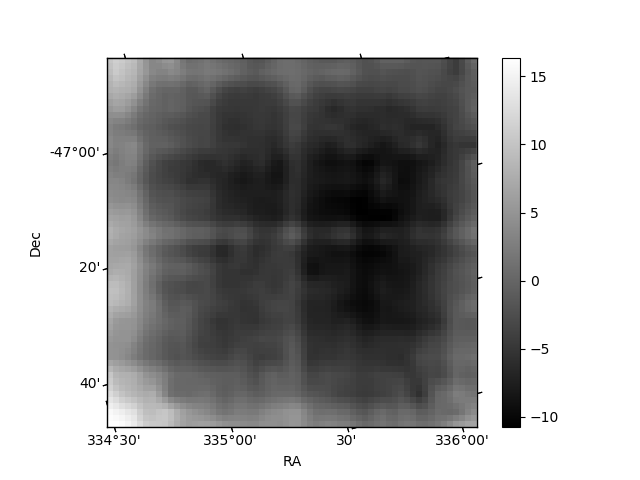
Quadrant B |
|---|---|---|---|
| Quadrant D | 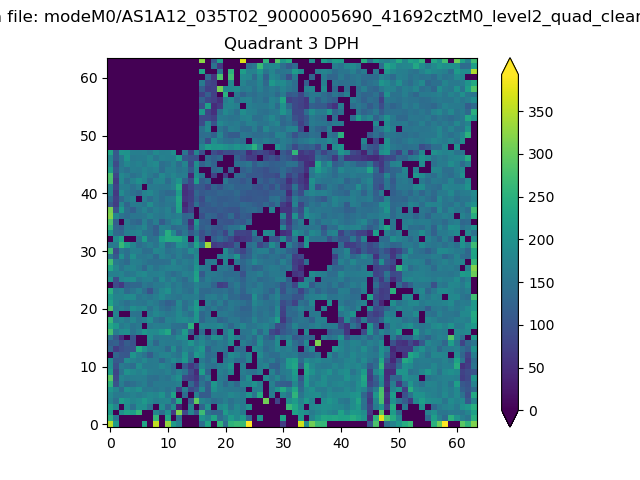 |
 |
Quadrant C |
| Plot type | Count rate plots | Images |
|---|---|---|
| Comparison with Poisson distribution Blue bars denote a histogram of data divided into 1 sec bins. Red curve is a Poisson curve with rate = median count rate of data. |
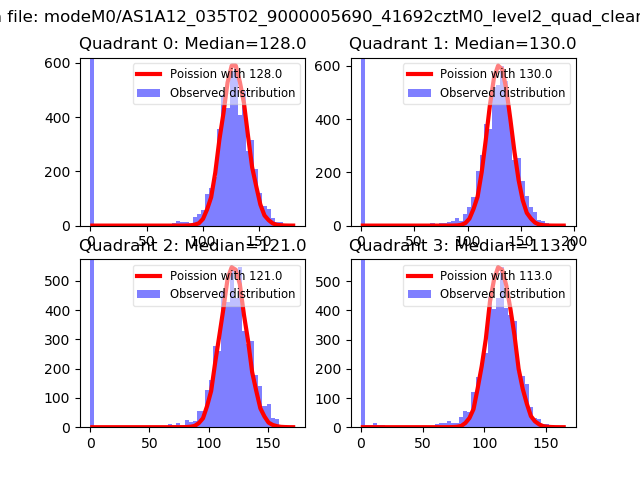 |
 |
| Quadrant-wise count rates Data is divided into 100 sec bins |
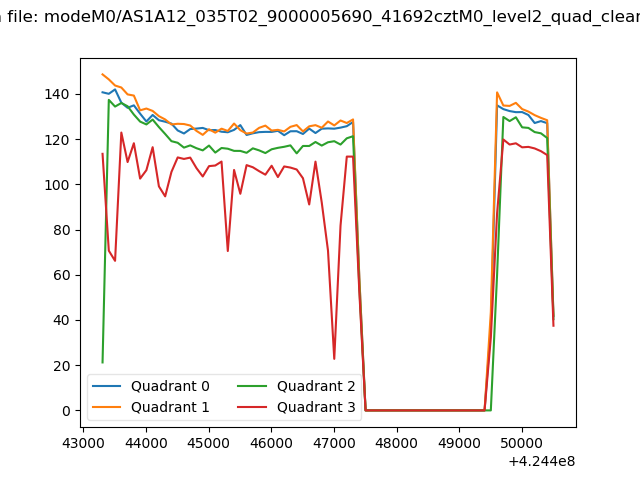 |
|
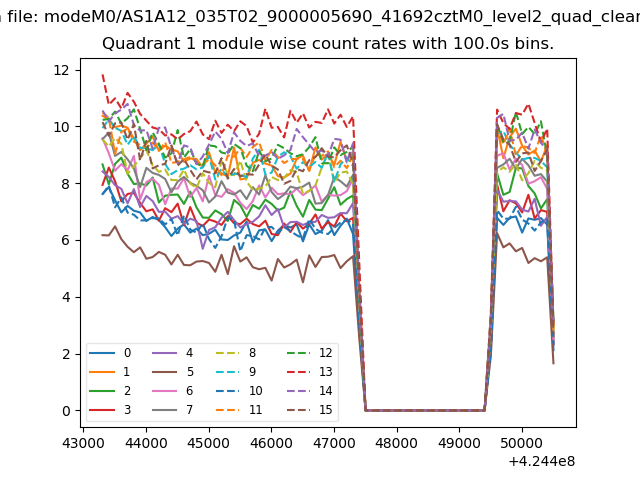
| Module-wise count rates for Quadrant A Data is divided into 100 sec bins |
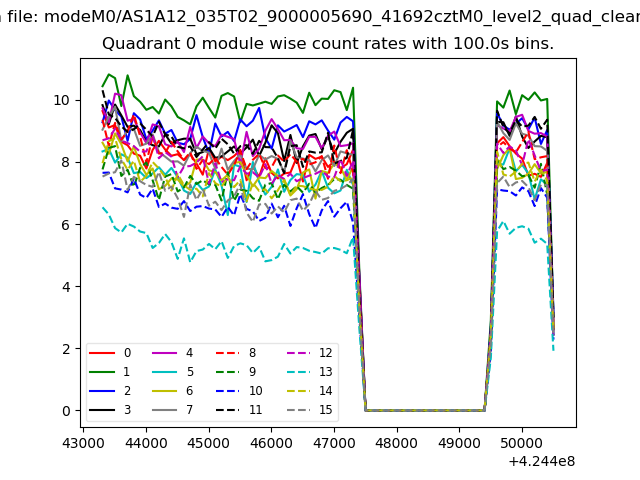 |
 |
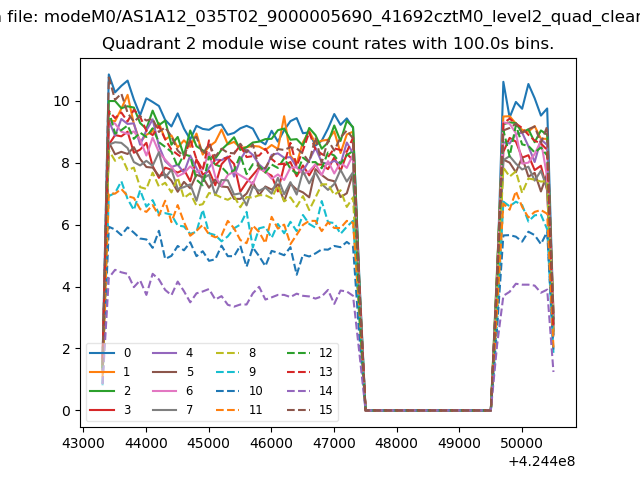
| Module-wise count rates for Quadrant B Data is divided into 100 sec bins |
 |
 |
| Module-wise count rates for Quadrant C Data is divided into 100 sec bins |
 |
 |
| Module-wise count rates for Quadrant D Data is divided into 100 sec bins |
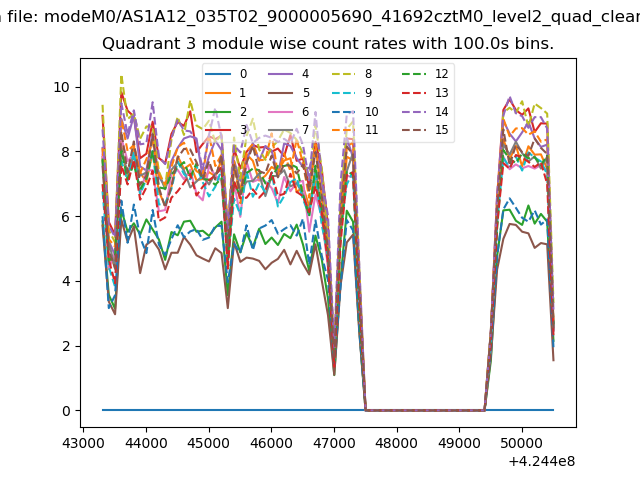 |
 |
| Parameter | Plot |
|---|---|
| CZT HV Monitor | 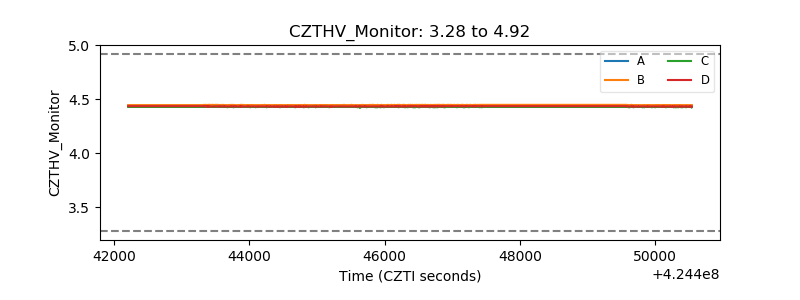 |
| D_VDD | 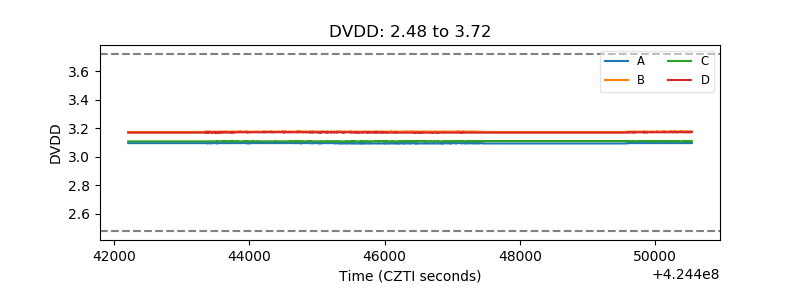 |
| Temperature 1 | 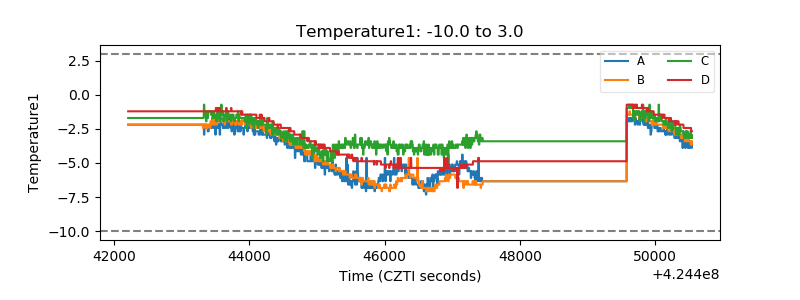 |
| Veto HV Monitor | 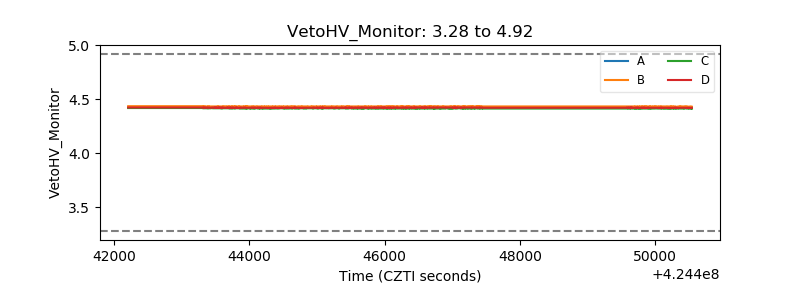 |
| Veto LLD | 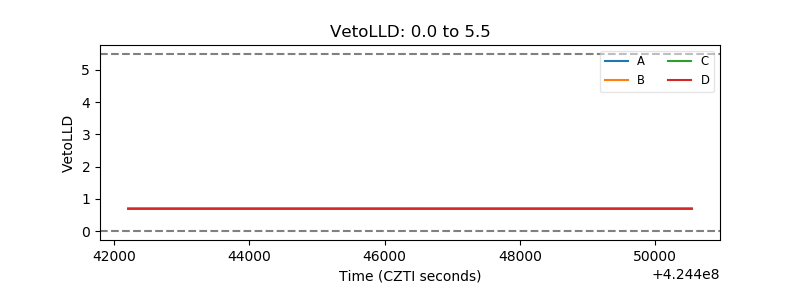 |
| Alpha Counter | 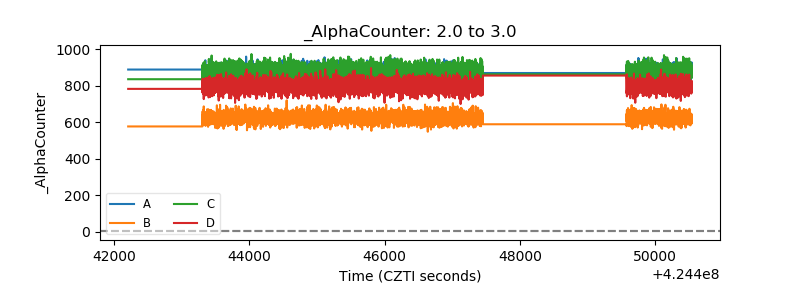 |
| _CPM_Rate | 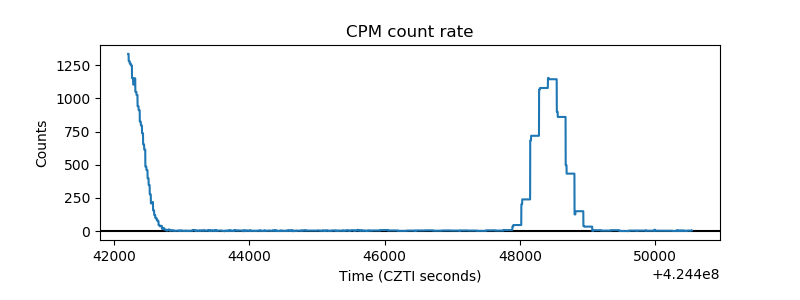 |
| CZT Counter | 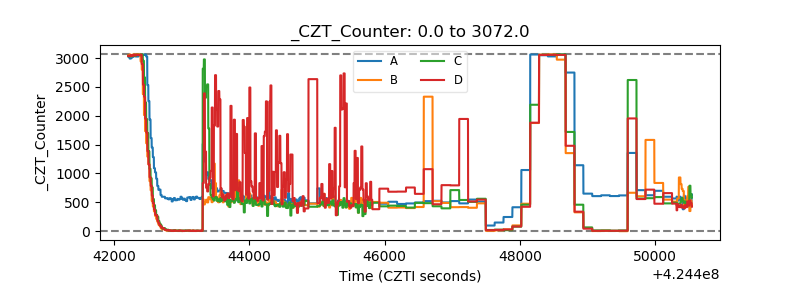 |
| +2.5 Volts monitor | 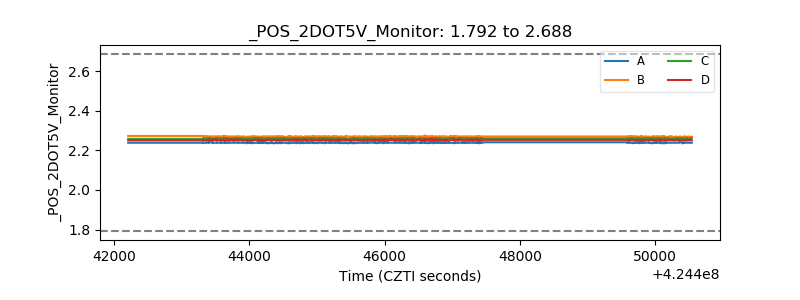 |
| +5 Volts monitor | 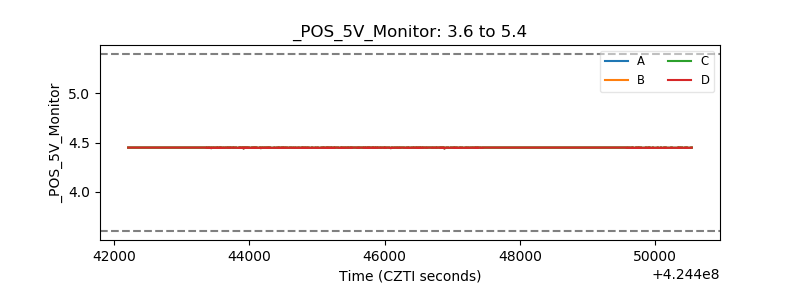 |
| _ROLL_ROT | 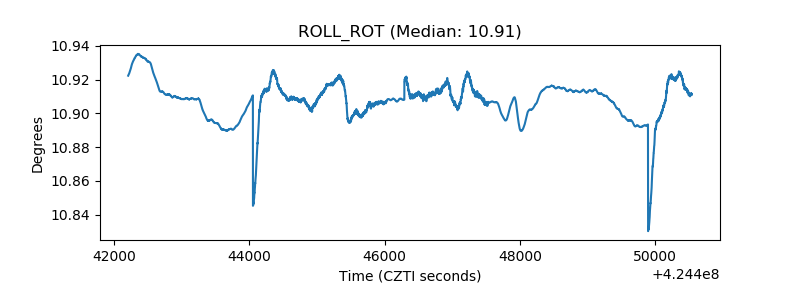 |
| _Roll_DEC | 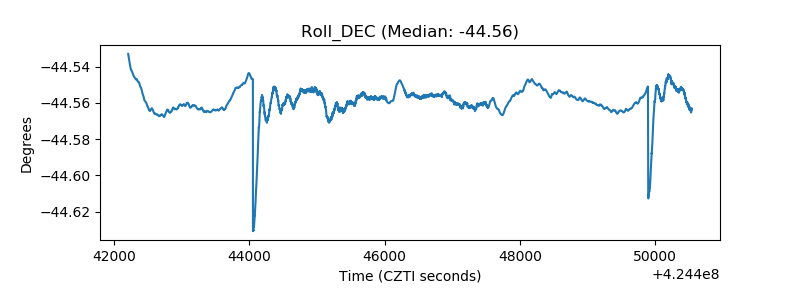 |
| _Roll_RA | 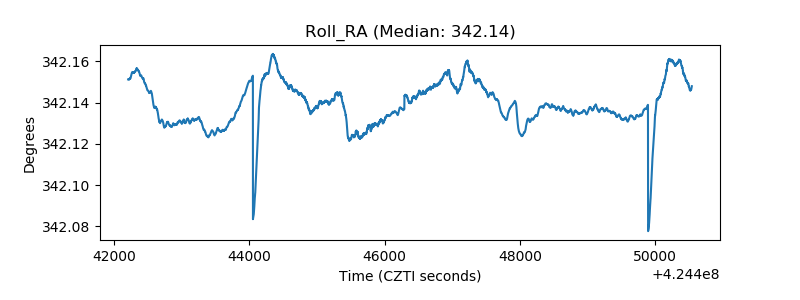 |
| Veto Counter | 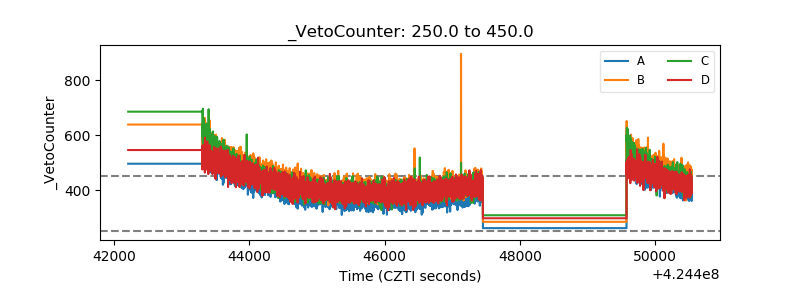 |