| Param | Original file | Final file |
|---|---|---|
| Filename | modeM0/AS1A12_035T02_9000005690_41693cztM0_level2.fits | modeM0/AS1A12_035T02_9000005690_41693cztM0_level2_quad_clean.evt |
| Size (bytes) | 339,114,240 | 86,639,040 |
| Size | 323.4 MB | 82.6 MB |
| Events in quadrant A | 2,768,280 | 605,352 |
| Events in quadrant B | 2,638,309 | 610,515 |
| Events in quadrant C | 2,754,457 | 554,223 |
| Events in quadrant D | 4,011,428 | 510,891 |
| Mode M9 | |||
|---|---|---|---|
| Quadrant | BADHDUFLAG | Total packets | Discarded packets |
| A | 0 | 34 | 0 |
| B | 0 | 35 | 0 |
| C | 0 | 35 | 0 |
| D | 0 | 35 | 0 |
| Mode M0 | |||
|---|---|---|---|
| Quadrant | BADHDUFLAG | Total packets | Discarded packets |
| A | 0 | 11130 | 5 |
| B | 0 | 11016 | 5 |
| C | 0 | 11106 | 6 |
| D | 0 | 15239 | 12 |
| Mode SS | |||
|---|---|---|---|
| Quadrant | BADHDUFLAG | Total packets | Discarded packets |
| A | 0 | 100 | 0 |
| B | 0 | 100 | 0 |
| C | 0 | 100 | 0 |
| D | 0 | 100 | 0 |
| Quadrant | Total seconds | Saturated seconds | Saturation percentage |
|---|---|---|---|
| A | 4883 | 17 | 0.348147% |
| B | 4882 | 45 | 0.921753% |
| C | 4881 | 175 | 3.585331% |
| D | 4878 | 354 | 7.257073% |
Noise dominated data is calculated using 1-second bins in cleaned event files. If a bin has >2000 counts, and if more than 50% of those come from <1% of pixels, then it is considered to be noise-dominated and hence unusable.
| Quadrant | # 1 sec bins | Bins with >0 counts | Bins with >2000 counts | High rate bins dominated by noise | Noise dominated (total time) | Noise dominated (detector-on time) | Marked lightcurve |
|---|---|---|---|---|---|---|---|
| A | 7039 | 4885 | 6 | 6 | 0.09% | 0.12% |  |
| B | 7039 | 4886 | 23 | 23 | 0.33% | 0.47% | 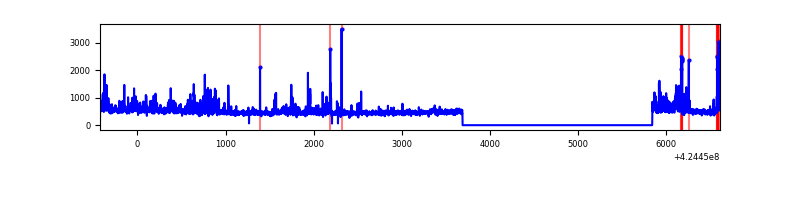 |
| C | 7039 | 4886 | 176 | 176 | 2.50% | 3.60% | 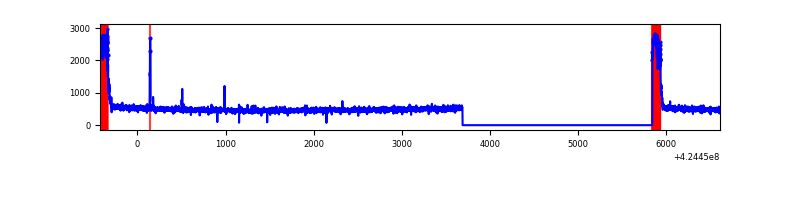 |
| D | 7039 | 4883 | 367 | 367 | 5.21% | 7.52% | 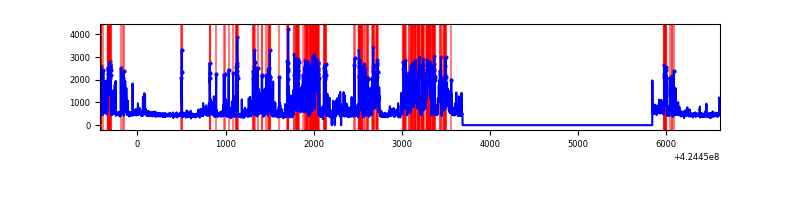 |
Top three noisy pixels from each quadrant. If the there are fewer than three noisy pixels in the level2.evt file, extra rows are filled as -1
| Pixel properties | Quadrant properties | ||||||
|---|---|---|---|---|---|---|---|
| Quadrant | DetID | PixID | Counts | Sigma | Mean | Median | Sigma |
| A | 10 | 83 | 533665 | 4671.35 | 569 | 560 | 114.1 |
| A | 13 | 254 | 7493 | 60.75 | 569 | 560 | 114.1 |
| A | 15 | 223 | 6480 | 51.87 | 569 | 560 | 114.1 |
| B | 0 | 190 | 207757 | 1923.31 | 564 | 549 | 107.7 |
| B | 5 | 255 | 81652 | 752.8 | 564 | 549 | 107.7 |
| B | 4 | 141 | 71794 | 661.29 | 564 | 549 | 107.7 |
| C | 0 | 10 | 438137 | 3514.49 | 538 | 542 | 124.5 |
| C | 15 | 214 | 197925 | 1585.26 | 538 | 542 | 124.5 |
| C | 15 | 111 | 13030 | 100.3 | 538 | 542 | 124.5 |
| D | 2 | 249 | 890014 | 6835.9 | 535 | 520 | 130.1 |
| D | 13 | 249 | 779445 | 5986.16 | 535 | 520 | 130.1 |
| D | 2 | 120 | 222868 | 1708.78 | 535 | 520 | 130.1 |
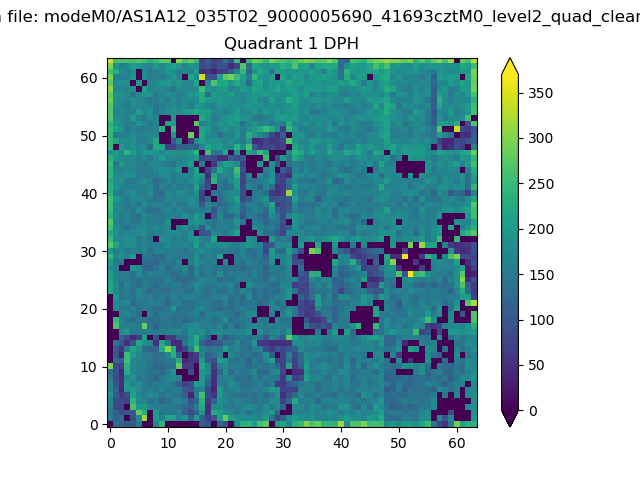
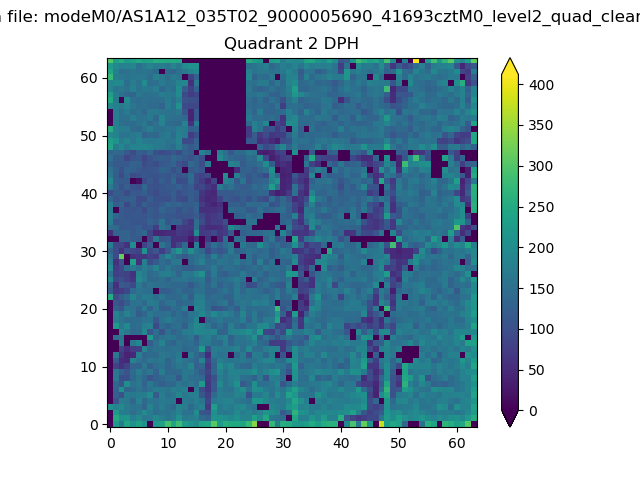
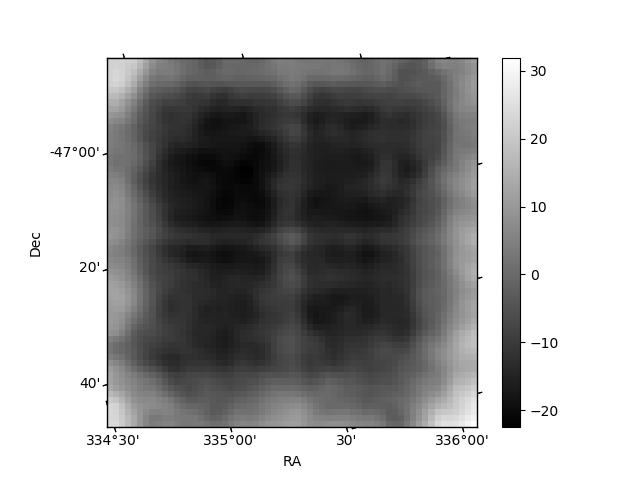
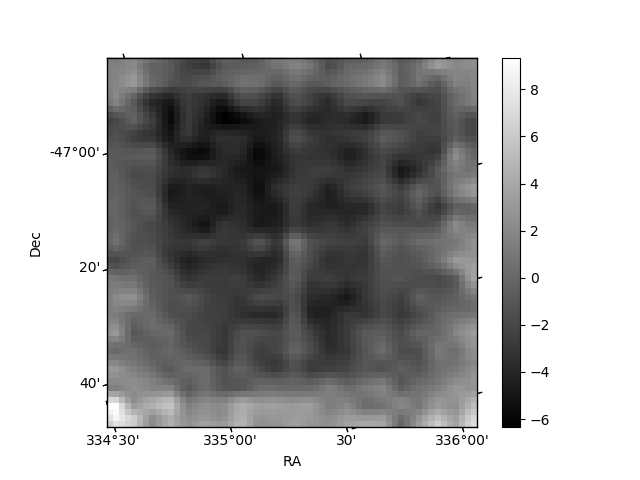
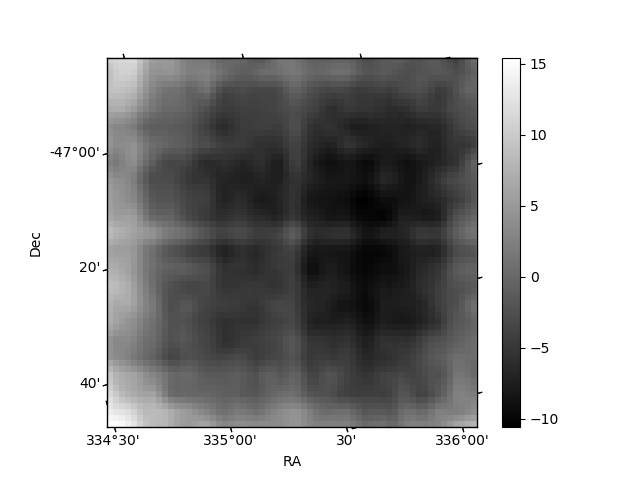
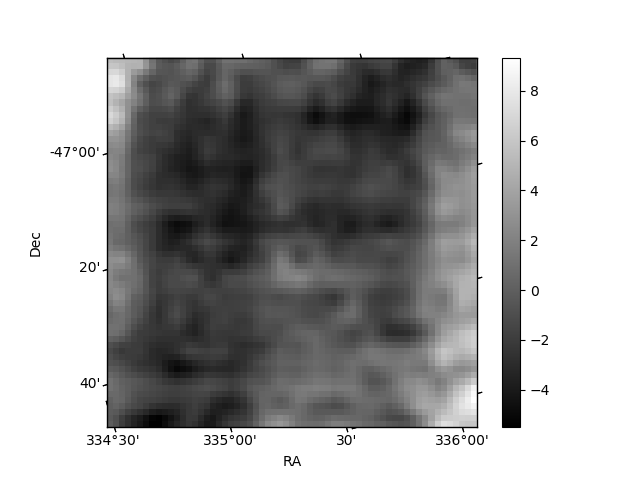
Histogram calculated using DETX and DETY for each event in the final _common_clean file
| Quadrant A | 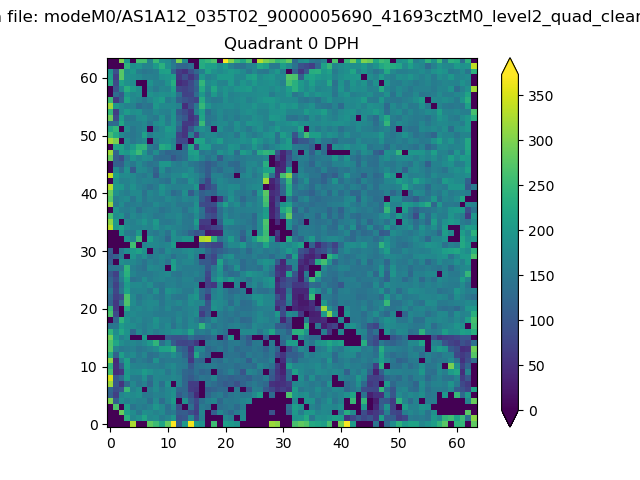 |
 |
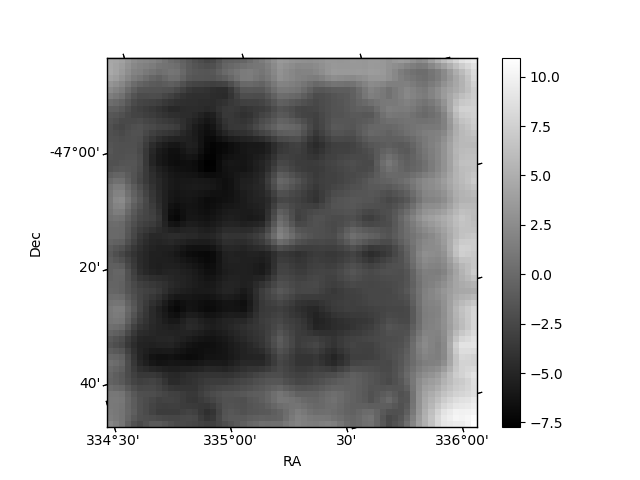
Quadrant B |
|---|---|---|---|
| Quadrant D | 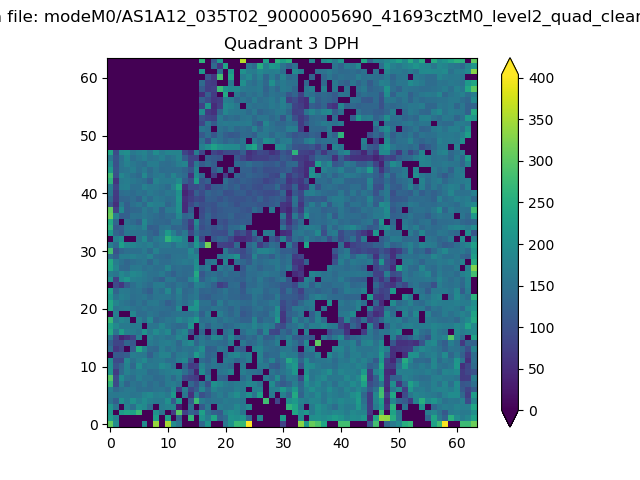 |
 |
Quadrant C |
| Plot type | Count rate plots | Images |
|---|---|---|
| Comparison with Poisson distribution Blue bars denote a histogram of data divided into 1 sec bins. Red curve is a Poisson curve with rate = median count rate of data. |
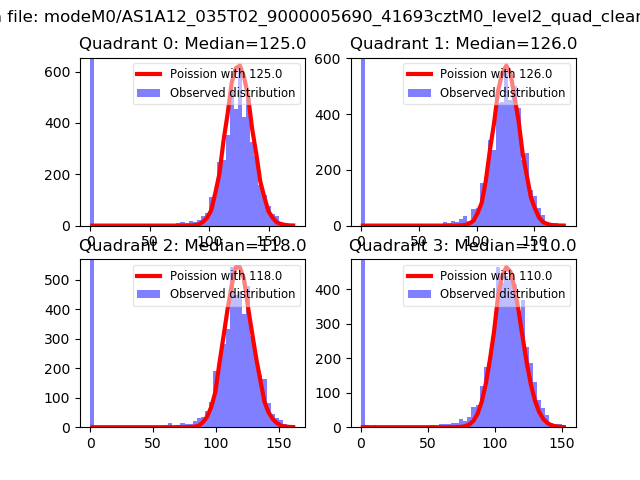 |
 |
| Quadrant-wise count rates Data is divided into 100 sec bins |
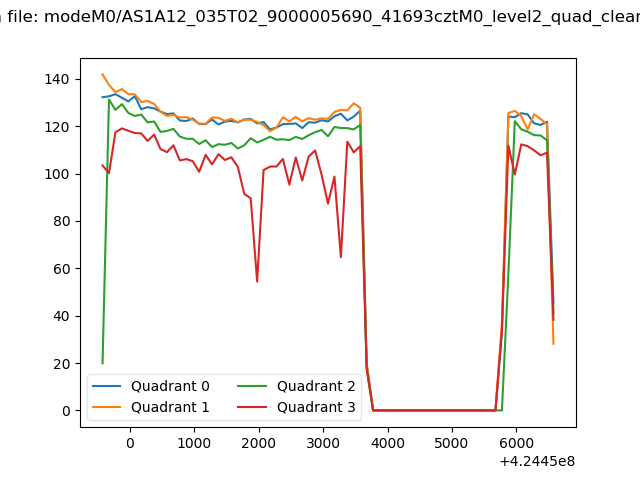 |
|
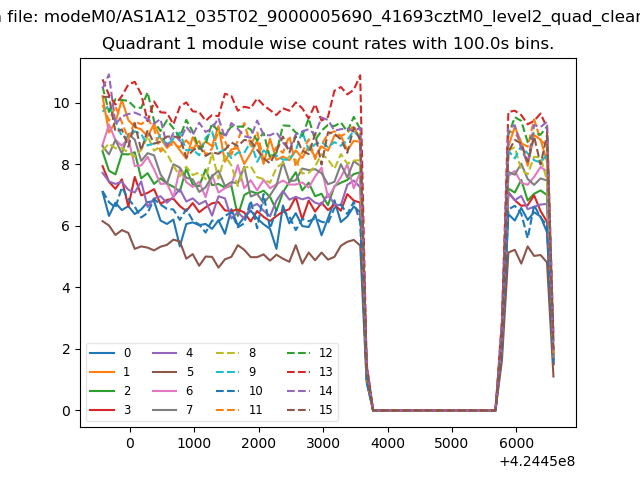
| Module-wise count rates for Quadrant A Data is divided into 100 sec bins |
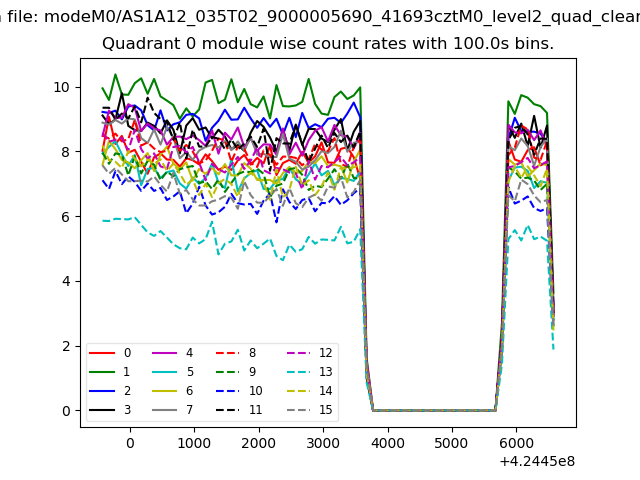 |
 |
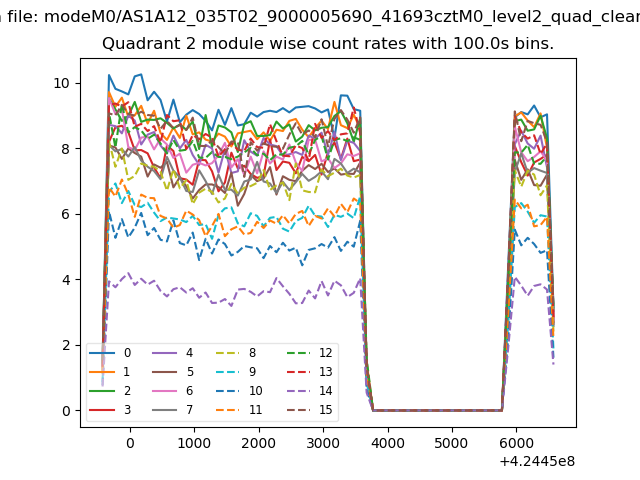
| Module-wise count rates for Quadrant B Data is divided into 100 sec bins |
 |
 |
| Module-wise count rates for Quadrant C Data is divided into 100 sec bins |
 |
 |
| Module-wise count rates for Quadrant D Data is divided into 100 sec bins |
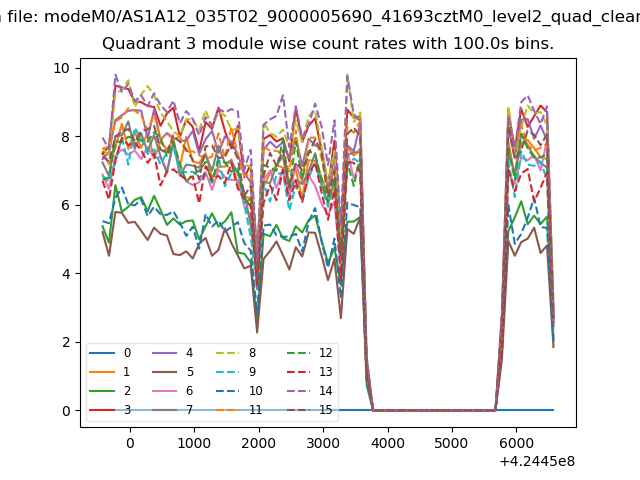 |
 |
| Parameter | Plot |
|---|---|
| CZT HV Monitor | 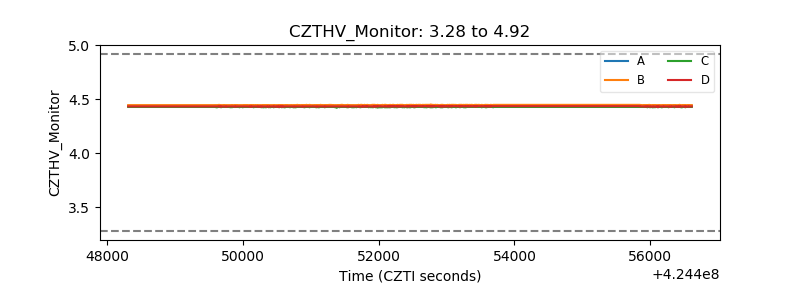 |
| D_VDD | 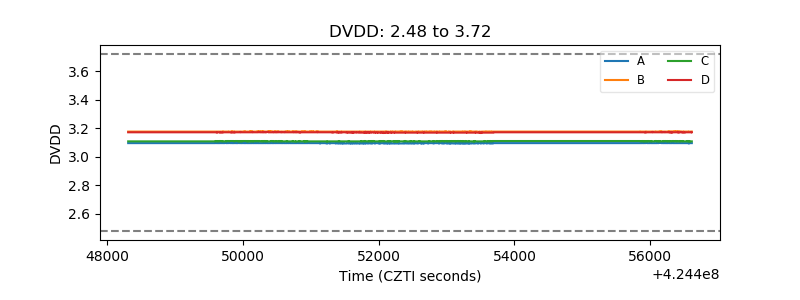 |
| Temperature 1 | 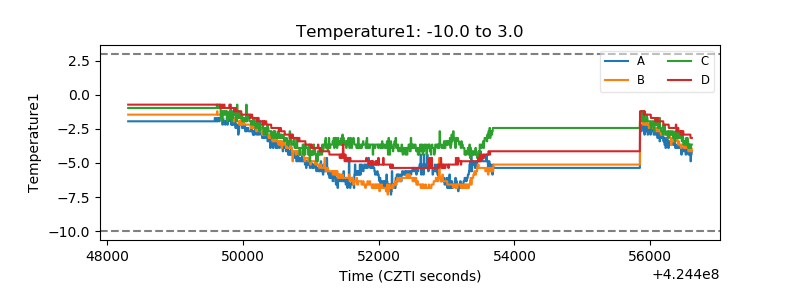 |
| Veto HV Monitor | 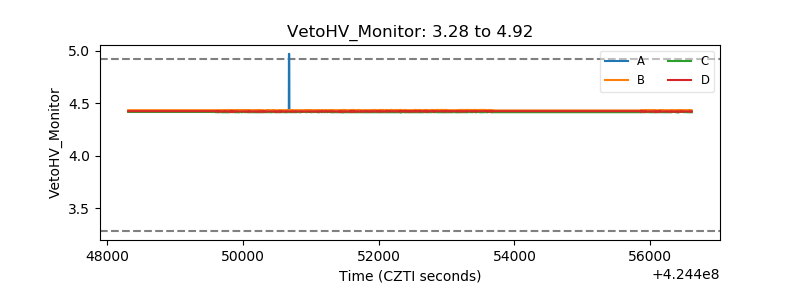 |
| Veto LLD | 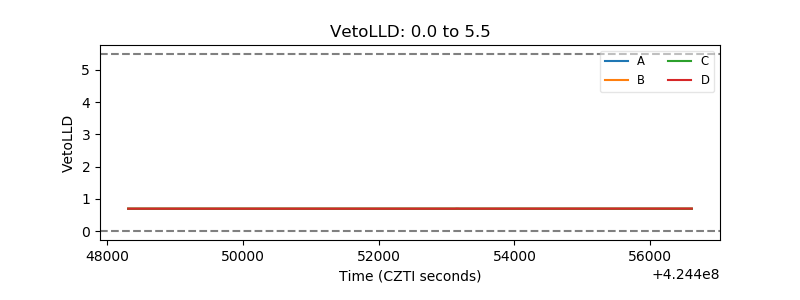 |
| Alpha Counter | 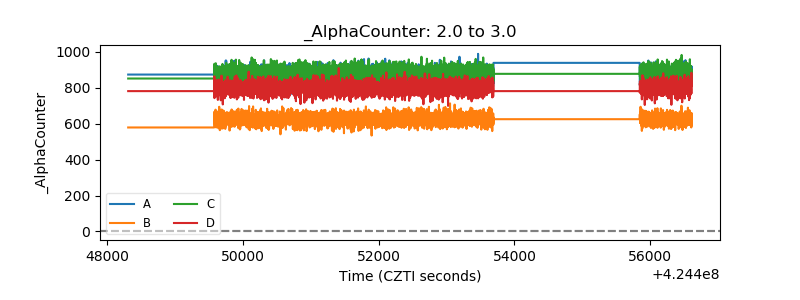 |
| _CPM_Rate |  |
| CZT Counter | 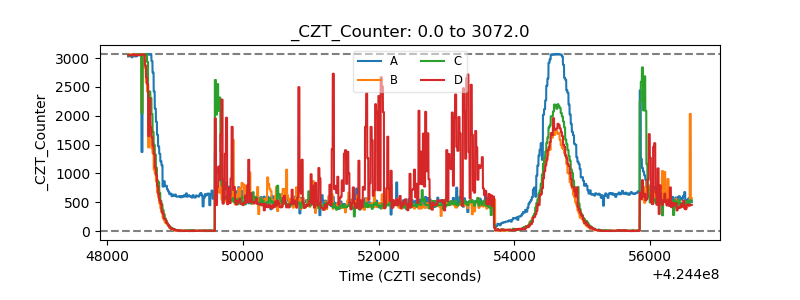 |
| +2.5 Volts monitor | 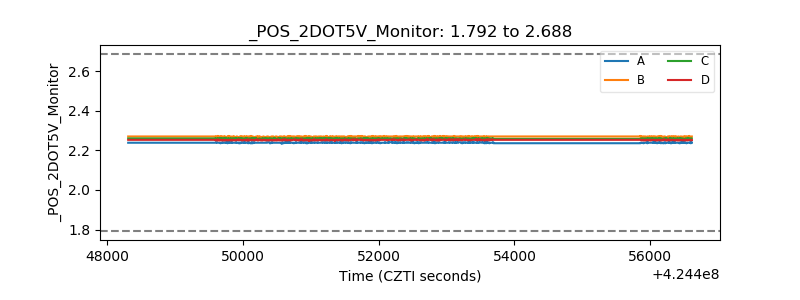 |
| +5 Volts monitor | 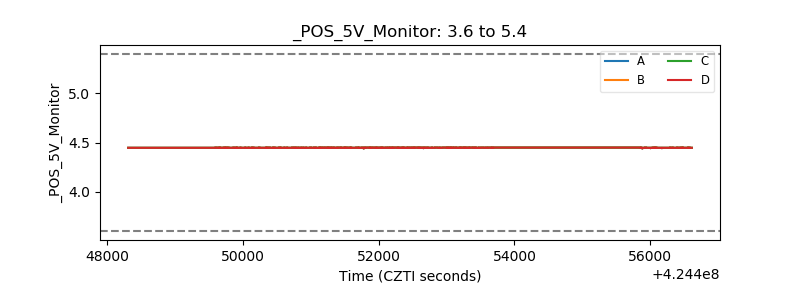 |
| _ROLL_ROT | 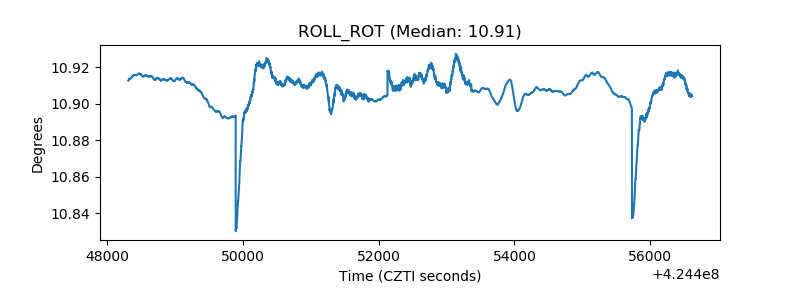 |
| _Roll_DEC | 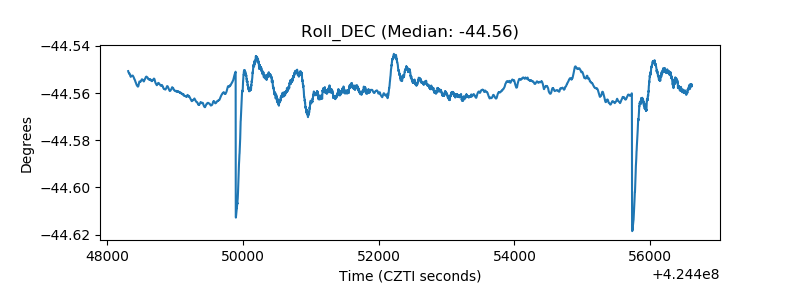 |
| _Roll_RA | 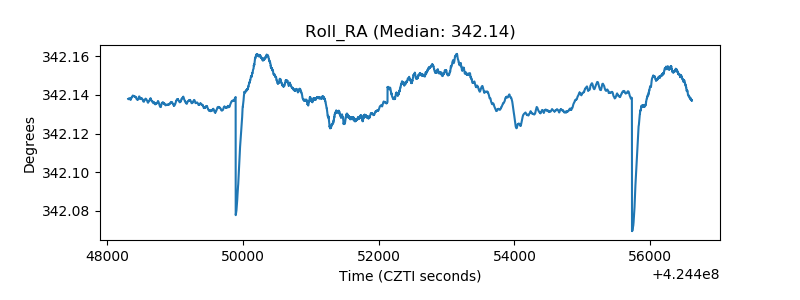 |
| Veto Counter | 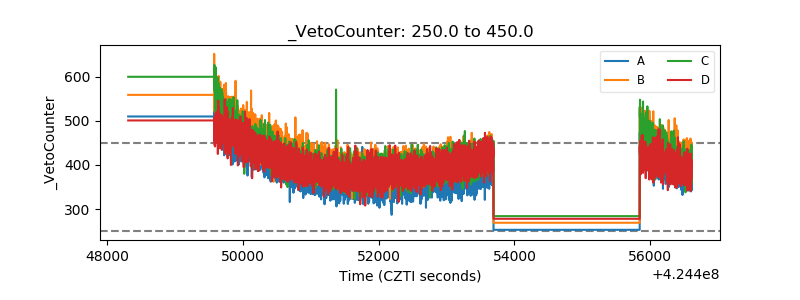 |