| Param | Original file | Final file |
|---|---|---|
| Filename | modeM0/AS1A12_035T02_9000005690_41694cztM0_level2.fits | modeM0/AS1A12_035T02_9000005690_41694cztM0_level2_quad_clean.evt |
| Size (bytes) | 338,388,480 | 84,355,200 |
| Size | 322.7 MB | 80.4 MB |
| Events in quadrant A | 2,763,982 | 593,098 |
| Events in quadrant B | 2,520,756 | 597,255 |
| Events in quadrant C | 2,802,330 | 543,195 |
| Events in quadrant D | 4,046,404 | 468,079 |
| Mode M9 | |||
|---|---|---|---|
| Quadrant | BADHDUFLAG | Total packets | Discarded packets |
| A | 0 | 34 | 0 |
| B | 0 | 35 | 0 |
| C | 0 | 35 | 0 |
| D | 0 | 35 | 0 |
| Mode M0 | |||
|---|---|---|---|
| Quadrant | BADHDUFLAG | Total packets | Discarded packets |
| A | 0 | 11254 | 2 |
| B | 0 | 10917 | 2 |
| C | 0 | 11489 | 2 |
| D | 0 | 15488 | 2 |
| Mode SS | |||
|---|---|---|---|
| Quadrant | BADHDUFLAG | Total packets | Discarded packets |
| A | 0 | 102 | 0 |
| B | 0 | 102 | 0 |
| C | 0 | 102 | 0 |
| D | 0 | 102 | 0 |
| Quadrant | Total seconds | Saturated seconds | Saturation percentage |
|---|---|---|---|
| A | 5033 | 14 | 0.278164% |
| B | 5033 | 44 | 0.874230% |
| C | 5033 | 196 | 3.894298% |
| D | 5033 | 663 | 13.173058% |
Noise dominated data is calculated using 1-second bins in cleaned event files. If a bin has >2000 counts, and if more than 50% of those come from <1% of pixels, then it is considered to be noise-dominated and hence unusable.
| Quadrant | # 1 sec bins | Bins with >0 counts | Bins with >2000 counts | High rate bins dominated by noise | Noise dominated (total time) | Noise dominated (detector-on time) | Marked lightcurve |
|---|---|---|---|---|---|---|---|
| A | 7097 | 5034 | 9 | 9 | 0.13% | 0.18% | 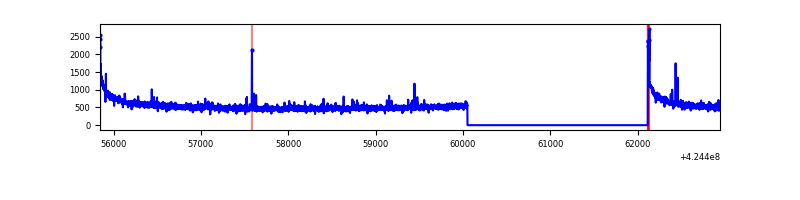 |
| B | 7097 | 5034 | 30 | 30 | 0.42% | 0.60% | 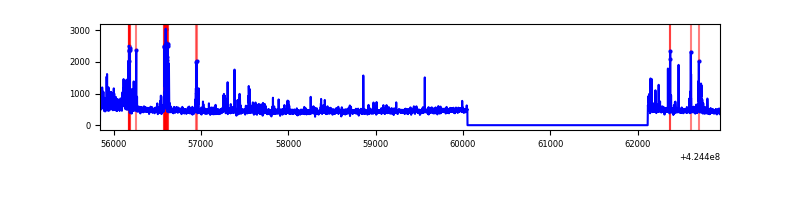 |
| C | 7097 | 5034 | 198 | 198 | 2.79% | 3.93% | 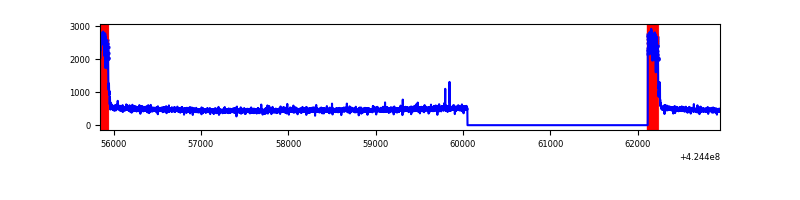 |
| D | 7097 | 5034 | 650 | 650 | 9.16% | 12.91% | 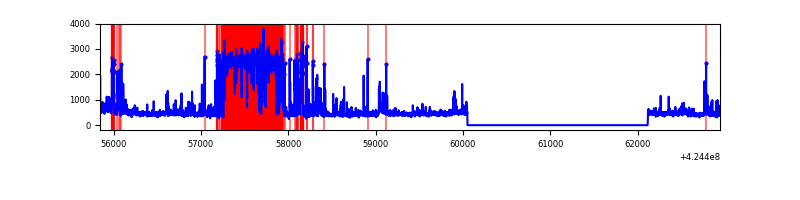 |
Top three noisy pixels from each quadrant. If the there are fewer than three noisy pixels in the level2.evt file, extra rows are filled as -1
| Pixel properties | Quadrant properties | ||||||
|---|---|---|---|---|---|---|---|
| Quadrant | DetID | PixID | Counts | Sigma | Mean | Median | Sigma |
| A | 10 | 83 | 529119 | 4601.04 | 564 | 554 | 114.9 |
| A | 13 | 248 | 18131 | 153.0 | 564 | 554 | 114.9 |
| A | 15 | 223 | 17242 | 145.27 | 564 | 554 | 114.9 |
| B | 4 | 141 | 143315 | 1329.86 | 560 | 545 | 107.4 |
| B | 0 | 190 | 86434 | 800.03 | 560 | 545 | 107.4 |
| B | 5 | 255 | 45084 | 414.87 | 560 | 545 | 107.4 |
| C | 0 | 10 | 503836 | 4003.27 | 535 | 539 | 125.7 |
| C | 15 | 214 | 202555 | 1606.85 | 535 | 539 | 125.7 |
| C | 15 | 159 | 4666 | 32.83 | 535 | 539 | 125.7 |
| D | 2 | 249 | 1735041 | 13909.92 | 511 | 498 | 124.7 |
| D | 2 | 120 | 159916 | 1278.43 | 511 | 498 | 124.7 |
| D | 13 | 249 | 136444 | 1090.2 | 511 | 498 | 124.7 |
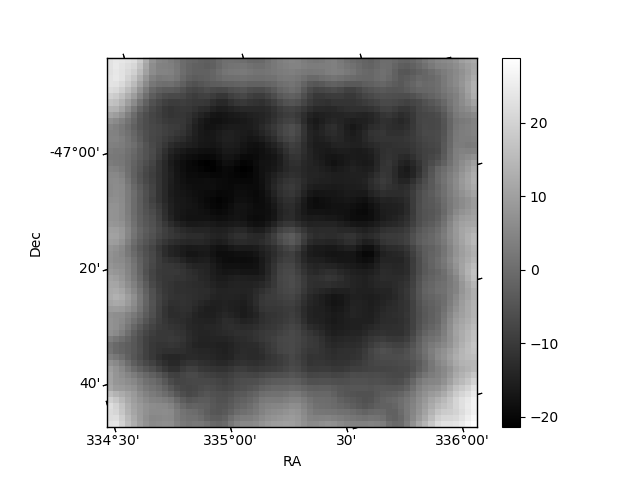
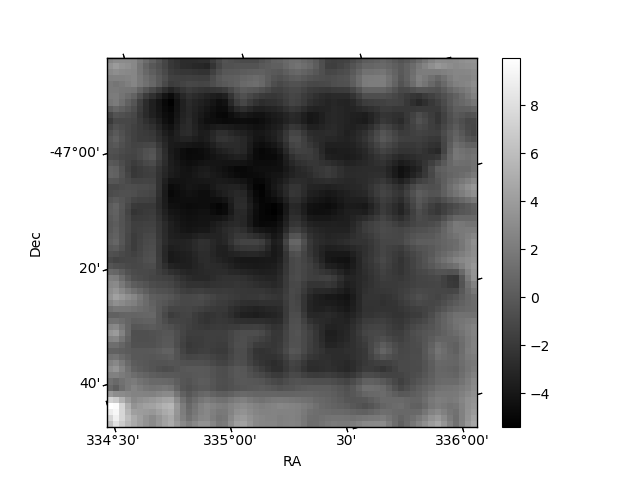
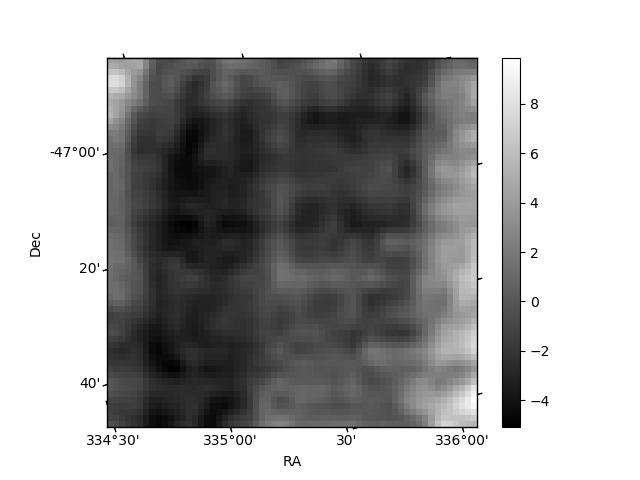
Histogram calculated using DETX and DETY for each event in the final _common_clean file
| Quadrant A | 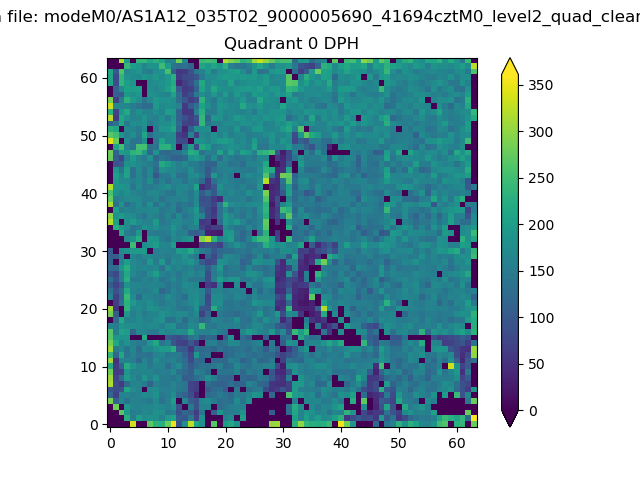 |
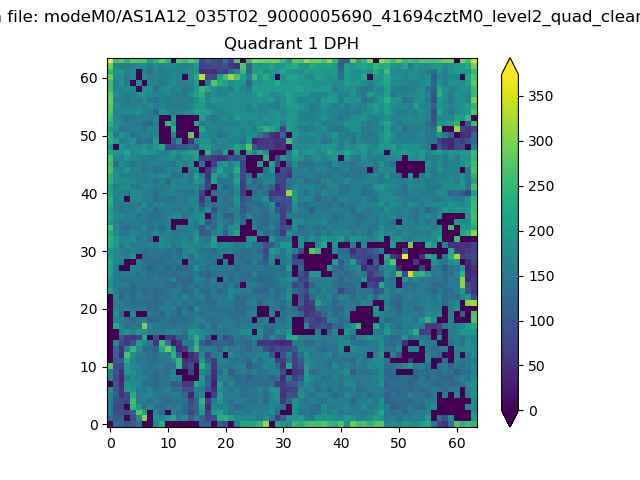 |
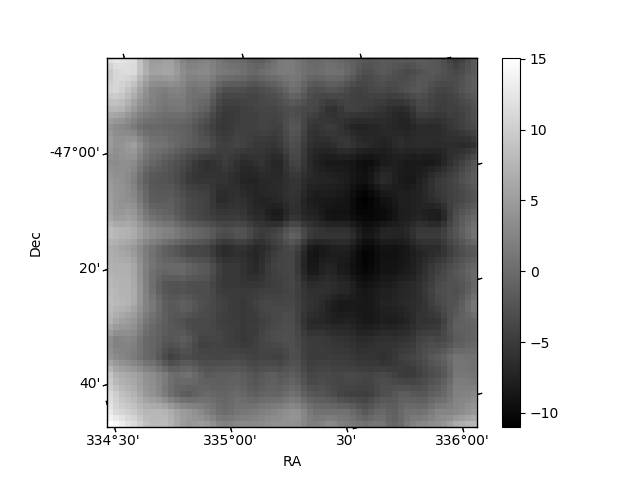
Quadrant B |
|---|---|---|---|
| Quadrant D | 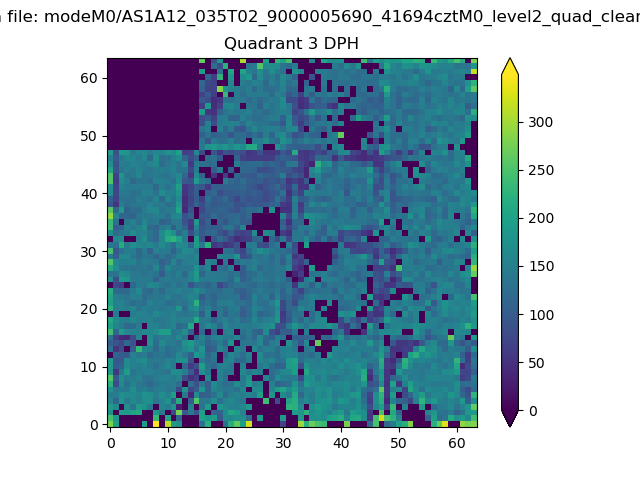 |
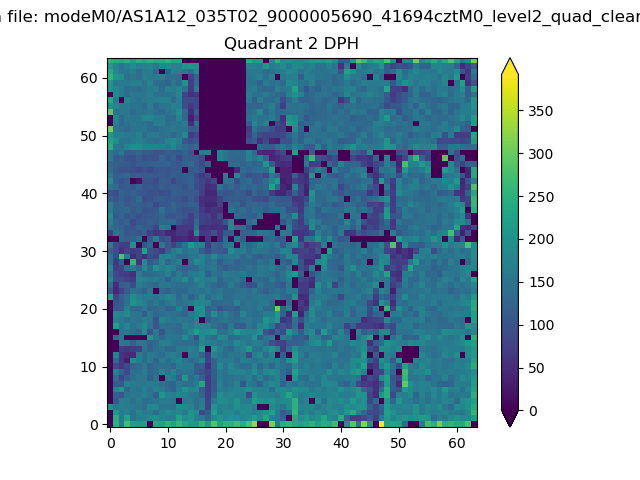 |
Quadrant C |
| Plot type | Count rate plots | Images |
|---|---|---|
| Comparison with Poisson distribution Blue bars denote a histogram of data divided into 1 sec bins. Red curve is a Poisson curve with rate = median count rate of data. |
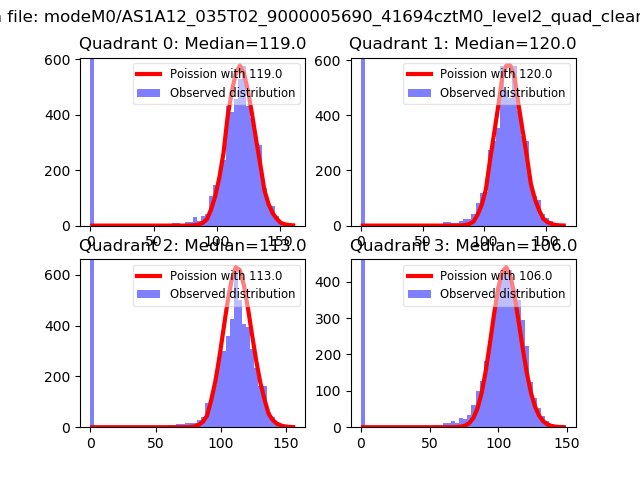 |
 |
| Quadrant-wise count rates Data is divided into 100 sec bins |
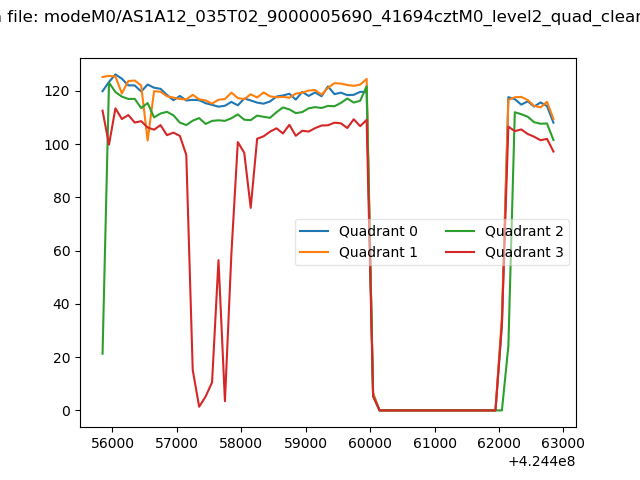 |
|
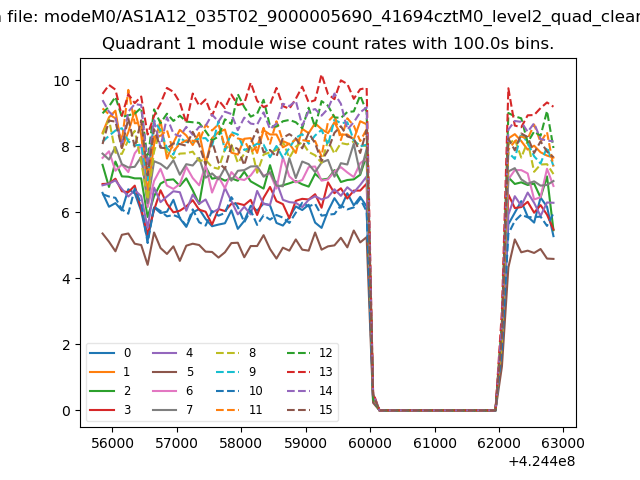
| Module-wise count rates for Quadrant A Data is divided into 100 sec bins |
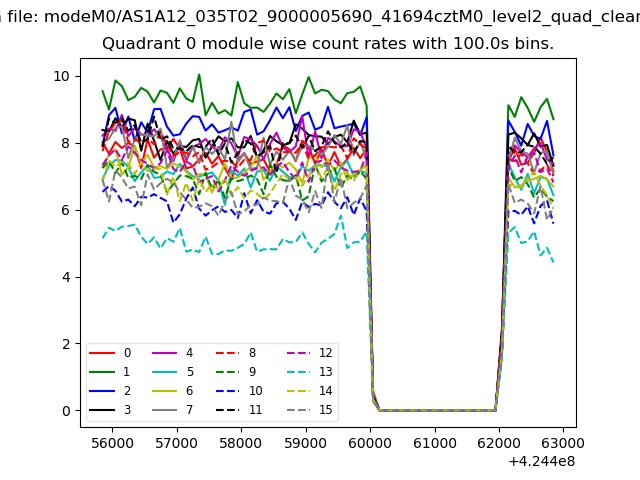 |
 |
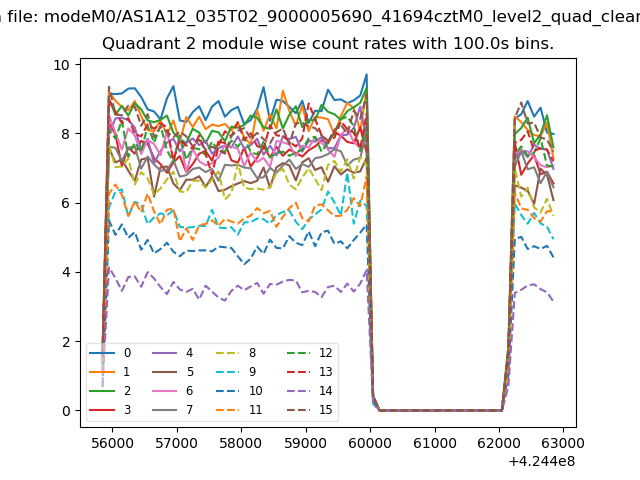
| Module-wise count rates for Quadrant B Data is divided into 100 sec bins |
 |
 |
| Module-wise count rates for Quadrant C Data is divided into 100 sec bins |
 |
 |
| Module-wise count rates for Quadrant D Data is divided into 100 sec bins |
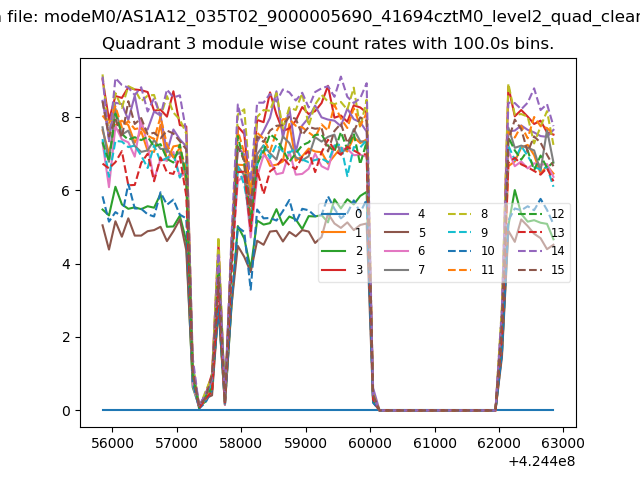 |
 |
| Parameter | Plot |
|---|---|
| CZT HV Monitor | 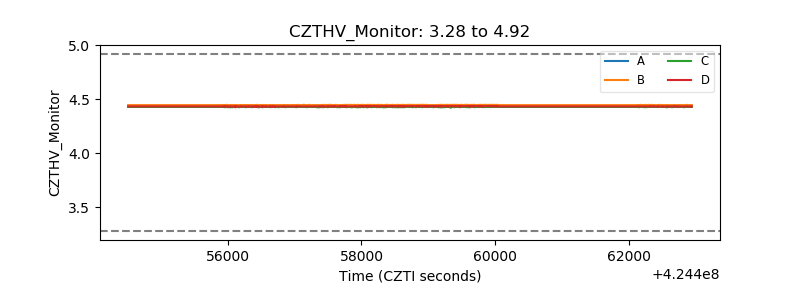 |
| D_VDD | 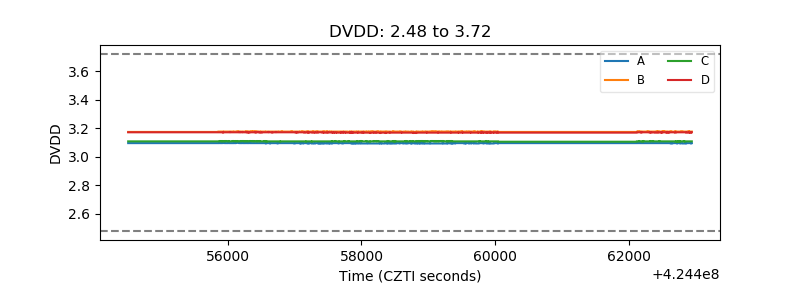 |
| Temperature 1 | 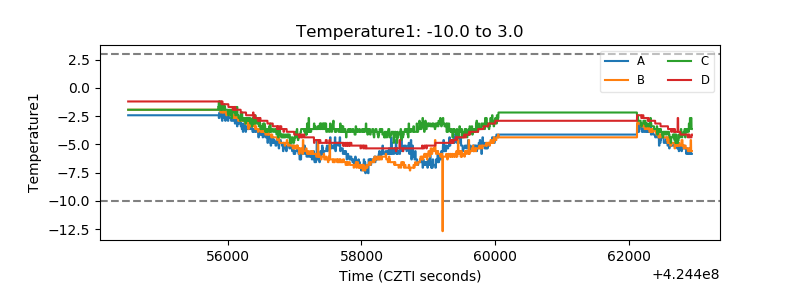 |
| Veto HV Monitor | 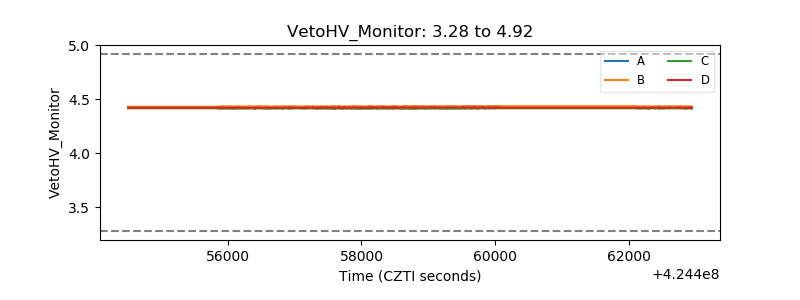 |
| Veto LLD | 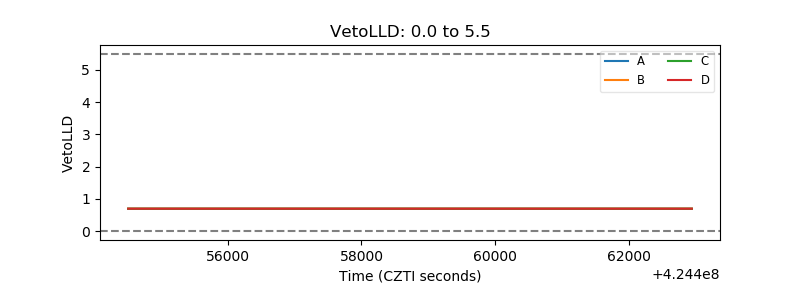 |
| Alpha Counter | 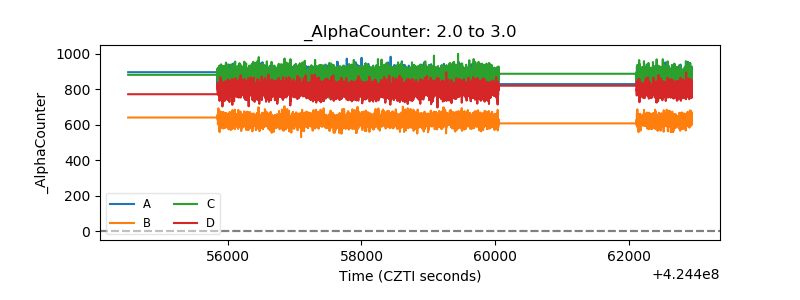 |
| _CPM_Rate | 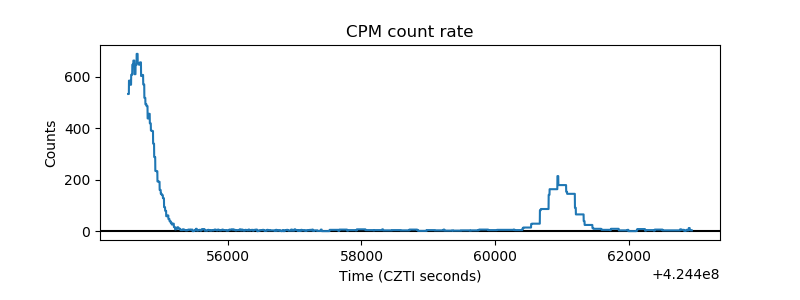 |
| CZT Counter | 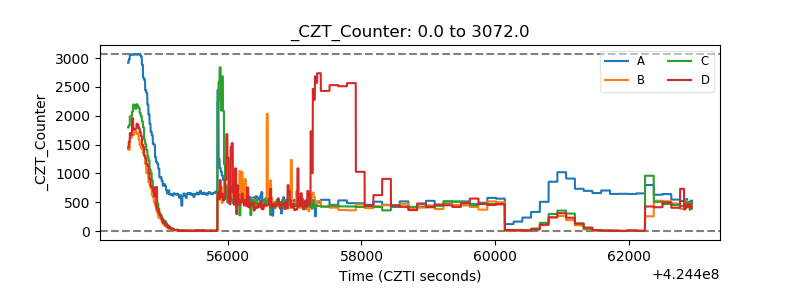 |
| +2.5 Volts monitor | 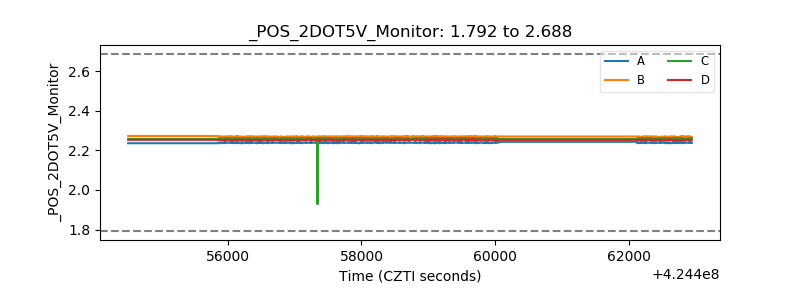 |
| +5 Volts monitor |  |
| _ROLL_ROT | 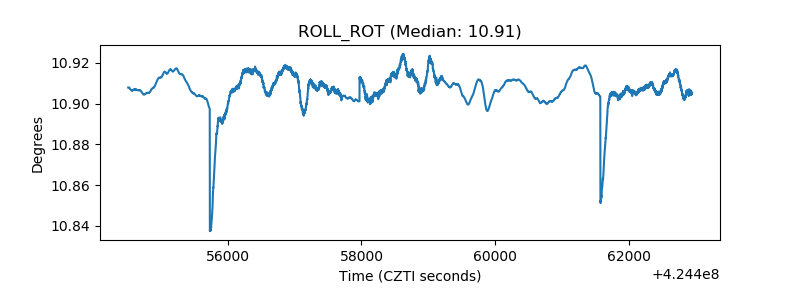 |
| _Roll_DEC | 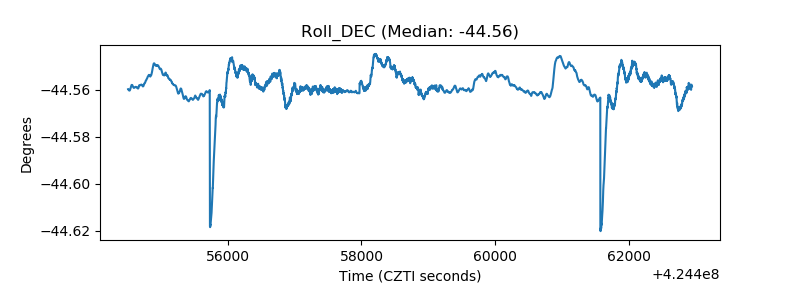 |
| _Roll_RA | 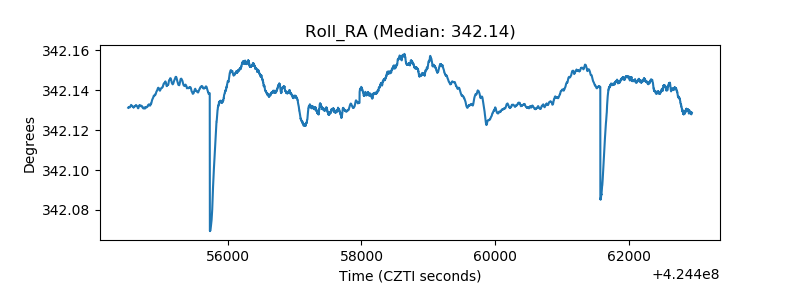 |
| Veto Counter | 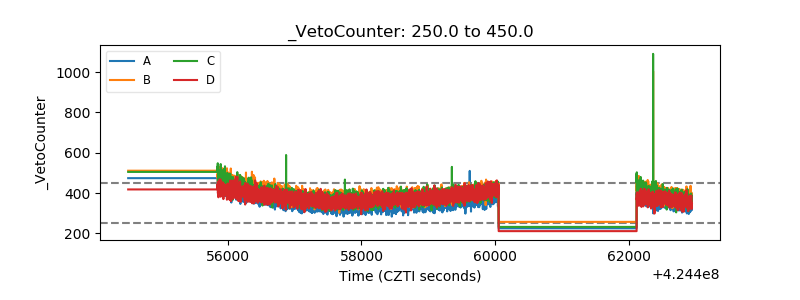 |