| Param | Original file | Final file |
|---|---|---|
| Filename | modeM0/AS1A12_035T02_9000005690_41695cztM0_level2.fits | modeM0/AS1A12_035T02_9000005690_41695cztM0_level2_quad_clean.evt |
| Size (bytes) | 326,105,280 | 88,355,520 |
| Size | 311.0 MB | 84.3 MB |
| Events in quadrant A | 2,833,497 | 603,593 |
| Events in quadrant B | 2,566,768 | 608,867 |
| Events in quadrant C | 2,864,555 | 561,682 |
| Events in quadrant D | 3,391,035 | 528,415 |
| Mode M9 | |||
|---|---|---|---|
| Quadrant | BADHDUFLAG | Total packets | Discarded packets |
| A | 0 | 32 | 0 |
| B | 0 | 33 | 0 |
| C | 0 | 33 | 0 |
| D | 0 | 33 | 0 |
| Mode M0 | |||
|---|---|---|---|
| Quadrant | BADHDUFLAG | Total packets | Discarded packets |
| A | 0 | 11655 | 2 |
| B | 0 | 11358 | 2 |
| C | 0 | 11937 | 2 |
| D | 0 | 13864 | 2 |
| Mode SS | |||
|---|---|---|---|
| Quadrant | BADHDUFLAG | Total packets | Discarded packets |
| A | 0 | 108 | 0 |
| B | 0 | 108 | 0 |
| C | 0 | 108 | 0 |
| D | 0 | 108 | 0 |
| Quadrant | Total seconds | Saturated seconds | Saturation percentage |
|---|---|---|---|
| A | 5329 | 13 | 0.243948% |
| B | 5329 | 48 | 0.900732% |
| C | 5329 | 173 | 3.246388% |
| D | 5329 | 190 | 3.565397% |
Noise dominated data is calculated using 1-second bins in cleaned event files. If a bin has >2000 counts, and if more than 50% of those come from <1% of pixels, then it is considered to be noise-dominated and hence unusable.
| Quadrant | # 1 sec bins | Bins with >0 counts | Bins with >2000 counts | High rate bins dominated by noise | Noise dominated (total time) | Noise dominated (detector-on time) | Marked lightcurve |
|---|---|---|---|---|---|---|---|
| A | 7122 | 5330 | 7 | 7 | 0.10% | 0.13% | 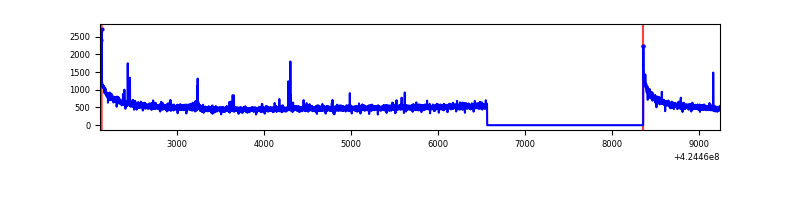 |
| B | 7122 | 5330 | 37 | 37 | 0.52% | 0.69% | 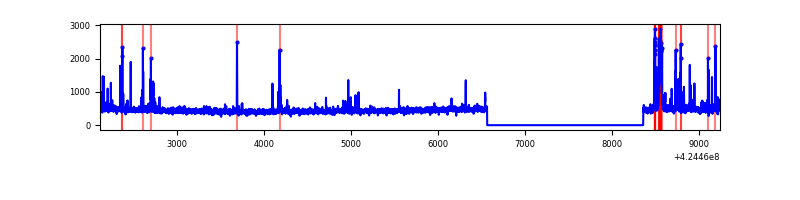 |
| C | 7122 | 5330 | 167 | 167 | 2.34% | 3.13% | 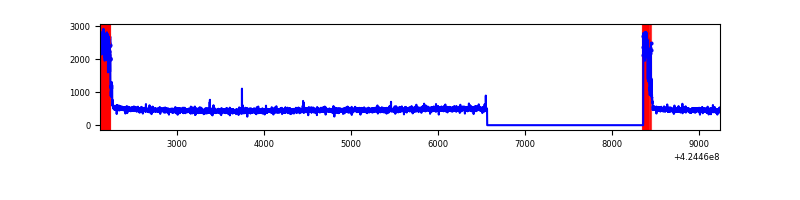 |
| D | 7122 | 5330 | 191 | 191 | 2.68% | 3.58% | 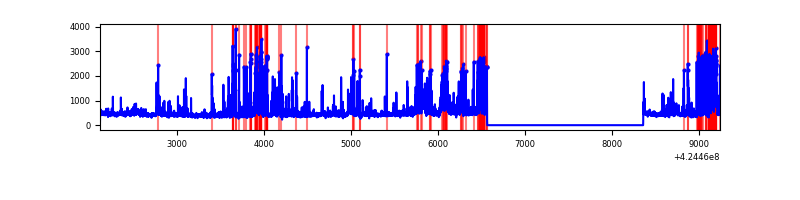 |
Top three noisy pixels from each quadrant. If the there are fewer than three noisy pixels in the level2.evt file, extra rows are filled as -1
| Pixel properties | Quadrant properties | ||||||
|---|---|---|---|---|---|---|---|
| Quadrant | DetID | PixID | Counts | Sigma | Mean | Median | Sigma |
| A | 10 | 83 | 530924 | 4424.61 | 583 | 570 | 119.9 |
| A | 15 | 223 | 29386 | 240.4 | 583 | 570 | 119.9 |
| A | 13 | 248 | 12534 | 99.81 | 583 | 570 | 119.9 |
| B | 4 | 171 | 109225 | 966.44 | 580 | 564 | 112.4 |
| B | 5 | 255 | 99746 | 882.13 | 580 | 564 | 112.4 |
| B | 4 | 141 | 46085 | 404.87 | 580 | 564 | 112.4 |
| C | 0 | 10 | 460530 | 3497.43 | 560 | 564 | 131.5 |
| C | 15 | 214 | 214966 | 1630.24 | 560 | 564 | 131.5 |
| C | 15 | 159 | 4688 | 31.36 | 560 | 564 | 131.5 |
| D | 2 | 249 | 735618 | 5323.38 | 564 | 548 | 138.1 |
| D | 13 | 249 | 417119 | 3016.81 | 564 | 548 | 138.1 |
| D | 2 | 234 | 26858 | 190.54 | 564 | 548 | 138.1 |
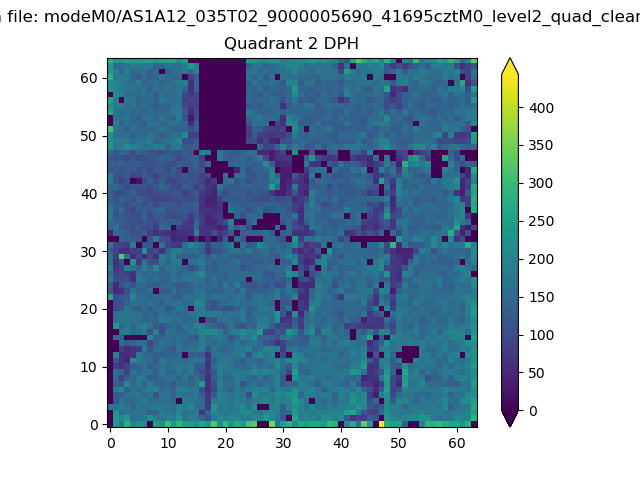
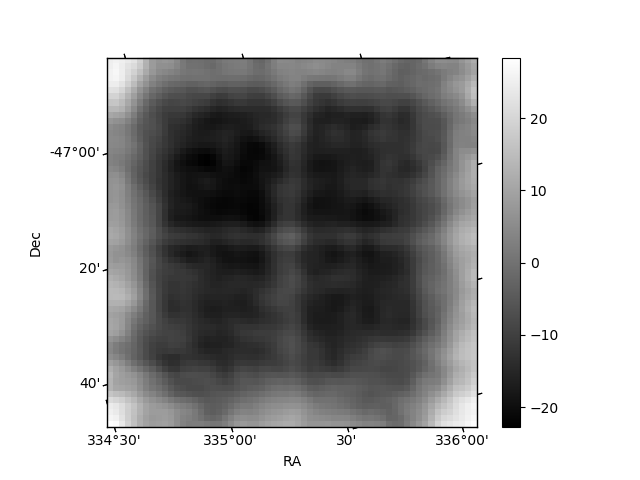
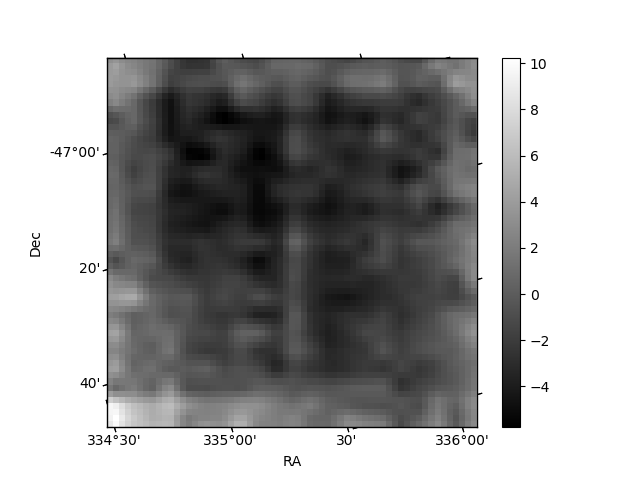
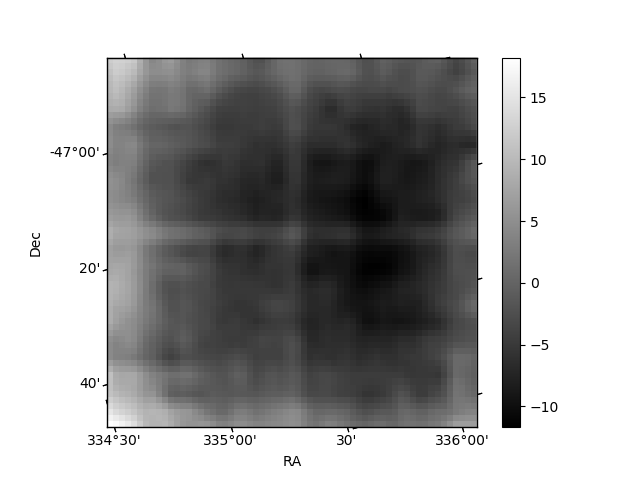
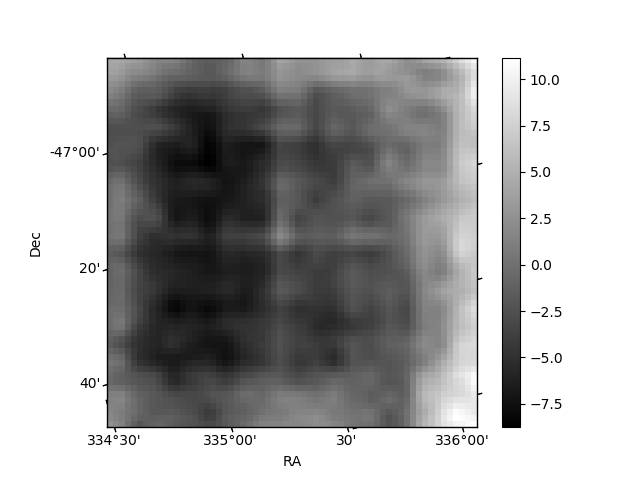
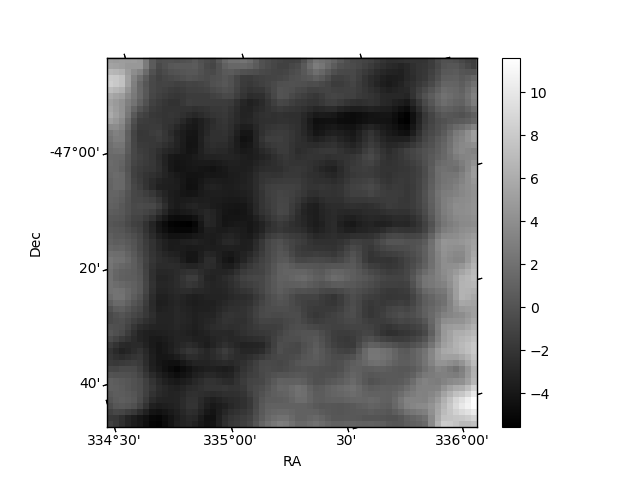
Histogram calculated using DETX and DETY for each event in the final _common_clean file
| Quadrant A | 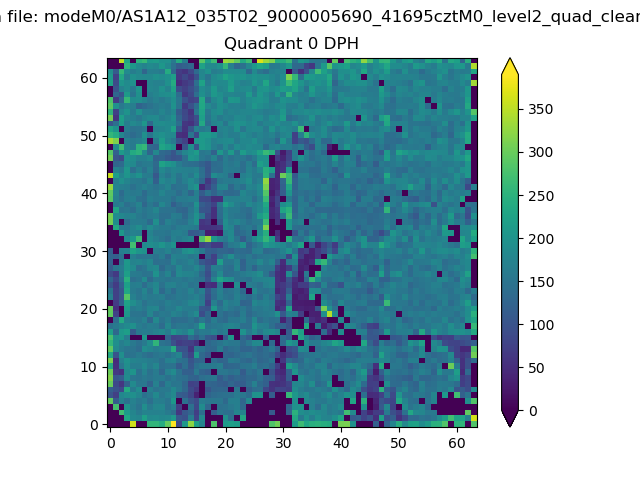 |
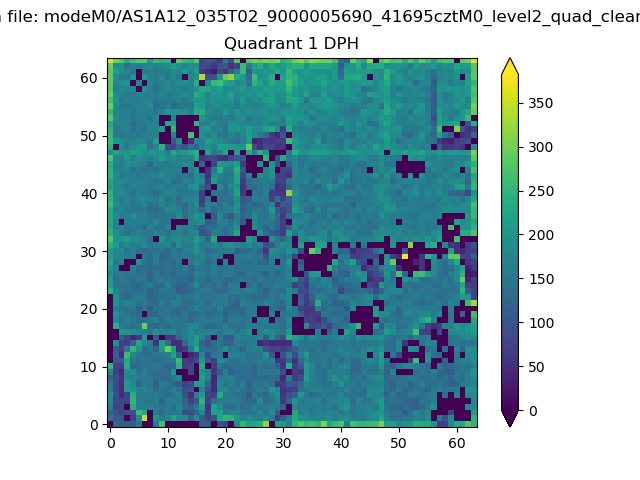 |
Quadrant B |
|---|---|---|---|
| Quadrant D | 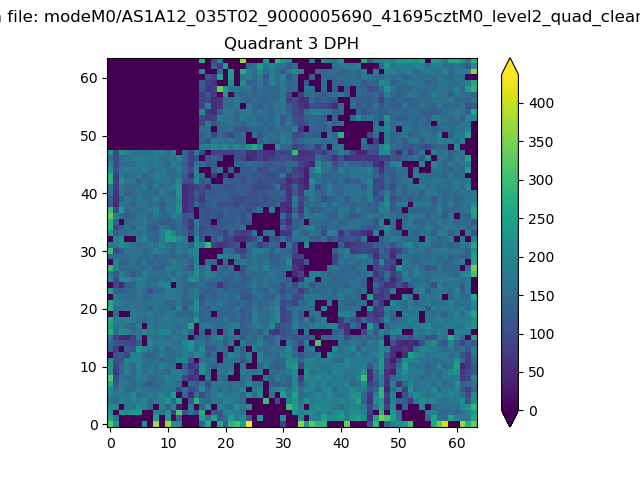 |
 |
Quadrant C |
| Plot type | Count rate plots | Images |
|---|---|---|
| Comparison with Poisson distribution Blue bars denote a histogram of data divided into 1 sec bins. Red curve is a Poisson curve with rate = median count rate of data. |
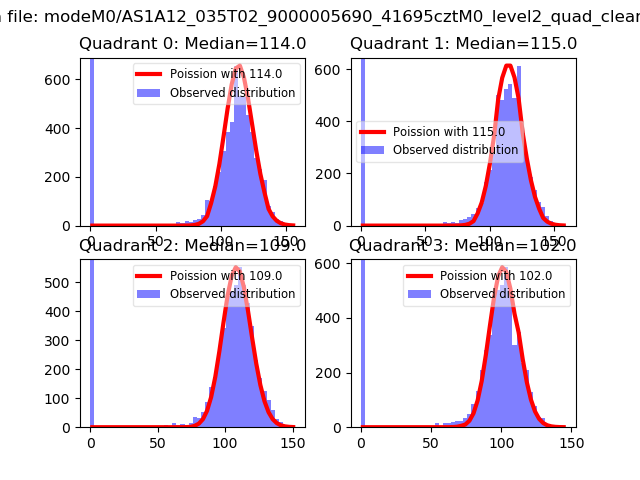 |
 |
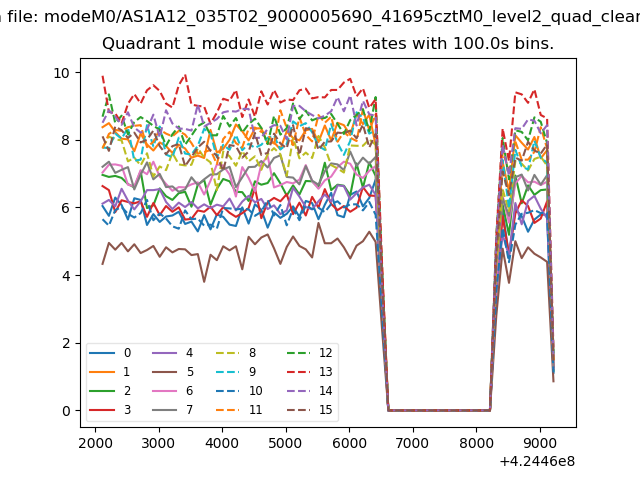
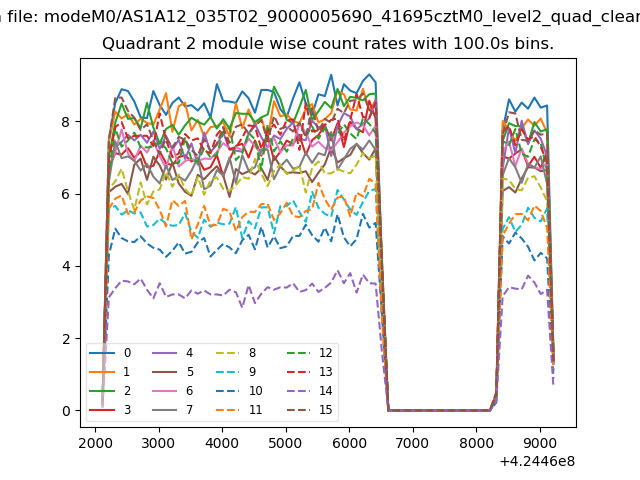
| Quadrant-wise count rates Data is divided into 100 sec bins |
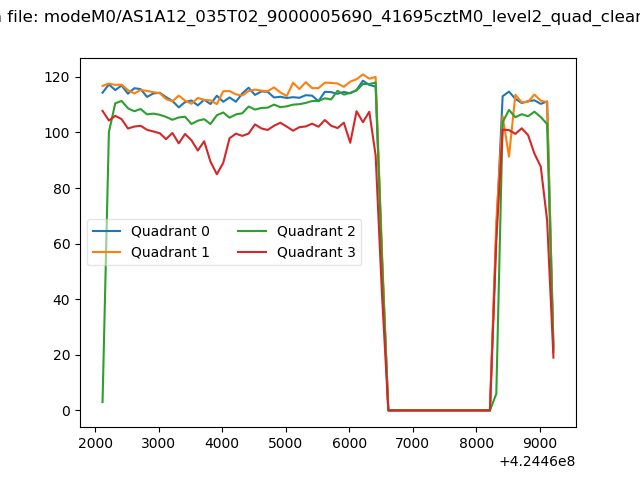 |
|
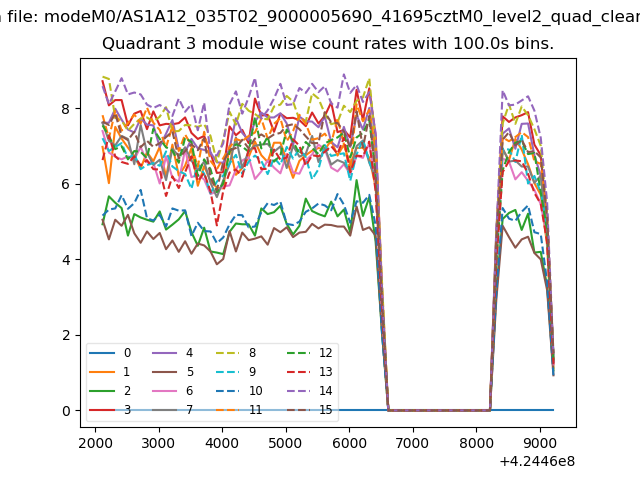
| Module-wise count rates for Quadrant A Data is divided into 100 sec bins |
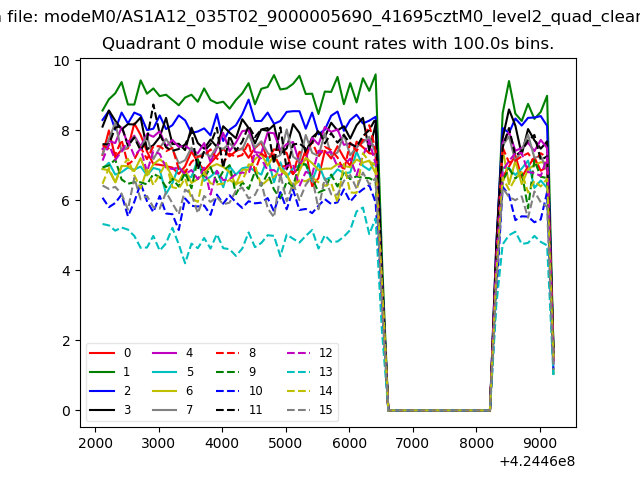 |
 |
| Module-wise count rates for Quadrant B Data is divided into 100 sec bins |
 |
 |
| Module-wise count rates for Quadrant C Data is divided into 100 sec bins |
 |
 |
| Module-wise count rates for Quadrant D Data is divided into 100 sec bins |
 |
 |
| Parameter | Plot |
|---|---|
| CZT HV Monitor | 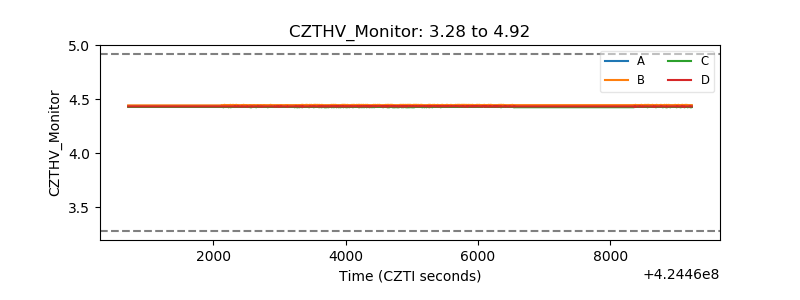 |
| D_VDD | 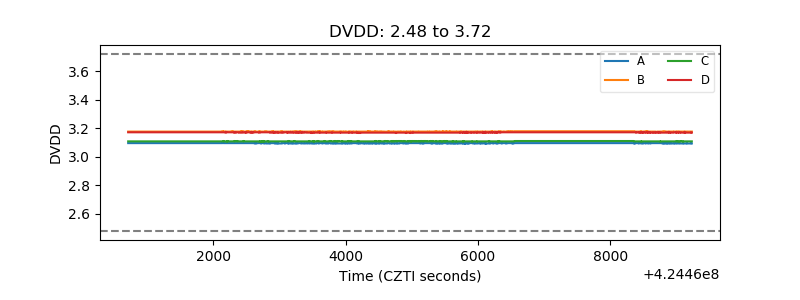 |
| Temperature 1 | 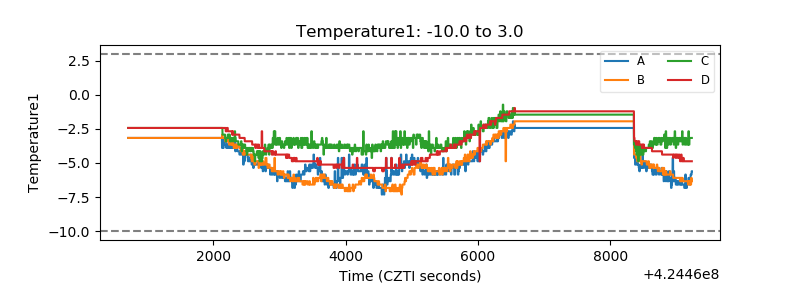 |
| Veto HV Monitor | 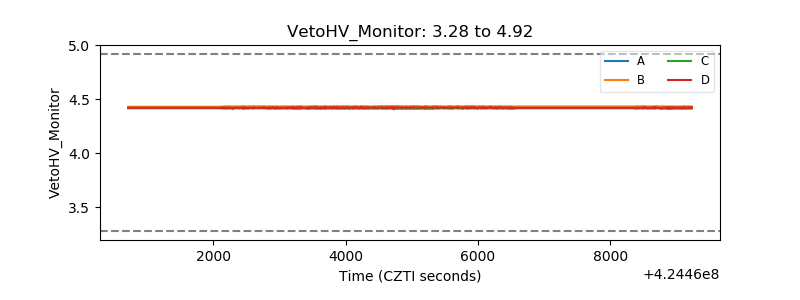 |
| Veto LLD | 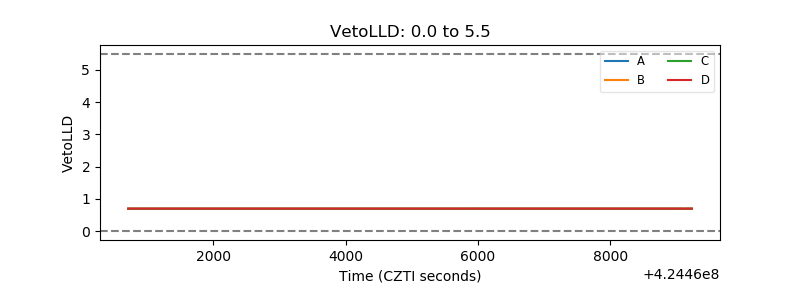 |
| Alpha Counter | 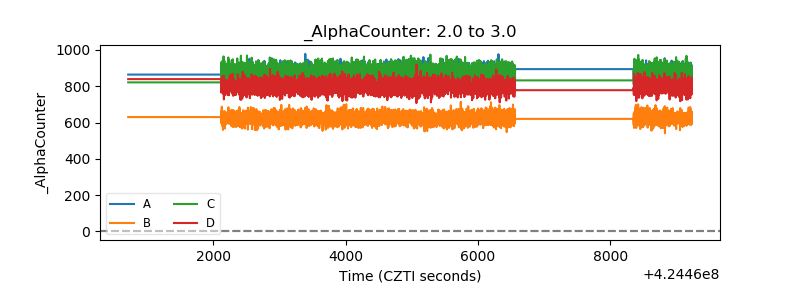 |
| _CPM_Rate | 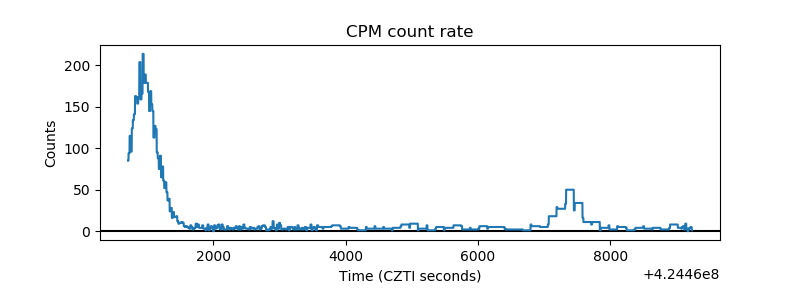 |
| CZT Counter | 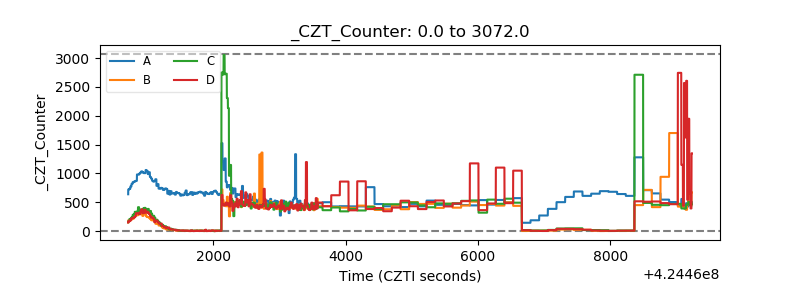 |
| +2.5 Volts monitor | 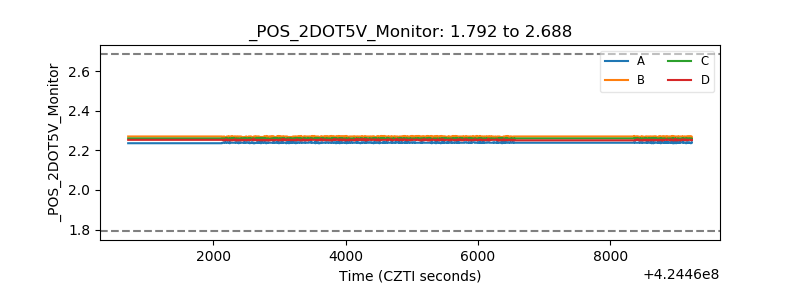 |
| +5 Volts monitor | 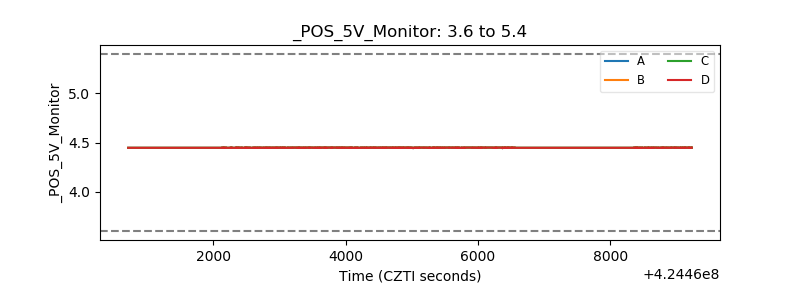 |
| _ROLL_ROT | 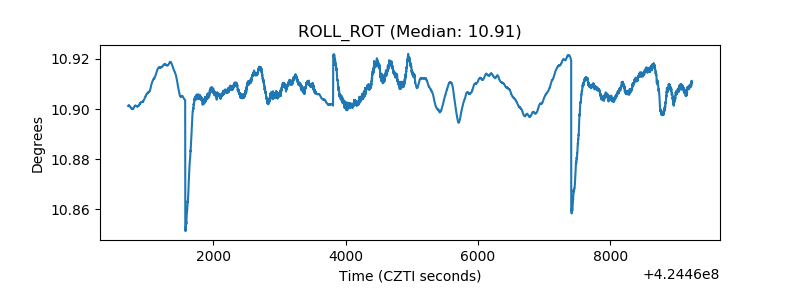 |
| _Roll_DEC | 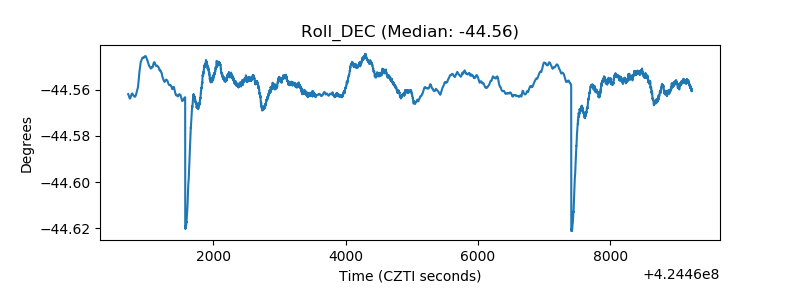 |
| _Roll_RA | 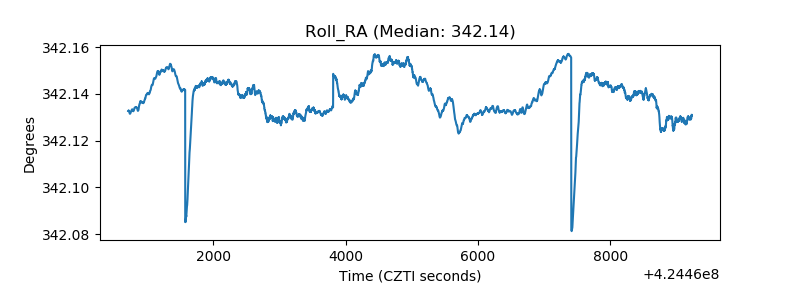 |
| Veto Counter | 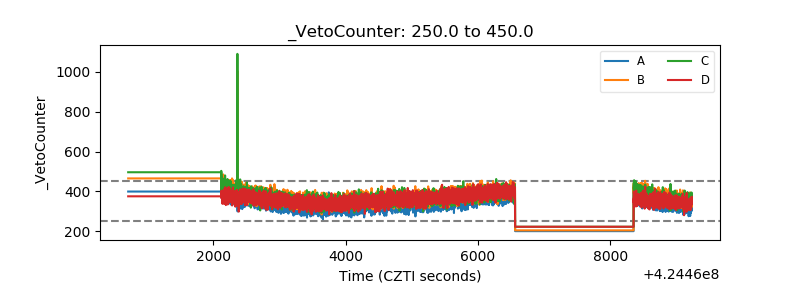 |