| Param | Original file | Final file |
|---|---|---|
| Filename | modeM0/AS1A12_035T02_9000005690_41696cztM0_level2.fits | modeM0/AS1A12_035T02_9000005690_41696cztM0_level2_quad_clean.evt |
| Size (bytes) | 344,148,480 | 92,257,920 |
| Size | 328.2 MB | 88.0 MB |
| Events in quadrant A | 3,062,871 | 626,427 |
| Events in quadrant B | 2,703,120 | 631,242 |
| Events in quadrant C | 2,860,569 | 595,778 |
| Events in quadrant D | 3,673,159 | 545,638 |
| Mode M9 | |||
|---|---|---|---|
| Quadrant | BADHDUFLAG | Total packets | Discarded packets |
| A | 0 | 22 | 0 |
| B | 0 | 22 | 0 |
| C | 0 | 23 | 0 |
| D | 0 | 23 | 0 |
| Mode M0 | |||
|---|---|---|---|
| Quadrant | BADHDUFLAG | Total packets | Discarded packets |
| A | 0 | 12579 | 2 |
| B | 0 | 12043 | 2 |
| C | 0 | 12128 | 2 |
| D | 0 | 15013 | 2 |
| Mode SS | |||
|---|---|---|---|
| Quadrant | BADHDUFLAG | Total packets | Discarded packets |
| A | 0 | 114 | 0 |
| B | 0 | 114 | 0 |
| C | 0 | 114 | 0 |
| D | 0 | 114 | 0 |
| Quadrant | Total seconds | Saturated seconds | Saturation percentage |
|---|---|---|---|
| A | 5644 | 16 | 0.283487% |
| B | 5644 | 62 | 1.098512% |
| C | 5644 | 98 | 1.736357% |
| D | 5644 | 287 | 5.085046% |
Noise dominated data is calculated using 1-second bins in cleaned event files. If a bin has >2000 counts, and if more than 50% of those come from <1% of pixels, then it is considered to be noise-dominated and hence unusable.
| Quadrant | # 1 sec bins | Bins with >0 counts | Bins with >2000 counts | High rate bins dominated by noise | Noise dominated (total time) | Noise dominated (detector-on time) | Marked lightcurve |
|---|---|---|---|---|---|---|---|
| A | 7107 | 5645 | 5 | 5 | 0.07% | 0.09% | 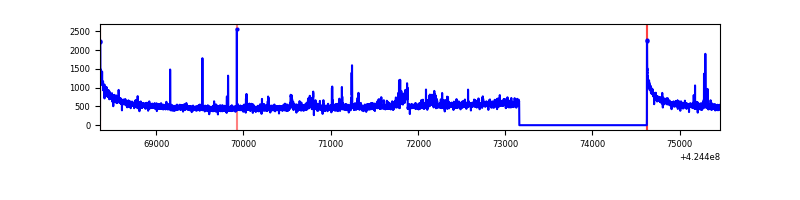 |
| B | 7107 | 5645 | 41 | 41 | 0.58% | 0.73% | 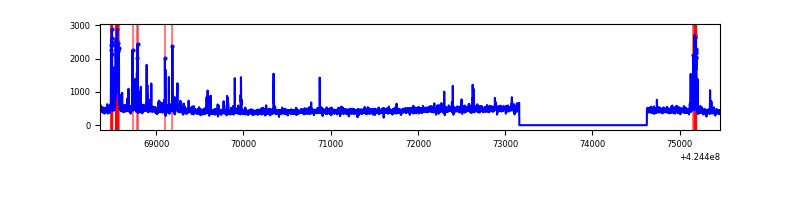 |
| C | 7107 | 5645 | 90 | 90 | 1.27% | 1.59% | 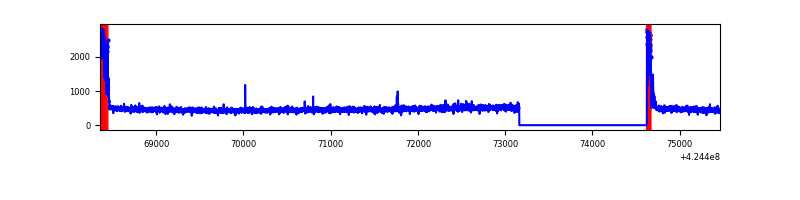 |
| D | 7107 | 5645 | 277 | 277 | 3.90% | 4.91% | 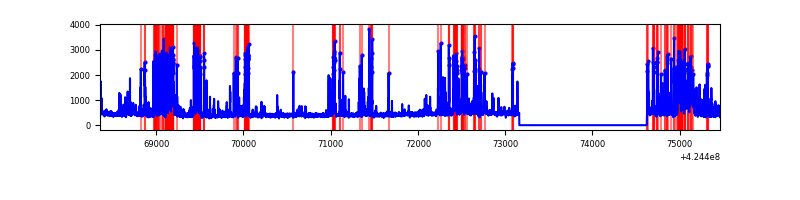 |
Top three noisy pixels from each quadrant. If the there are fewer than three noisy pixels in the level2.evt file, extra rows are filled as -1
| Pixel properties | Quadrant properties | ||||||
|---|---|---|---|---|---|---|---|
| Quadrant | DetID | PixID | Counts | Sigma | Mean | Median | Sigma |
| A | 10 | 83 | 539976 | 4281.24 | 617 | 605 | 126.0 |
| A | 15 | 223 | 105639 | 833.7 | 617 | 605 | 126.0 |
| A | 13 | 248 | 27395 | 212.64 | 617 | 605 | 126.0 |
| B | 5 | 255 | 137875 | 1140.8 | 611 | 593 | 120.3 |
| B | 4 | 171 | 122924 | 1016.56 | 611 | 593 | 120.3 |
| B | 0 | 245 | 26425 | 214.66 | 611 | 593 | 120.3 |
| C | 0 | 10 | 277494 | 1966.74 | 600 | 601 | 140.8 |
| C | 15 | 214 | 231881 | 1642.76 | 600 | 601 | 140.8 |
| C | 14 | 254 | 7802 | 51.15 | 600 | 601 | 140.8 |
| D | 2 | 249 | 728693 | 4985.34 | 593 | 576 | 146.1 |
| D | 13 | 249 | 451075 | 3084.52 | 593 | 576 | 146.1 |
| D | 2 | 120 | 162626 | 1109.54 | 593 | 576 | 146.1 |
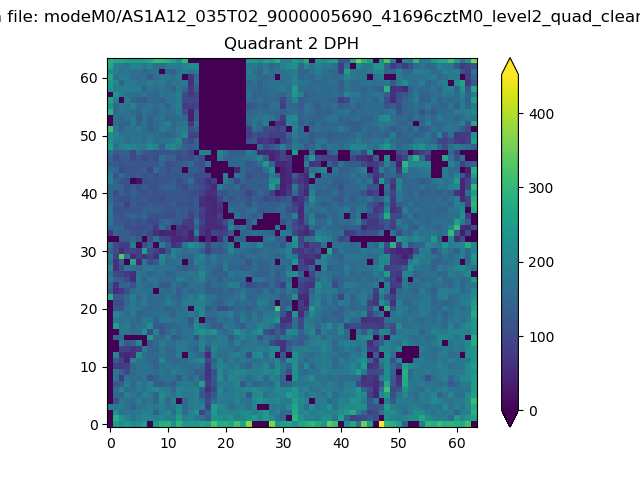
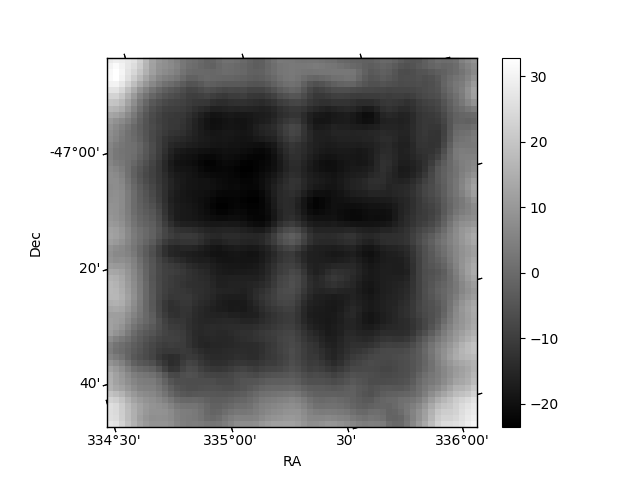
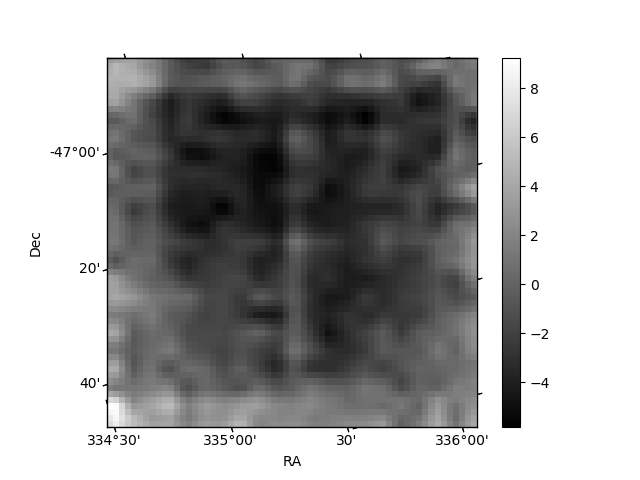
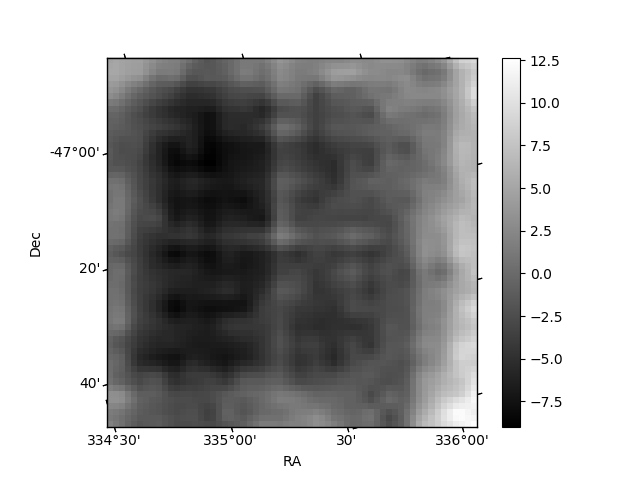
Histogram calculated using DETX and DETY for each event in the final _common_clean file
| Quadrant A | 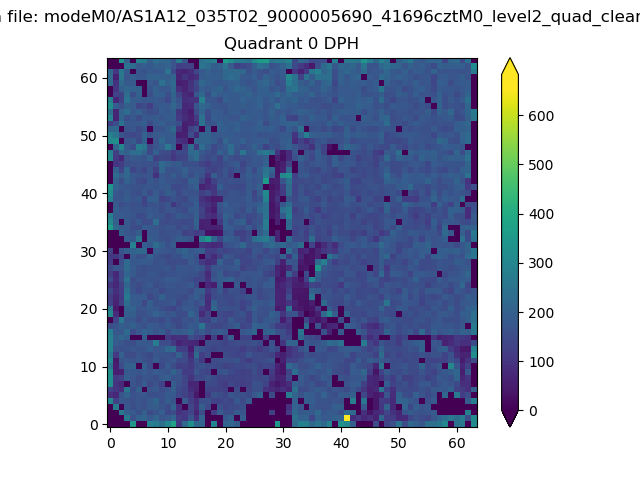 |
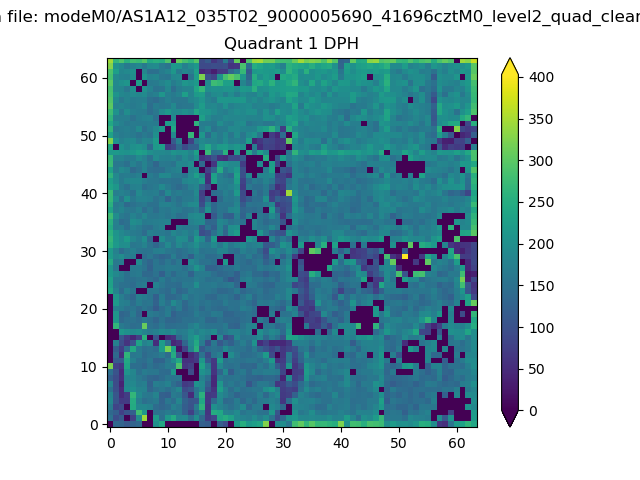 |
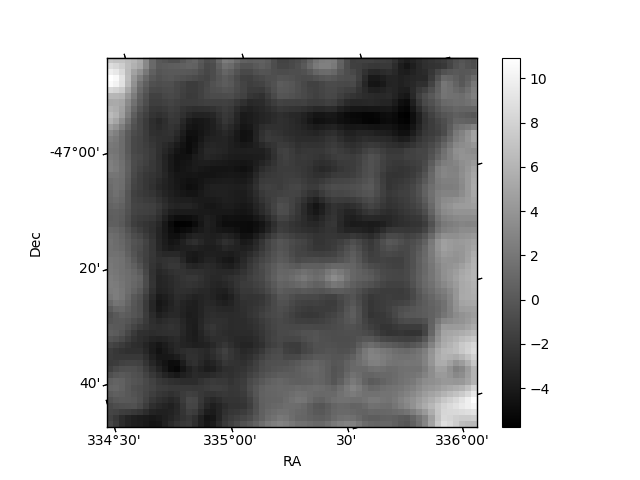
Quadrant B |
|---|---|---|---|
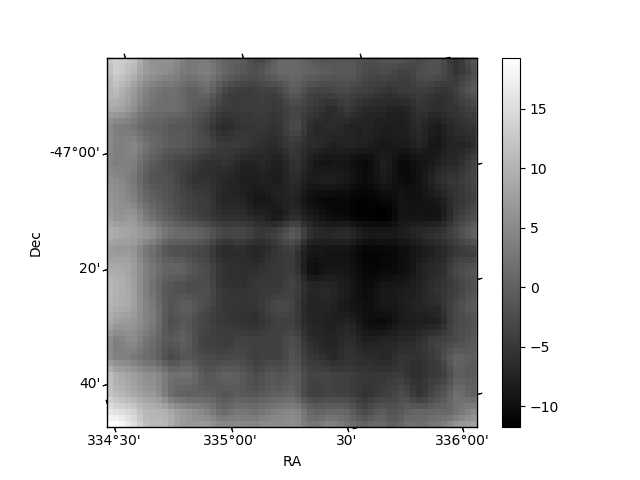
| Quadrant D | 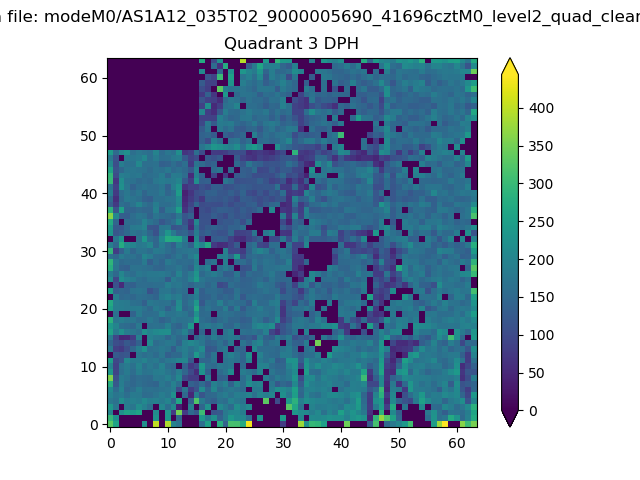 |
 |
Quadrant C |
| Plot type | Count rate plots | Images |
|---|---|---|
| Comparison with Poisson distribution Blue bars denote a histogram of data divided into 1 sec bins. Red curve is a Poisson curve with rate = median count rate of data. |
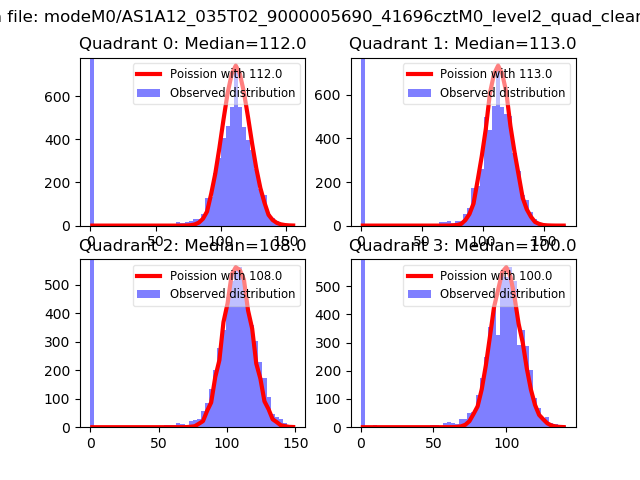 |
 |
| Quadrant-wise count rates Data is divided into 100 sec bins |
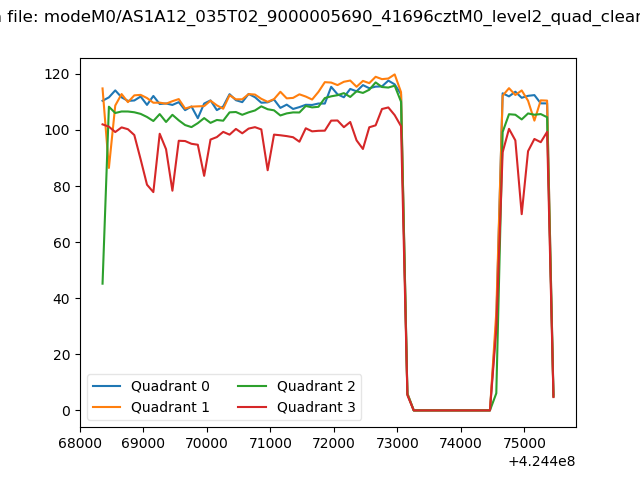 |
|
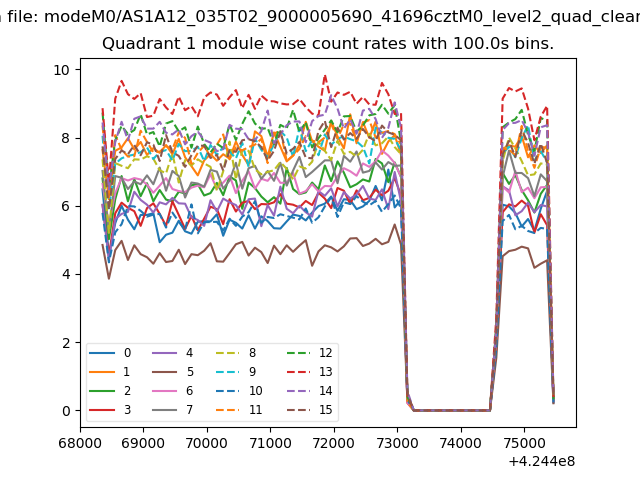
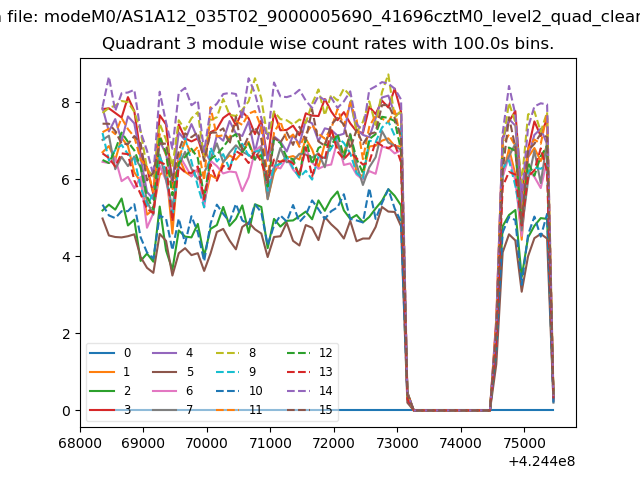
| Module-wise count rates for Quadrant A Data is divided into 100 sec bins |
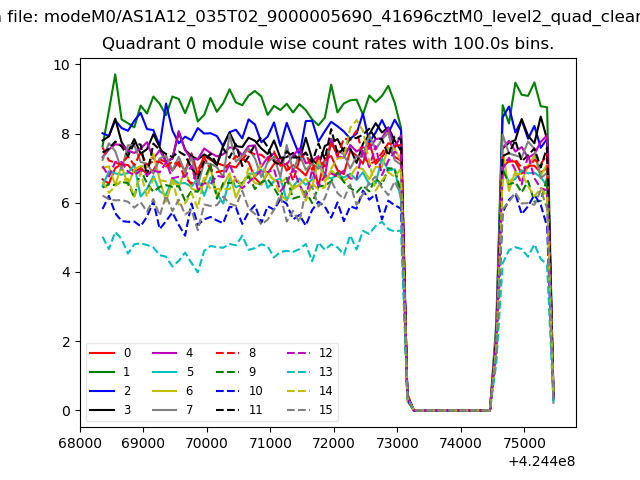 |
 |
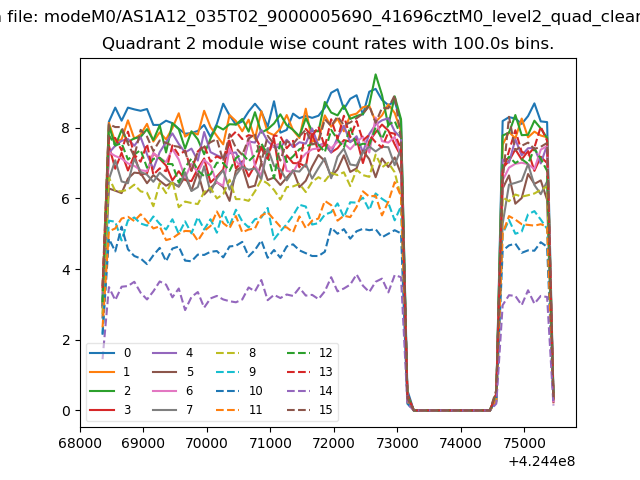
| Module-wise count rates for Quadrant B Data is divided into 100 sec bins |
 |
 |
| Module-wise count rates for Quadrant C Data is divided into 100 sec bins |
 |
 |
| Module-wise count rates for Quadrant D Data is divided into 100 sec bins |
 |
 |
| Parameter | Plot |
|---|---|
| CZT HV Monitor | 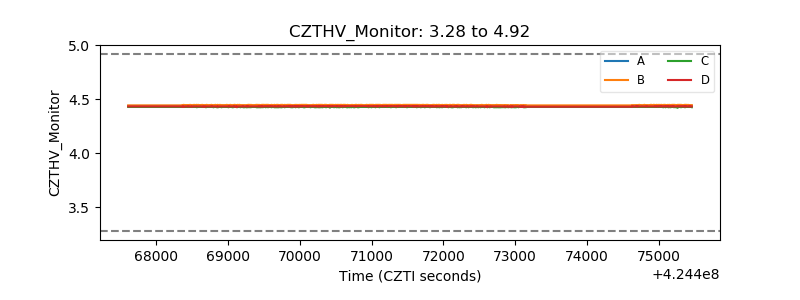 |
| D_VDD | 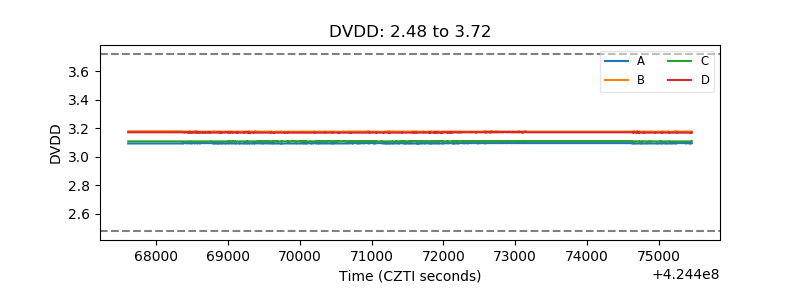 |
| Temperature 1 | 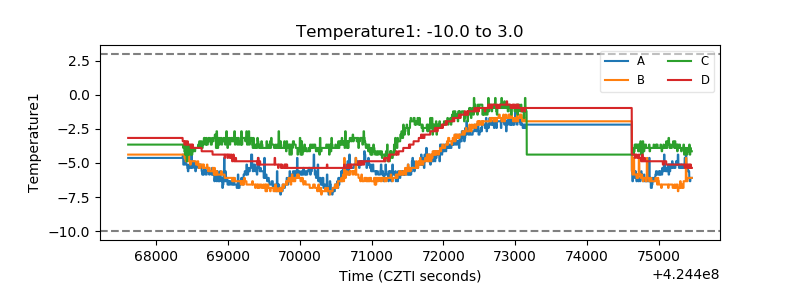 |
| Veto HV Monitor | 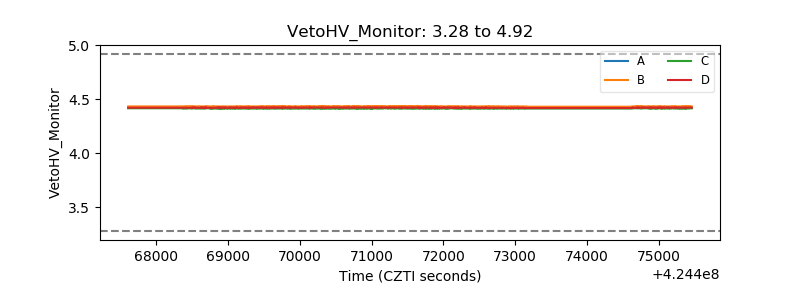 |
| Veto LLD | 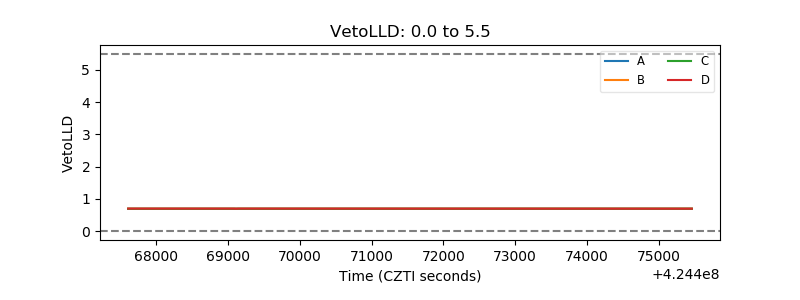 |
| Alpha Counter | 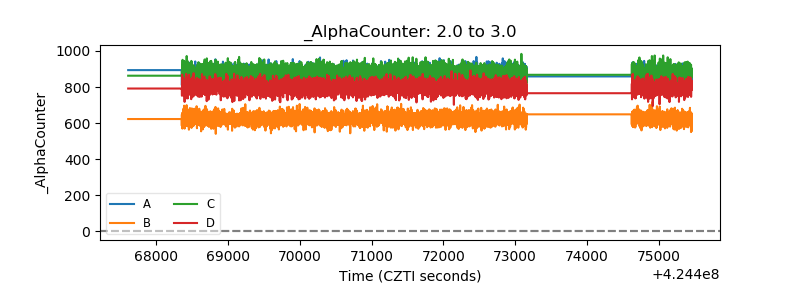 |
| _CPM_Rate | 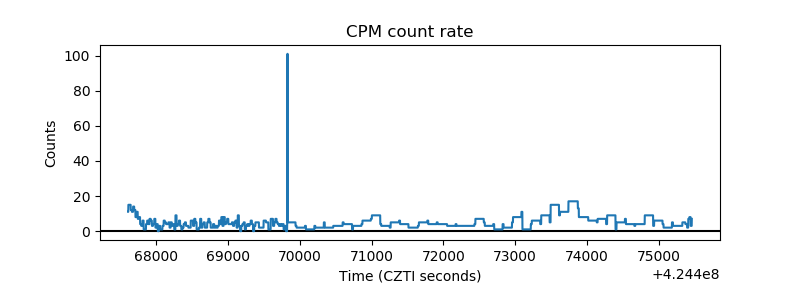 |
| CZT Counter | 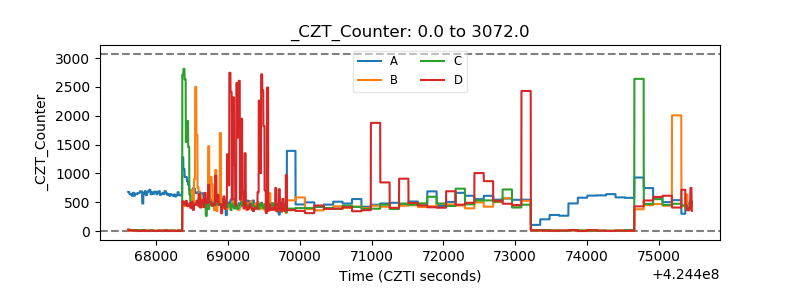 |
| +2.5 Volts monitor | 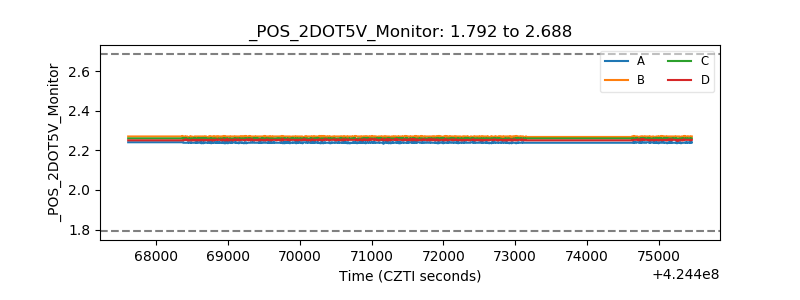 |
| +5 Volts monitor | 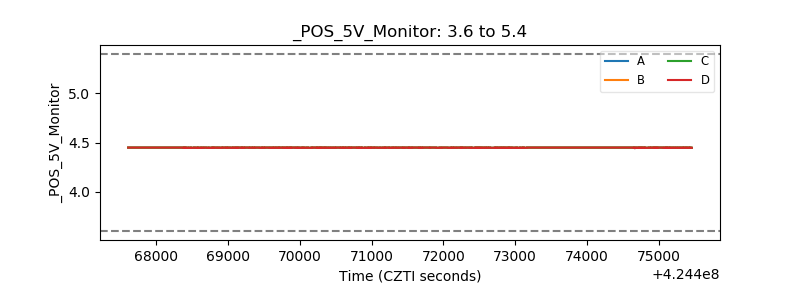 |
| _ROLL_ROT | 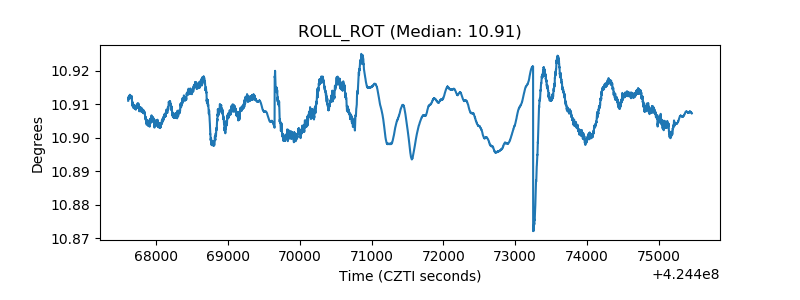 |
| _Roll_DEC | 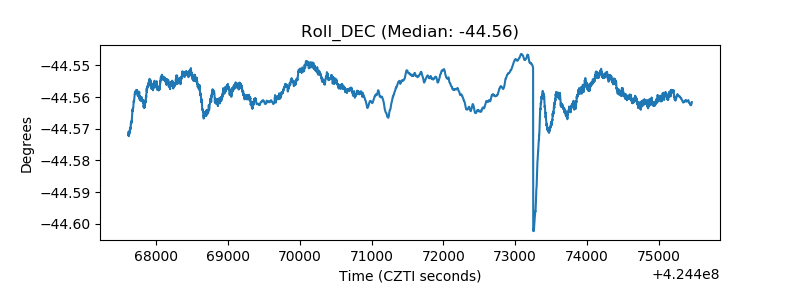 |
| _Roll_RA | 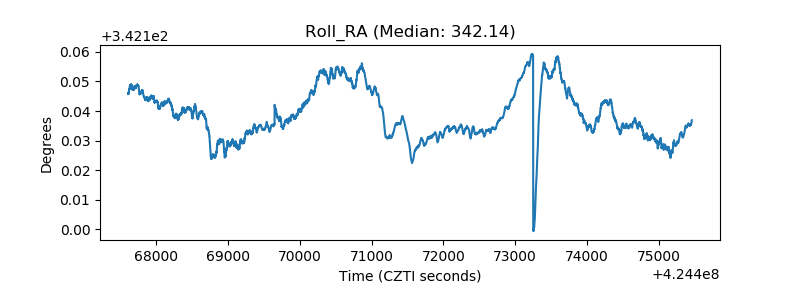 |
| Veto Counter | 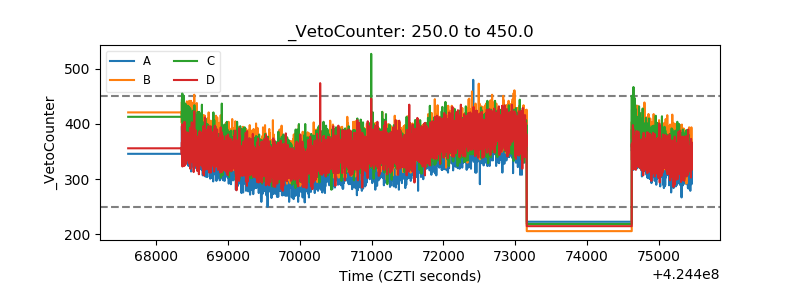 |