| Param | Original file | Final file |
|---|---|---|
| Filename | modeM0/AS1A12_035T02_9000005690_41697cztM0_level2.fits | modeM0/AS1A12_035T02_9000005690_41697cztM0_level2_quad_clean.evt |
| Size (bytes) | 363,821,760 | 94,904,640 |
| Size | 347.0 MB | 90.5 MB |
| Events in quadrant A | 3,062,942 | 640,644 |
| Events in quadrant B | 2,592,819 | 651,535 |
| Events in quadrant C | 2,834,393 | 619,882 |
| Events in quadrant D | 4,523,169 | 554,178 |
| Mode M9 | |||
|---|---|---|---|
| Quadrant | BADHDUFLAG | Total packets | Discarded packets |
| A | 0 | 22 | 0 |
| B | 0 | 23 | 0 |
| C | 0 | 23 | 0 |
| D | 0 | 23 | 0 |
| Mode M0 | |||
|---|---|---|---|
| Quadrant | BADHDUFLAG | Total packets | Discarded packets |
| A | 0 | 12668 | 2 |
| B | 0 | 11932 | 2 |
| C | 0 | 12136 | 2 |
| D | 0 | 17595 | 2 |
| Mode SS | |||
|---|---|---|---|
| Quadrant | BADHDUFLAG | Total packets | Discarded packets |
| A | 0 | 118 | 0 |
| B | 0 | 118 | 0 |
| C | 0 | 118 | 0 |
| D | 0 | 118 | 0 |
| Quadrant | Total seconds | Saturated seconds | Saturation percentage |
|---|---|---|---|
| A | 5833 | 13 | 0.222870% |
| B | 5833 | 25 | 0.428596% |
| C | 5833 | 45 | 0.771473% |
| D | 5833 | 352 | 6.034631% |
Noise dominated data is calculated using 1-second bins in cleaned event files. If a bin has >2000 counts, and if more than 50% of those come from <1% of pixels, then it is considered to be noise-dominated and hence unusable.
| Quadrant | # 1 sec bins | Bins with >0 counts | Bins with >2000 counts | High rate bins dominated by noise | Noise dominated (total time) | Noise dominated (detector-on time) | Marked lightcurve |
|---|---|---|---|---|---|---|---|
| A | 7145 | 5834 | 5 | 5 | 0.07% | 0.09% | 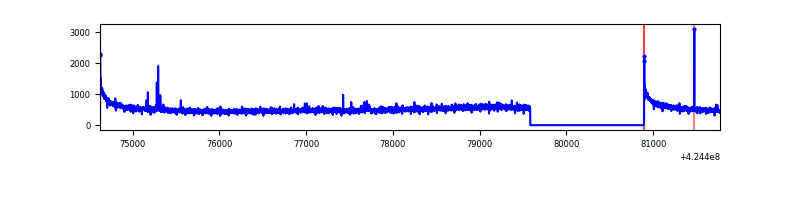 |
| B | 7145 | 5834 | 12 | 12 | 0.17% | 0.21% | 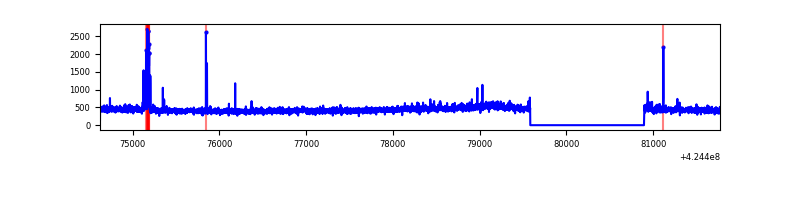 |
| C | 7145 | 5834 | 43 | 43 | 0.60% | 0.74% | 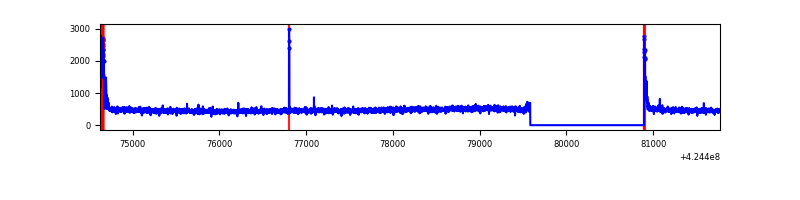 |
| D | 7145 | 5834 | 330 | 330 | 4.62% | 5.66% | 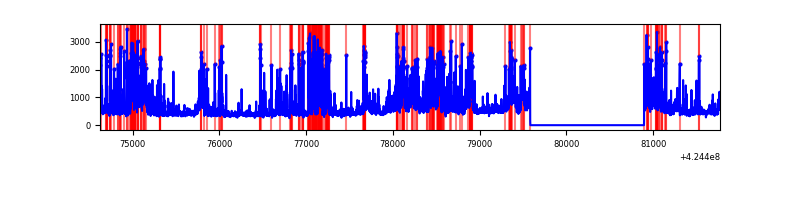 |
Top three noisy pixels from each quadrant. If the there are fewer than three noisy pixels in the level2.evt file, extra rows are filled as -1
| Pixel properties | Quadrant properties | ||||||
|---|---|---|---|---|---|---|---|
| Quadrant | DetID | PixID | Counts | Sigma | Mean | Median | Sigma |
| A | 10 | 83 | 561362 | 4233.54 | 639 | 626 | 132.5 |
| A | 13 | 248 | 13103 | 94.2 | 639 | 626 | 132.5 |
| A | 15 | 223 | 12394 | 88.85 | 639 | 626 | 132.5 |
| B | 5 | 255 | 70153 | 558.54 | 634 | 617 | 124.5 |
| B | 12 | 111 | 15716 | 121.28 | 634 | 617 | 124.5 |
| B | 11 | 111 | 14652 | 112.73 | 634 | 617 | 124.5 |
| C | 15 | 214 | 238942 | 1626.11 | 626 | 629 | 146.6 |
| C | 0 | 10 | 137973 | 937.15 | 626 | 629 | 146.6 |
| C | 14 | 254 | 16572 | 108.79 | 626 | 629 | 146.6 |
| D | 2 | 249 | 746821 | 5046.03 | 611 | 595 | 147.9 |
| D | 13 | 249 | 557238 | 3764.05 | 611 | 595 | 147.9 |
| D | 12 | 79 | 450405 | 3041.64 | 611 | 595 | 147.9 |
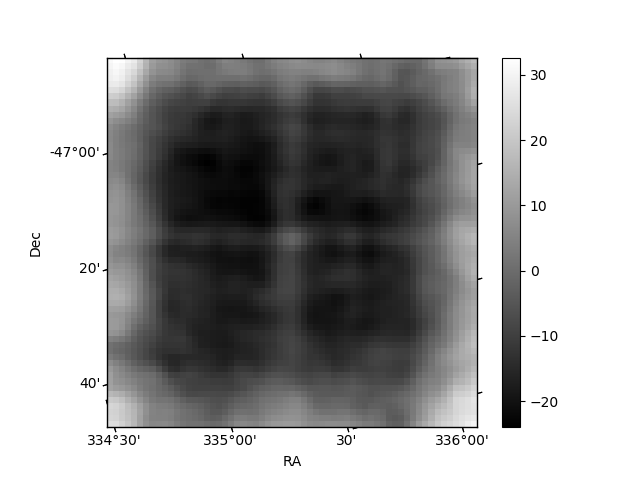
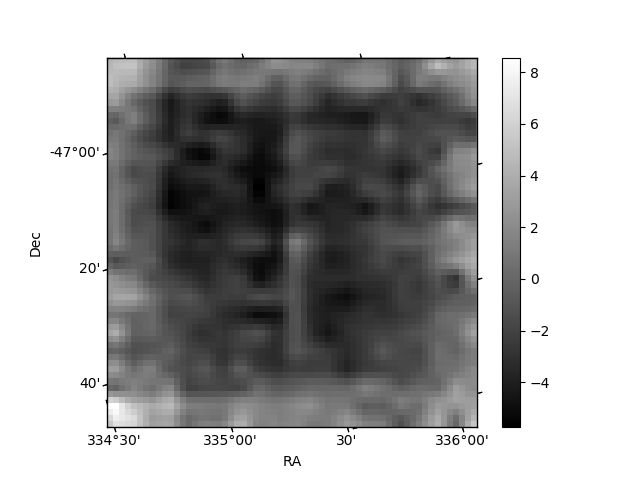
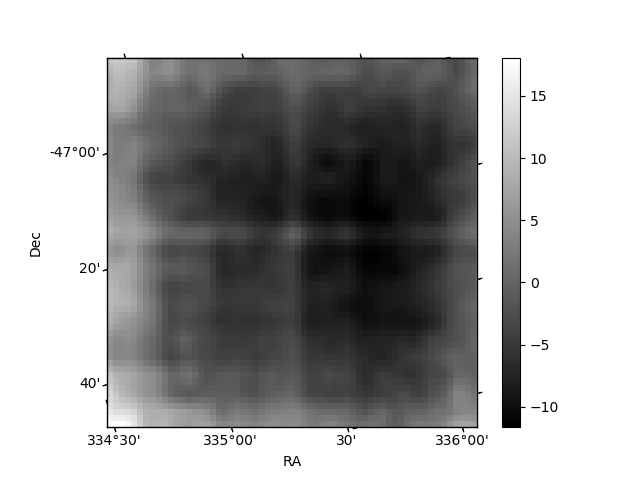
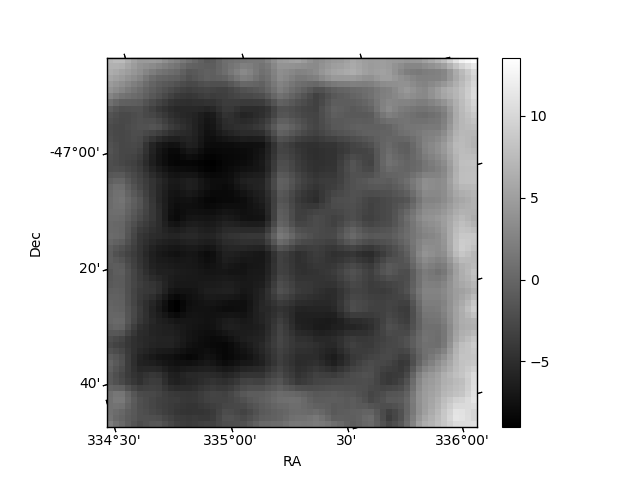
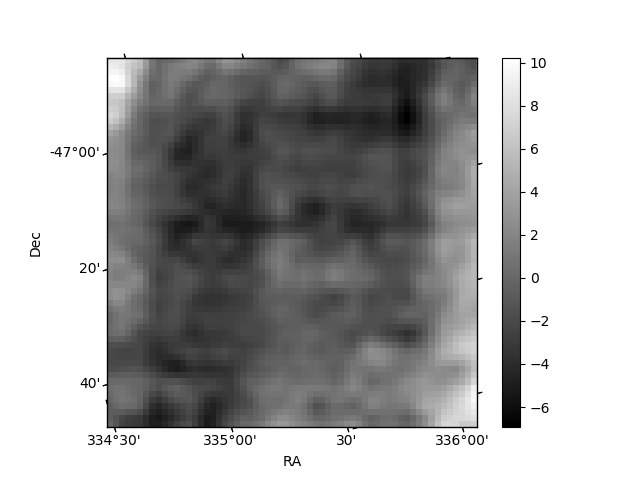
Histogram calculated using DETX and DETY for each event in the final _common_clean file
| Quadrant A | 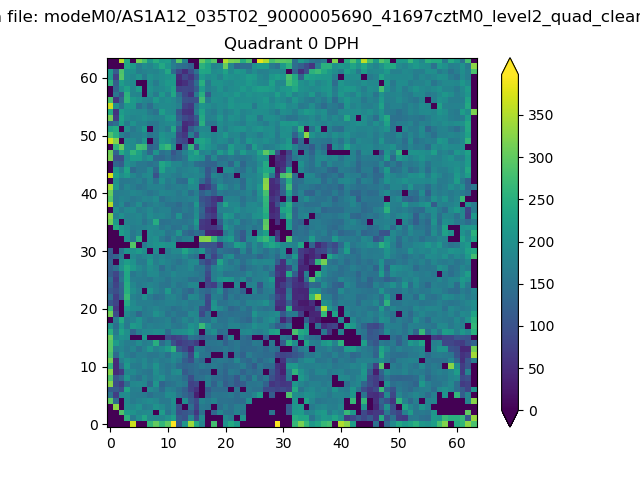 |
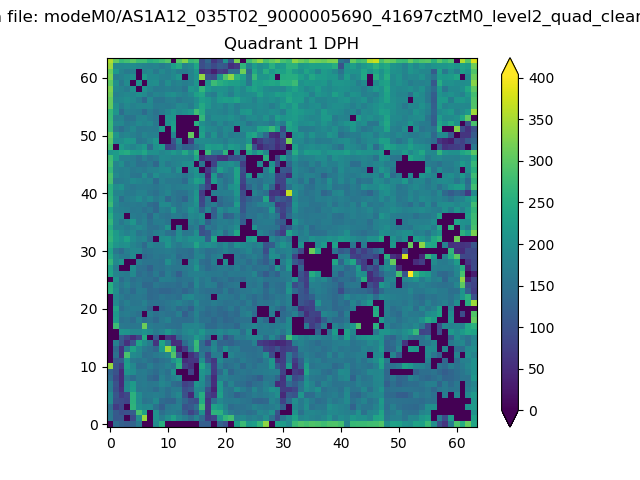 |
Quadrant B |
|---|---|---|---|
| Quadrant D | 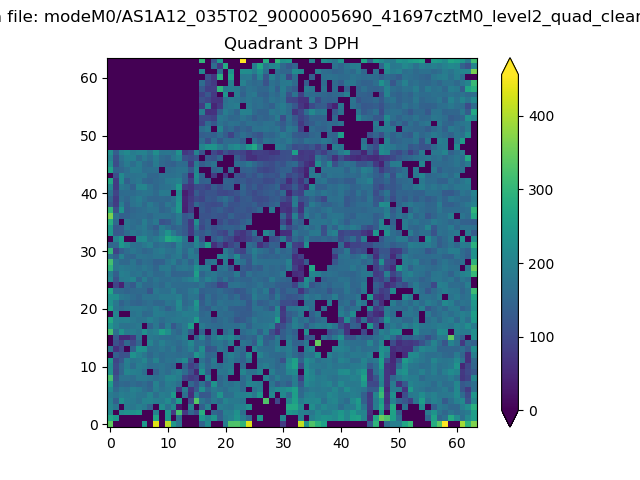 |
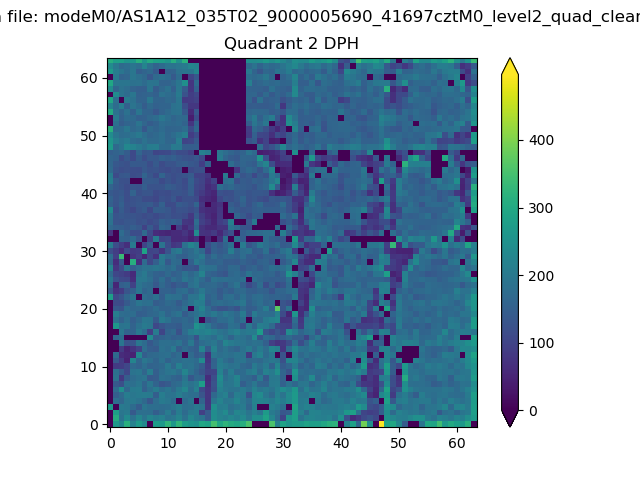 |
Quadrant C |
| Plot type | Count rate plots | Images |
|---|---|---|
| Comparison with Poisson distribution Blue bars denote a histogram of data divided into 1 sec bins. Red curve is a Poisson curve with rate = median count rate of data. |
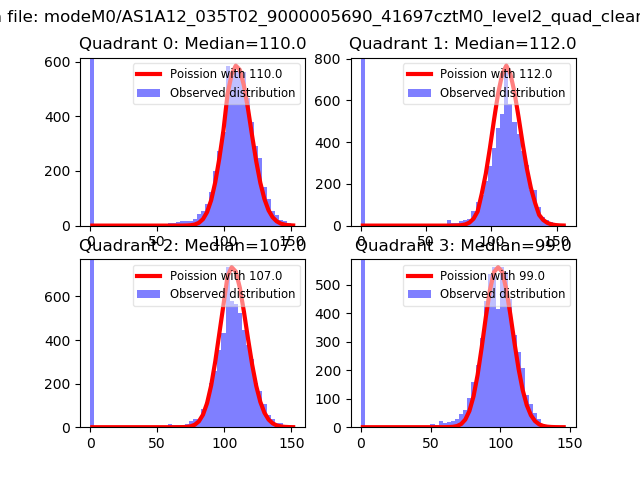 |
 |
| Quadrant-wise count rates Data is divided into 100 sec bins |
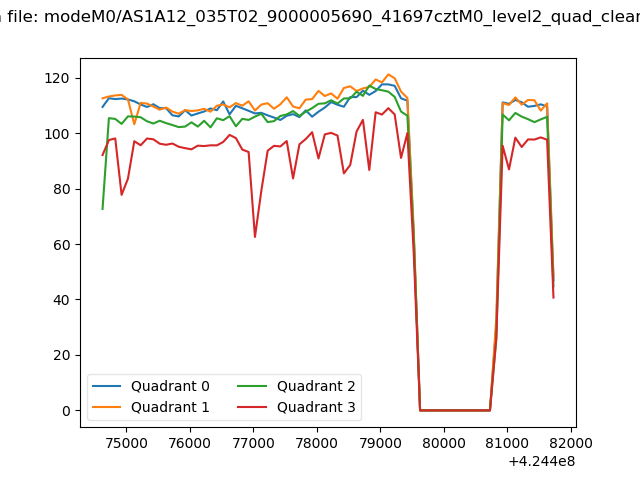 |
|
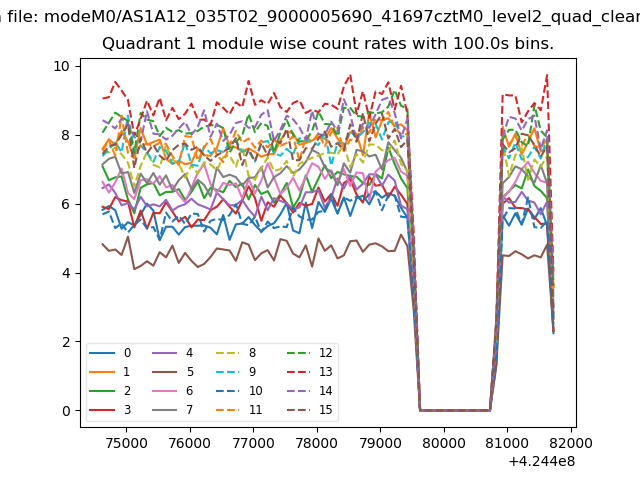
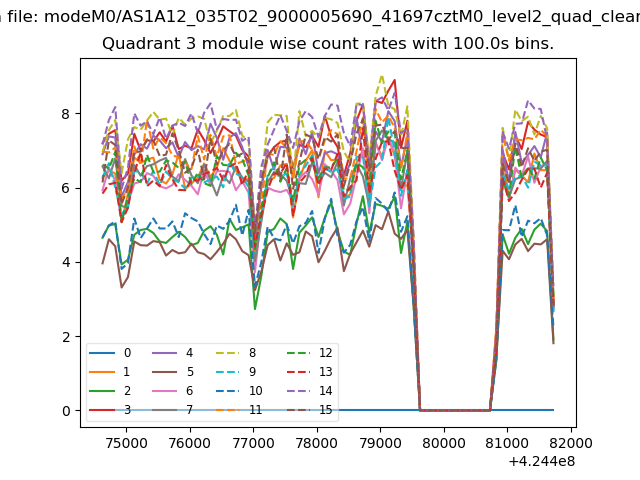
| Module-wise count rates for Quadrant A Data is divided into 100 sec bins |
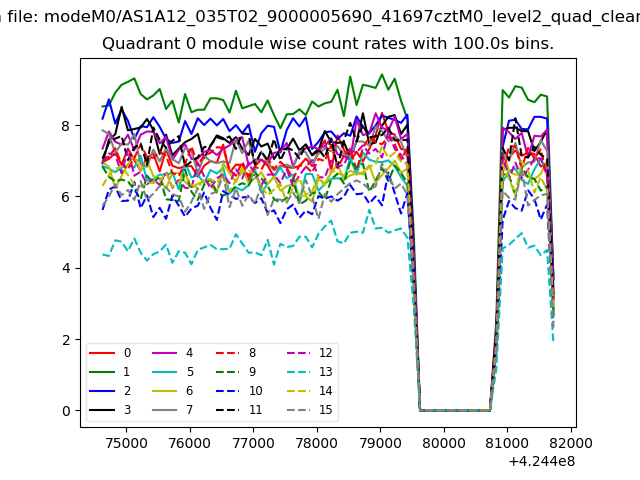 |
 |
| Module-wise count rates for Quadrant B Data is divided into 100 sec bins |
 |
 |
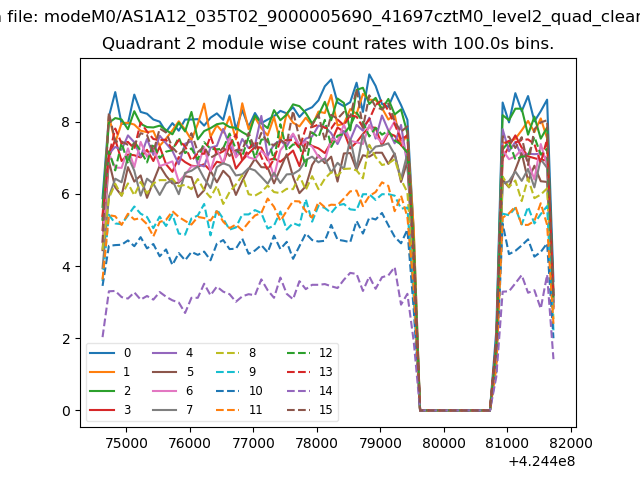
| Module-wise count rates for Quadrant C Data is divided into 100 sec bins |
 |
 |
| Module-wise count rates for Quadrant D Data is divided into 100 sec bins |
 |
 |
| Parameter | Plot |
|---|---|
| CZT HV Monitor | 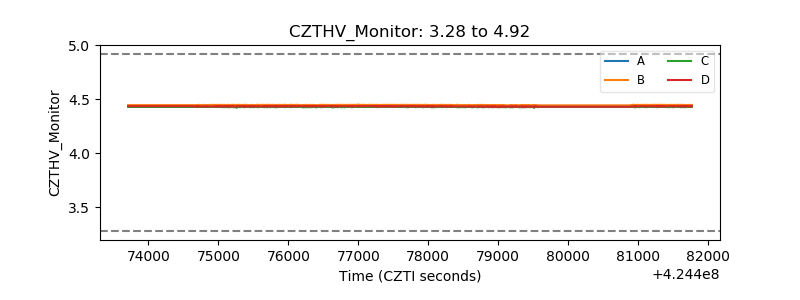 |
| D_VDD | 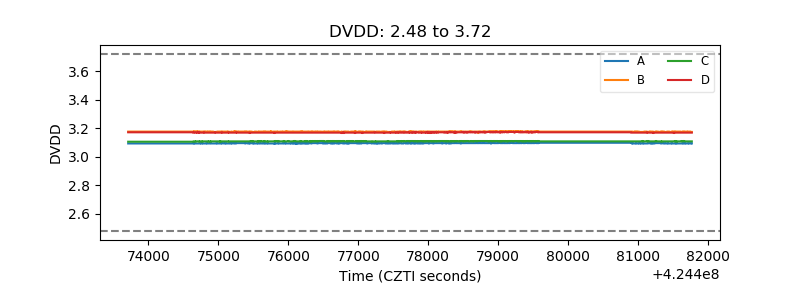 |
| Temperature 1 | 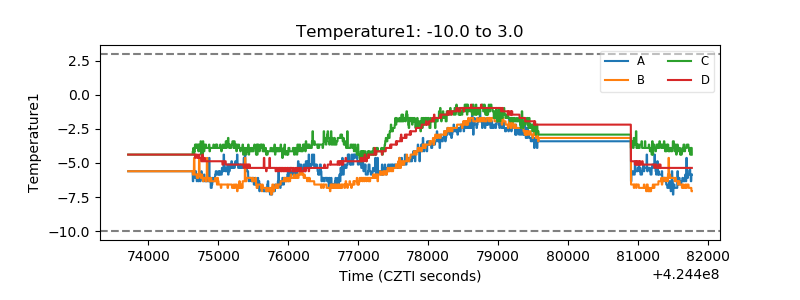 |
| Veto HV Monitor | 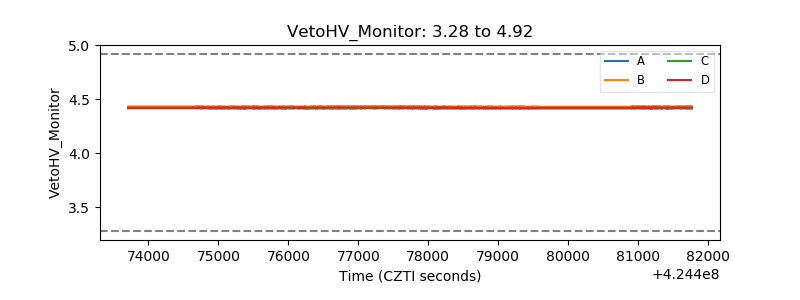 |
| Veto LLD | 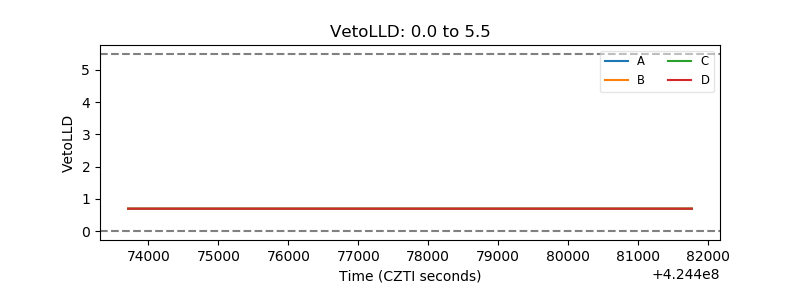 |
| Alpha Counter | 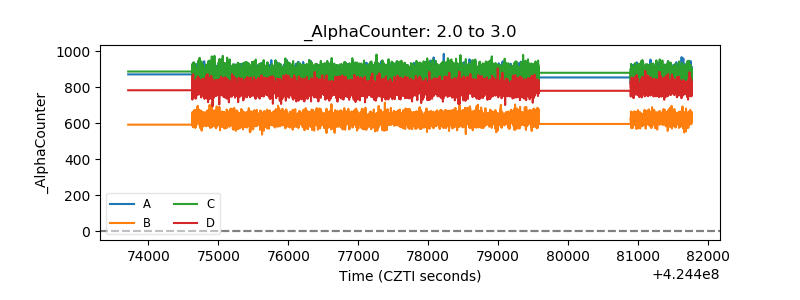 |
| _CPM_Rate | 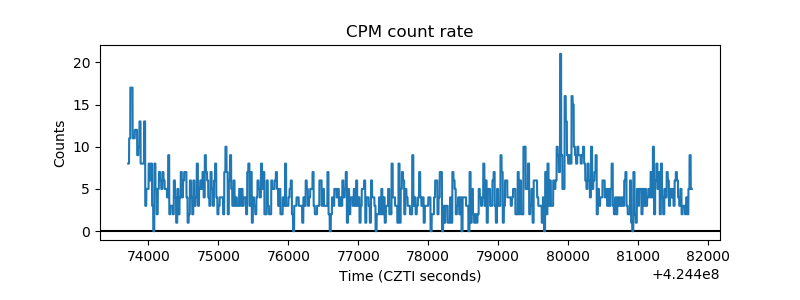 |
| CZT Counter | 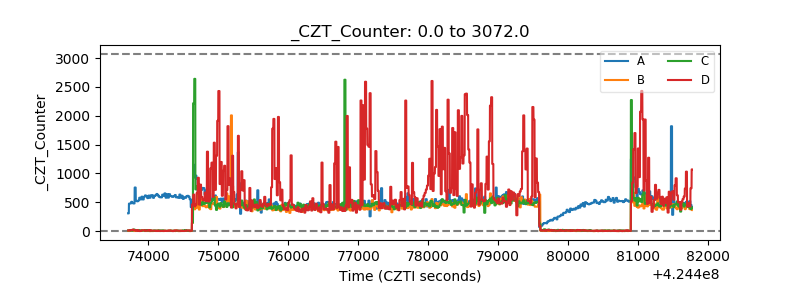 |
| +2.5 Volts monitor | 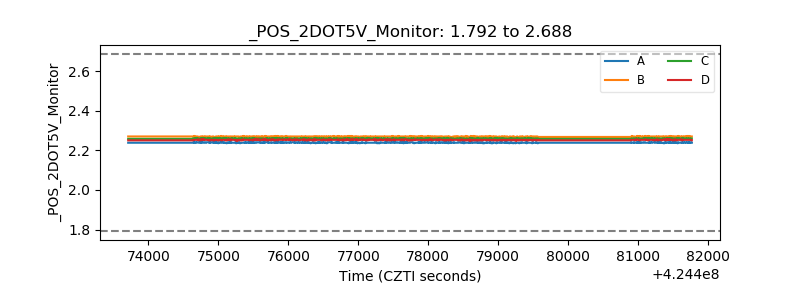 |
| +5 Volts monitor | 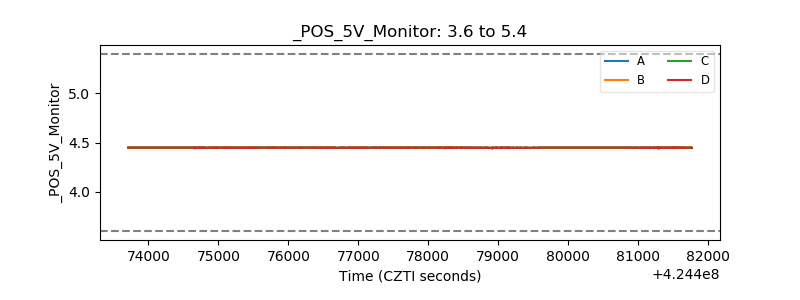 |
| _ROLL_ROT | 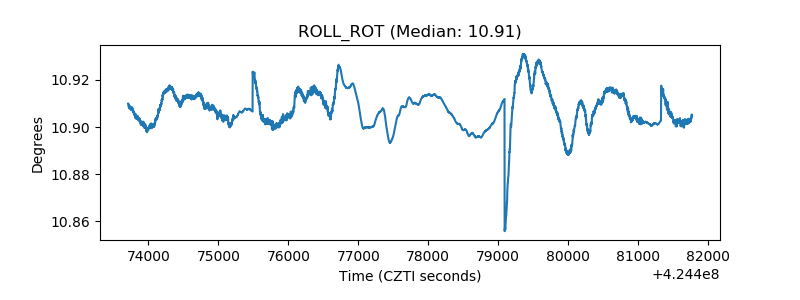 |
| _Roll_DEC | 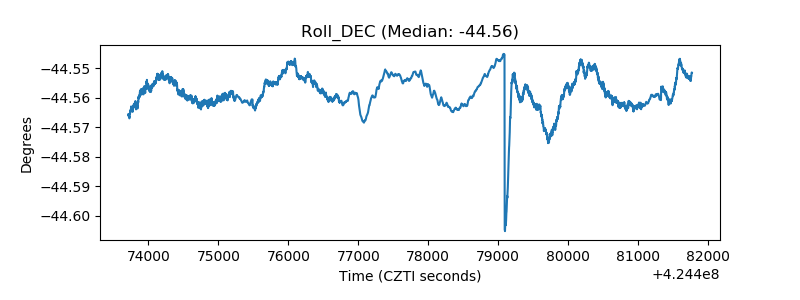 |
| _Roll_RA | 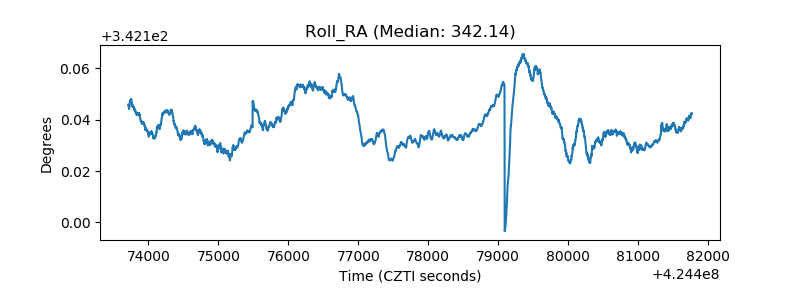 |
| Veto Counter | 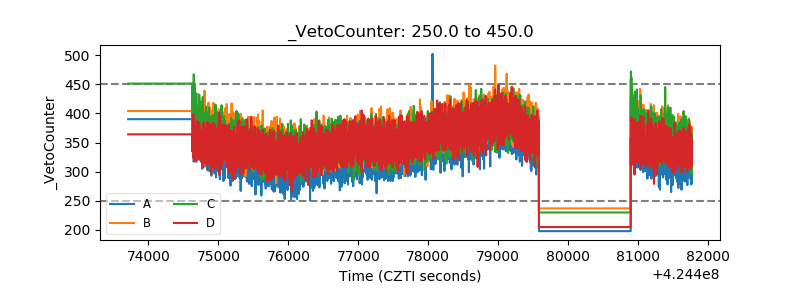 |