| Param | Original file | Final file |
|---|---|---|
| Filename | modeM0/AS1A12_035T02_9000005690_41700cztM0_level2.fits | modeM0/AS1A12_035T02_9000005690_41700cztM0_level2_quad_clean.evt |
| Size (bytes) | 438,154,560 | 122,679,360 |
| Size | 417.9 MB | 117.0 MB |
| Events in quadrant A | 3,855,233 | 820,673 |
| Events in quadrant B | 3,508,316 | 831,390 |
| Events in quadrant C | 3,555,968 | 803,386 |
| Events in quadrant D | 4,708,821 | 730,645 |
| Mode M9 | |||
|---|---|---|---|
| Quadrant | BADHDUFLAG | Total packets | Discarded packets |
| A | 0 | 23 | 0 |
| B | 0 | 24 | 0 |
| C | 0 | 24 | 0 |
| D | 0 | 24 | 0 |
| Mode M0 | |||
|---|---|---|---|
| Quadrant | BADHDUFLAG | Total packets | Discarded packets |
| A | 0 | 16140 | 2 |
| B | 0 | 16094 | 2 |
| C | 0 | 15507 | 2 |
| D | 0 | 19194 | 2 |
| Mode SS | |||
|---|---|---|---|
| Quadrant | BADHDUFLAG | Total packets | Discarded packets |
| A | 0 | 154 | 0 |
| B | 0 | 154 | 0 |
| C | 0 | 154 | 0 |
| D | 0 | 154 | 0 |
| Quadrant | Total seconds | Saturated seconds | Saturation percentage |
|---|---|---|---|
| A | 7597 | 10 | 0.131631% |
| B | 7597 | 63 | 0.829275% |
| C | 7597 | 33 | 0.434382% |
| D | 7597 | 192 | 2.527313% |
Noise dominated data is calculated using 1-second bins in cleaned event files. If a bin has >2000 counts, and if more than 50% of those come from <1% of pixels, then it is considered to be noise-dominated and hence unusable.
| Quadrant | # 1 sec bins | Bins with >0 counts | Bins with >2000 counts | High rate bins dominated by noise | Noise dominated (total time) | Noise dominated (detector-on time) | Marked lightcurve |
|---|---|---|---|---|---|---|---|
| A | 8909 | 7598 | 5 | 5 | 0.06% | 0.07% | 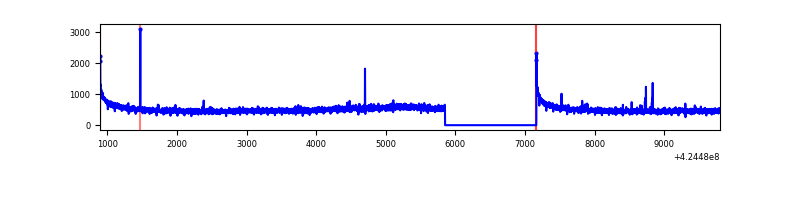 |
| B | 8909 | 7598 | 45 | 45 | 0.51% | 0.59% | 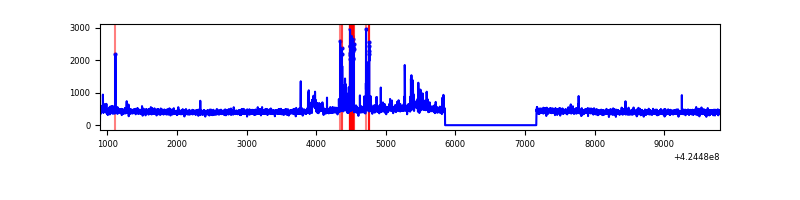 |
| C | 8909 | 7598 | 30 | 30 | 0.34% | 0.39% | 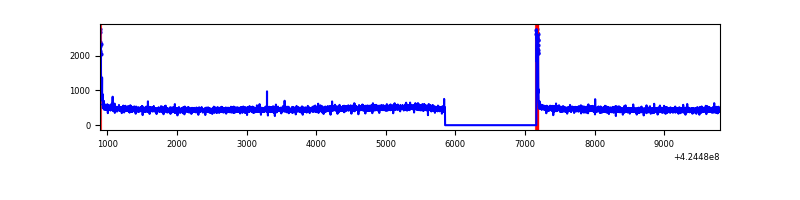 |
| D | 8909 | 7598 | 197 | 197 | 2.21% | 2.59% | 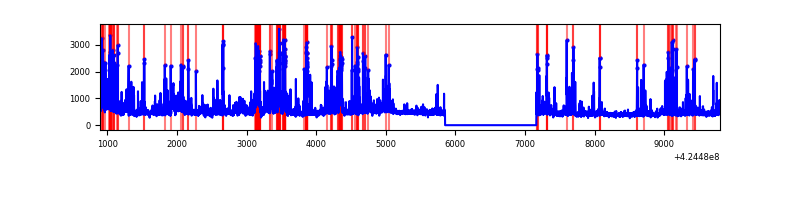 |
Top three noisy pixels from each quadrant. If the there are fewer than three noisy pixels in the level2.evt file, extra rows are filled as -1
| Pixel properties | Quadrant properties | ||||||
|---|---|---|---|---|---|---|---|
| Quadrant | DetID | PixID | Counts | Sigma | Mean | Median | Sigma |
| A | 10 | 83 | 663066 | 3935.22 | 820 | 804 | 168.3 |
| A | 13 | 248 | 12894 | 71.84 | 820 | 804 | 168.3 |
| A | 13 | 254 | 11311 | 62.43 | 820 | 804 | 168.3 |
| B | 4 | 171 | 276103 | 1743.06 | 812 | 786 | 158.0 |
| B | 12 | 111 | 19583 | 119.01 | 812 | 786 | 158.0 |
| B | 11 | 111 | 18941 | 114.94 | 812 | 786 | 158.0 |
| C | 15 | 214 | 308691 | 1624.13 | 808 | 813 | 189.6 |
| C | 0 | 10 | 97168 | 508.29 | 808 | 813 | 189.6 |
| C | 13 | 61 | 5416 | 24.28 | 808 | 813 | 189.6 |
| D | 2 | 249 | 454679 | 2306.39 | 800 | 778 | 196.8 |
| D | 12 | 79 | 451780 | 2291.66 | 800 | 778 | 196.8 |
| D | 13 | 249 | 442598 | 2245.0 | 800 | 778 | 196.8 |
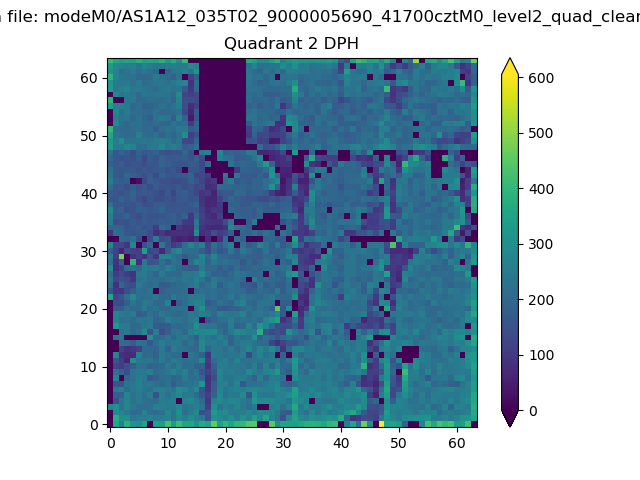
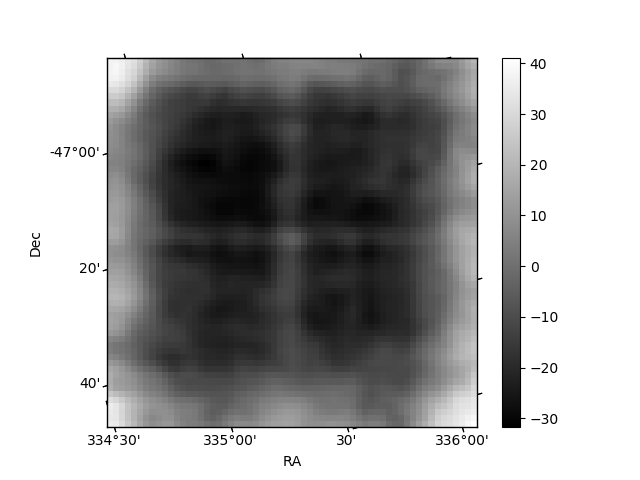
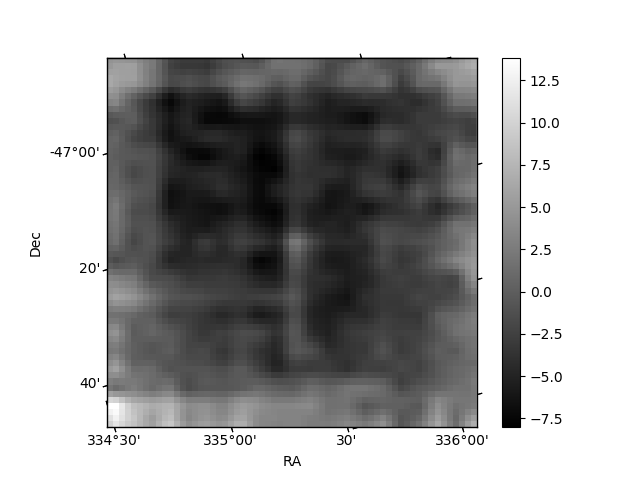
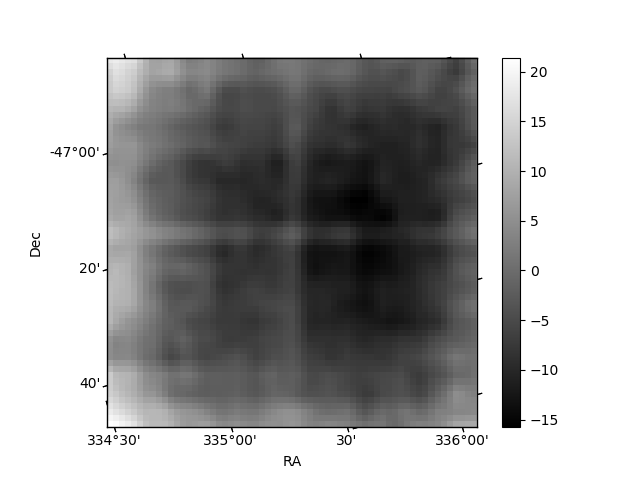
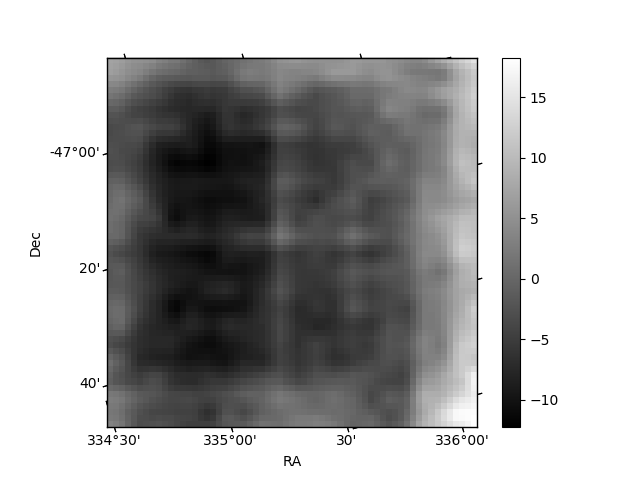
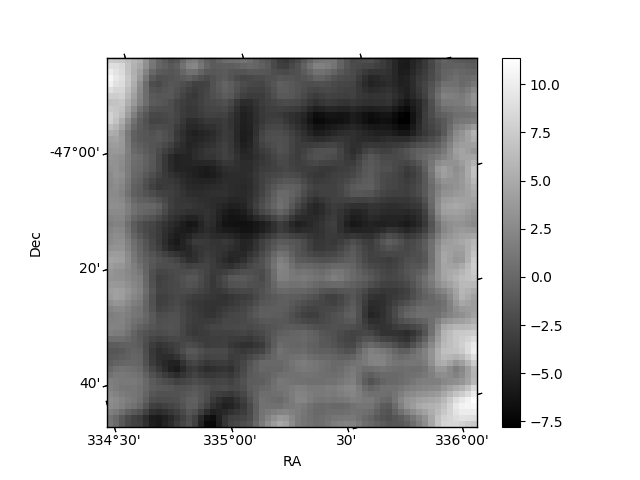
Histogram calculated using DETX and DETY for each event in the final _common_clean file
| Quadrant A | 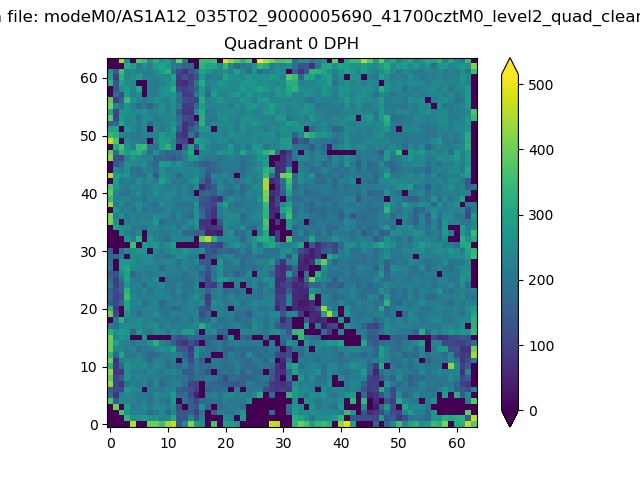 |
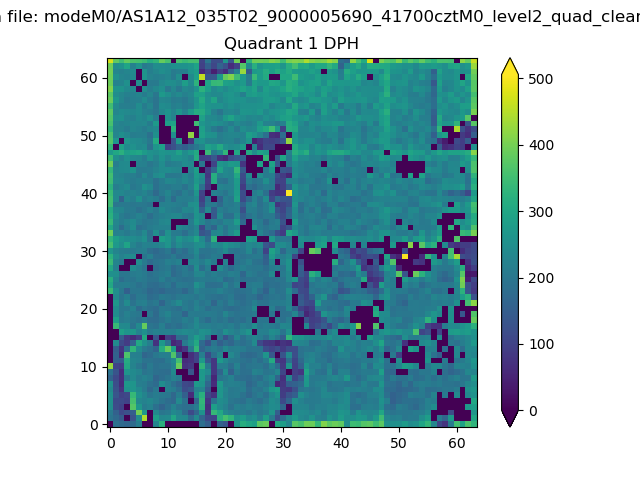 |
Quadrant B |
|---|---|---|---|
| Quadrant D | 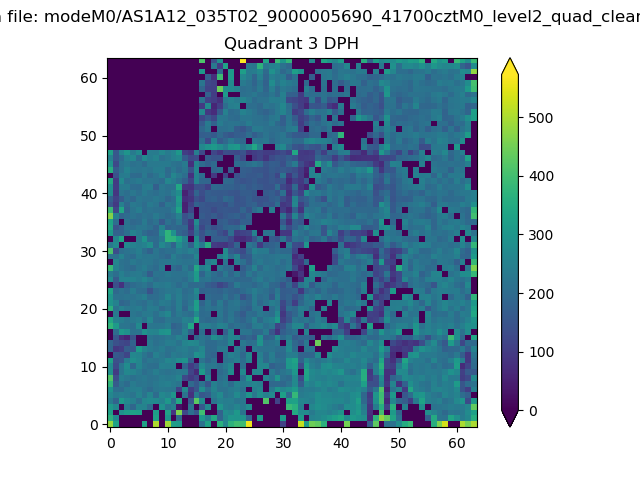 |
 |
Quadrant C |
| Plot type | Count rate plots | Images |
|---|---|---|
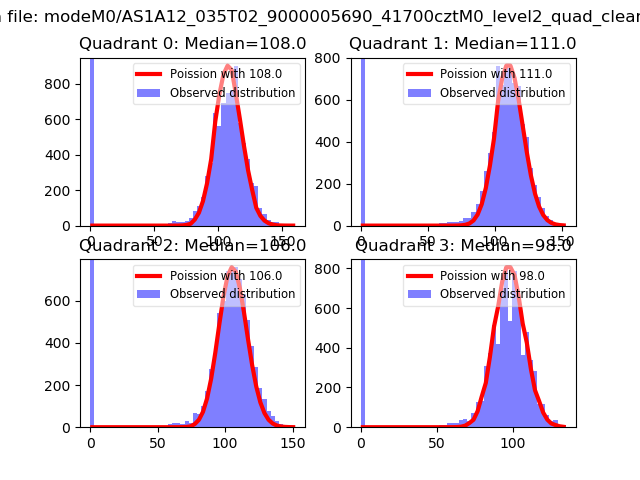
| Comparison with Poisson distribution Blue bars denote a histogram of data divided into 1 sec bins. Red curve is a Poisson curve with rate = median count rate of data. |
 |
 |
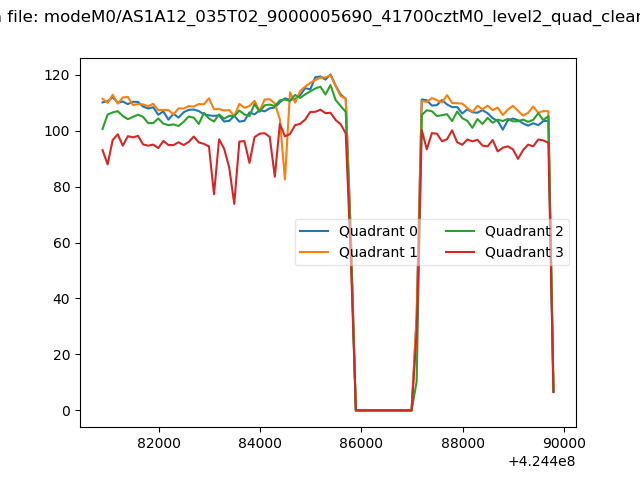
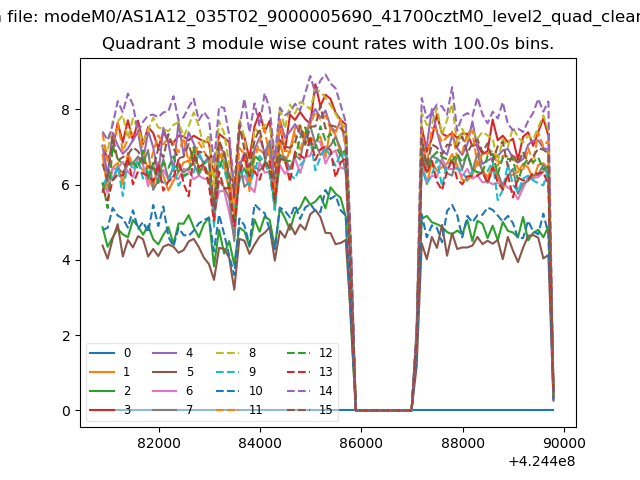
| Quadrant-wise count rates Data is divided into 100 sec bins |
 |
|
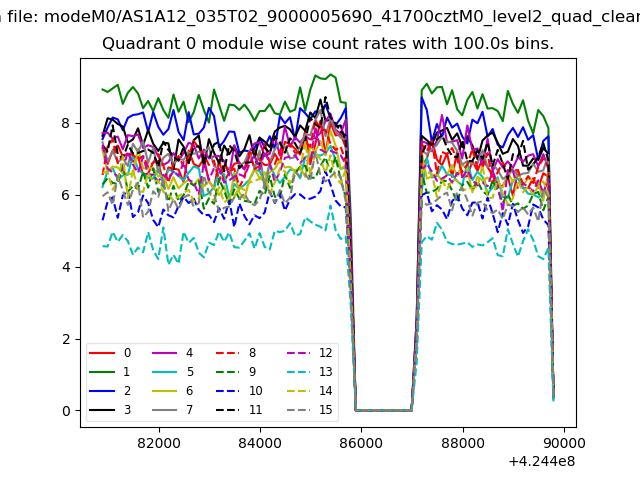
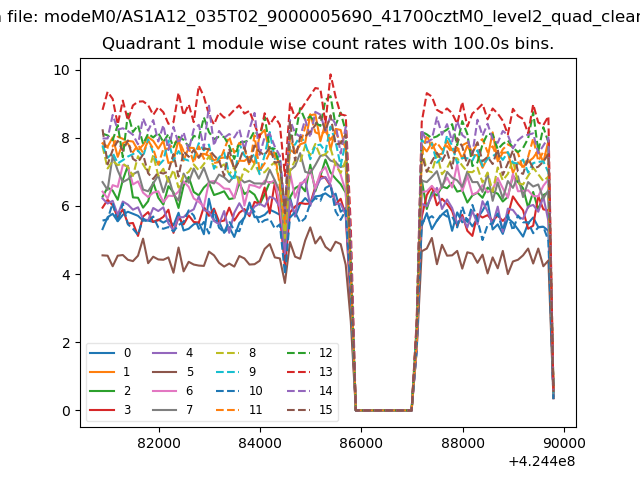
| Module-wise count rates for Quadrant A Data is divided into 100 sec bins |
 |
 |
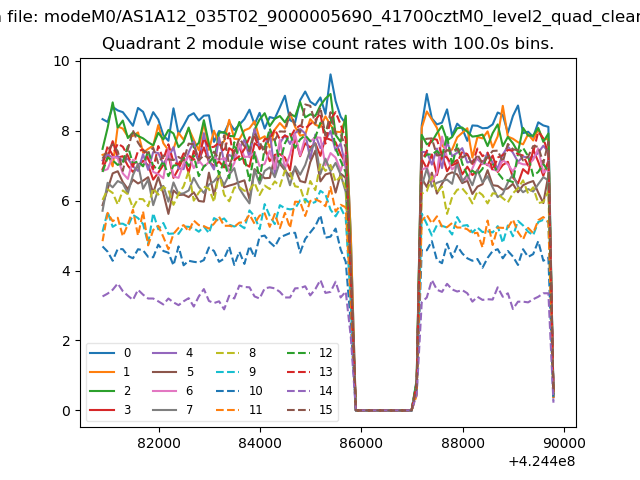
| Module-wise count rates for Quadrant B Data is divided into 100 sec bins |
 |
 |
| Module-wise count rates for Quadrant C Data is divided into 100 sec bins |
 |
 |
| Module-wise count rates for Quadrant D Data is divided into 100 sec bins |
 |
 |
| Parameter | Plot |
|---|---|
| CZT HV Monitor | 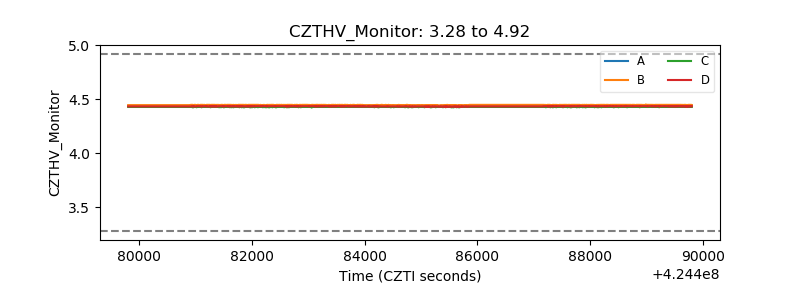 |
| D_VDD |  |
| Temperature 1 | 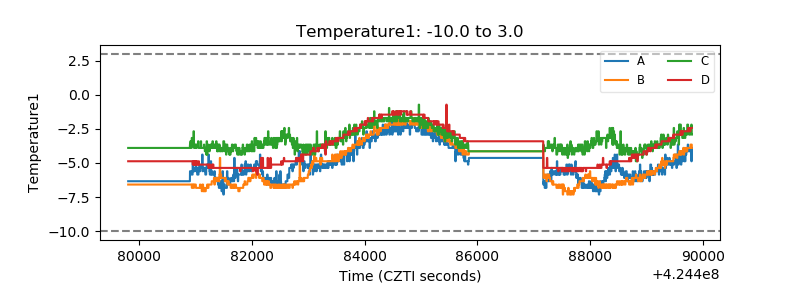 |
| Veto HV Monitor | 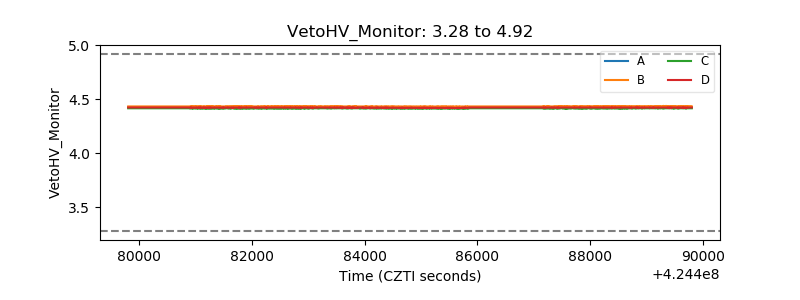 |
| Veto LLD | 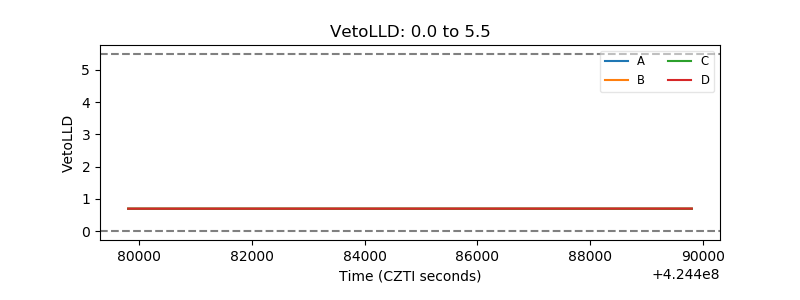 |
| Alpha Counter | 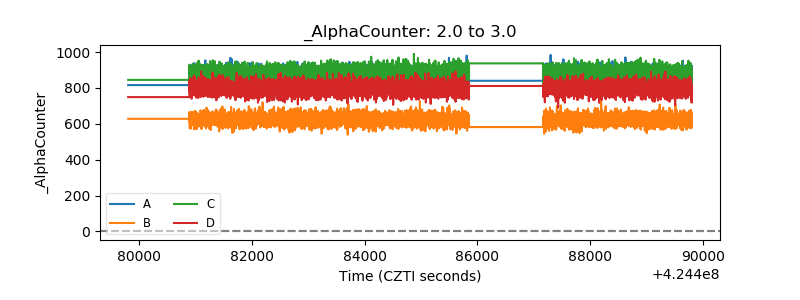 |
| _CPM_Rate | 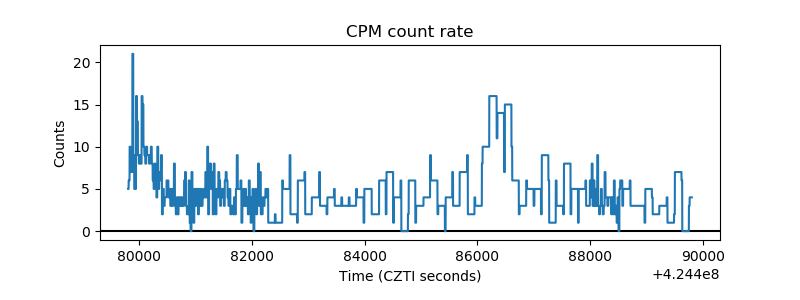 |
| CZT Counter | 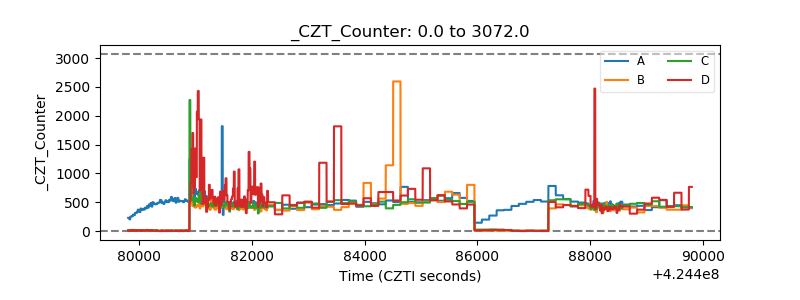 |
| +2.5 Volts monitor | 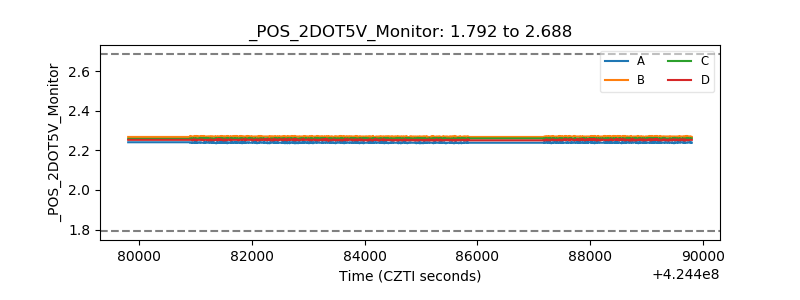 |
| +5 Volts monitor | 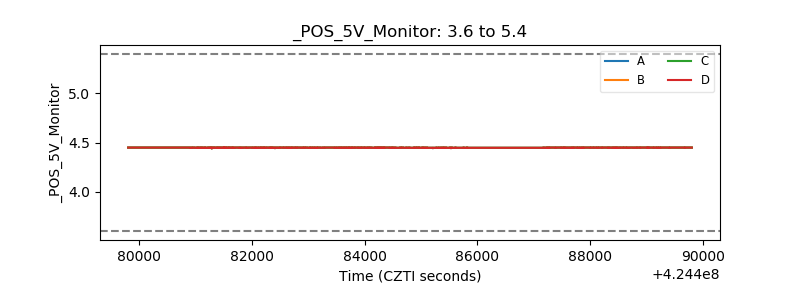 |
| _ROLL_ROT | 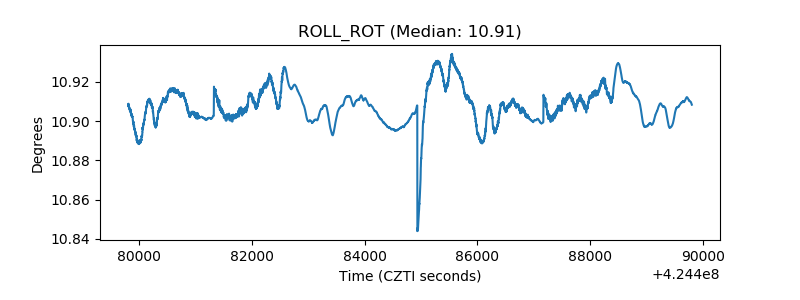 |
| _Roll_DEC | 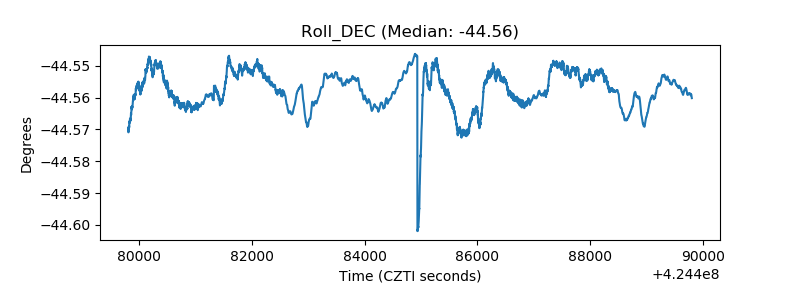 |
| _Roll_RA | 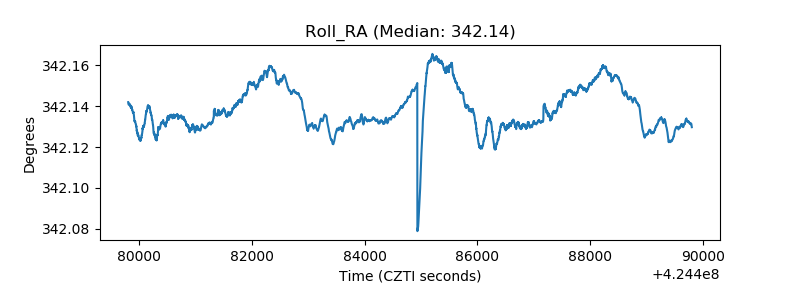 |
| Veto Counter | 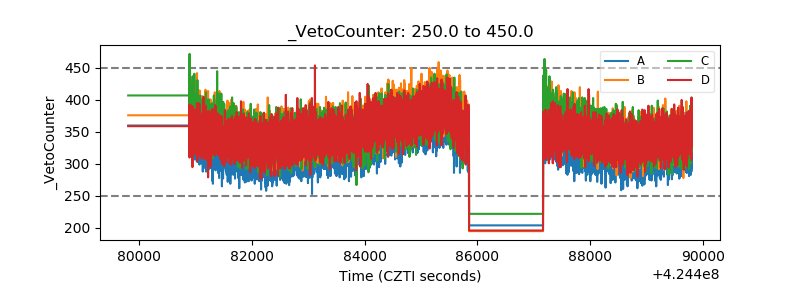 |