| Param | Original file | Final file |
|---|---|---|
| Filename | modeM0/AS1A12_077T12_9000005692_41700cztM0_level2.fits | modeM0/AS1A12_077T12_9000005692_41700cztM0_level2_quad_clean.evt |
| Size (bytes) | 370,166,400 | 106,116,480 |
| Size | 353.0 MB | 101.2 MB |
| Events in quadrant A | 3,514,164 | 708,613 |
| Events in quadrant B | 2,907,722 | 729,972 |
| Events in quadrant C | 3,179,852 | 688,014 |
| Events in quadrant D | 3,594,090 | 632,759 |
| Mode M9 | |||
|---|---|---|---|
| Quadrant | BADHDUFLAG | Total packets | Discarded packets |
| A | 0 | 28 | 0 |
| B | 0 | 28 | 0 |
| C | 0 | 28 | 0 |
| D | 0 | 28 | 0 |
| Mode M0 | |||
|---|---|---|---|
| Quadrant | BADHDUFLAG | Total packets | Discarded packets |
| A | 0 | 14179 | 2 |
| B | 0 | 13094 | 2 |
| C | 0 | 13466 | 2 |
| D | 0 | 15430 | 2 |
| Mode SS | |||
|---|---|---|---|
| Quadrant | BADHDUFLAG | Total packets | Discarded packets |
| A | 0 | 134 | 0 |
| B | 0 | 134 | 0 |
| C | 0 | 134 | 0 |
| D | 0 | 134 | 0 |
| Quadrant | Total seconds | Saturated seconds | Saturation percentage |
|---|---|---|---|
| A | 6505 | 10 | 0.153728% |
| B | 6505 | 6 | 0.092237% |
| C | 6504 | 29 | 0.445879% |
| D | 6504 | 165 | 2.536900% |
Noise dominated data is calculated using 1-second bins in cleaned event files. If a bin has >2000 counts, and if more than 50% of those come from <1% of pixels, then it is considered to be noise-dominated and hence unusable.
| Quadrant | # 1 sec bins | Bins with >0 counts | Bins with >2000 counts | High rate bins dominated by noise | Noise dominated (total time) | Noise dominated (detector-on time) | Marked lightcurve |
|---|---|---|---|---|---|---|---|
| A | 9341 | 6507 | 4 | 4 | 0.04% | 0.06% | 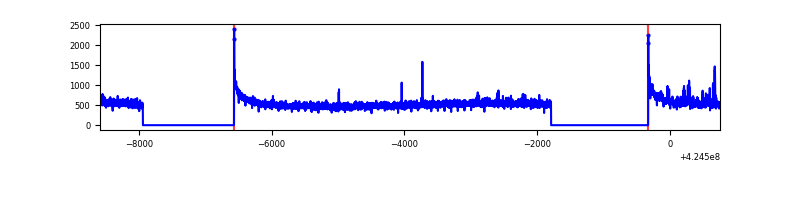 |
| B | 9341 | 6507 | 0 | 0 | 0.00% | 0.00% | 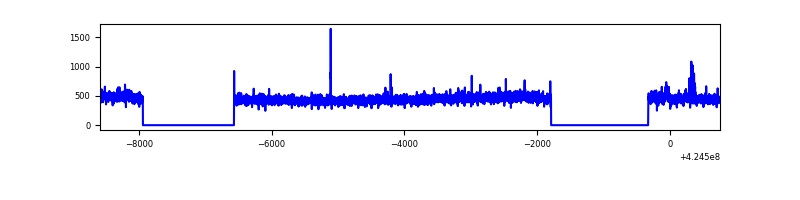 |
| C | 9340 | 6506 | 33 | 33 | 0.35% | 0.51% | 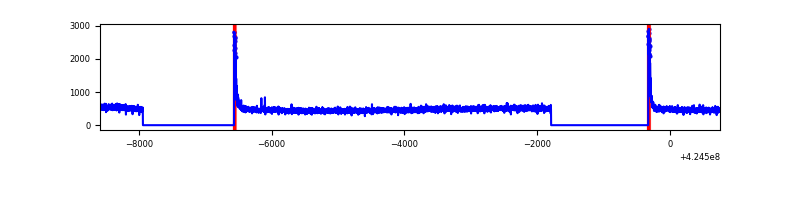 |
| D | 9340 | 6506 | 139 | 139 | 1.49% | 2.14% | 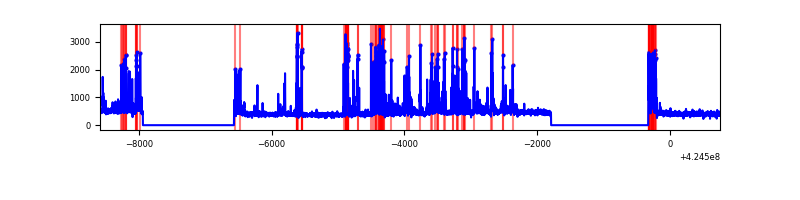 |
Top three noisy pixels from each quadrant. If the there are fewer than three noisy pixels in the level2.evt file, extra rows are filled as -1
| Pixel properties | Quadrant properties | ||||||
|---|---|---|---|---|---|---|---|
| Quadrant | DetID | PixID | Counts | Sigma | Mean | Median | Sigma |
| A | 10 | 83 | 606354 | 4007.26 | 732 | 717 | 151.1 |
| A | 9 | 240 | 55737 | 364.05 | 732 | 717 | 151.1 |
| A | 6 | 10 | 12237 | 76.22 | 732 | 717 | 151.1 |
| B | 0 | 245 | 31301 | 214.21 | 727 | 706 | 142.8 |
| B | 12 | 111 | 18482 | 124.46 | 727 | 706 | 142.8 |
| B | 11 | 111 | 17343 | 116.49 | 727 | 706 | 142.8 |
| C | 15 | 214 | 267995 | 1602.99 | 712 | 716 | 166.7 |
| C | 0 | 10 | 131367 | 783.57 | 712 | 716 | 166.7 |
| C | 15 | 159 | 4894 | 25.06 | 712 | 716 | 166.7 |
| D | 2 | 249 | 482217 | 2772.56 | 705 | 684 | 173.7 |
| D | 13 | 249 | 231391 | 1328.36 | 705 | 684 | 173.7 |
| D | 12 | 6 | 132846 | 760.96 | 705 | 684 | 173.7 |
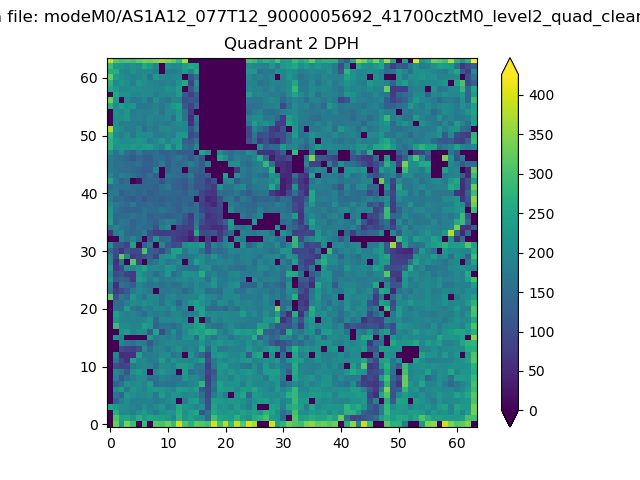
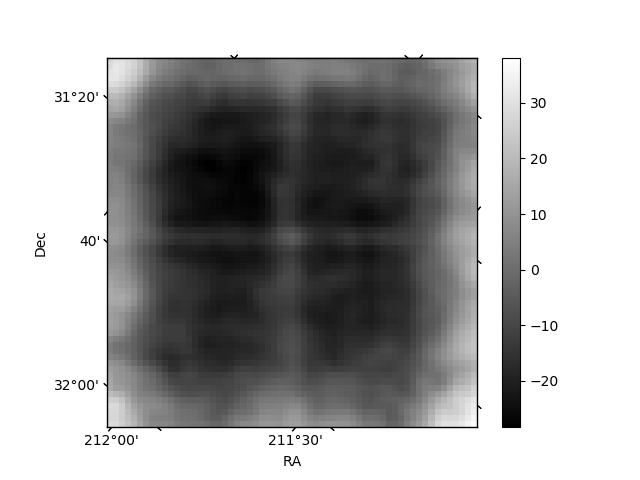
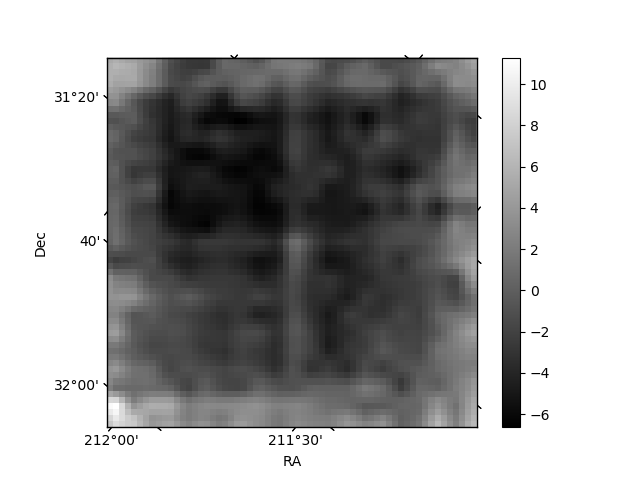
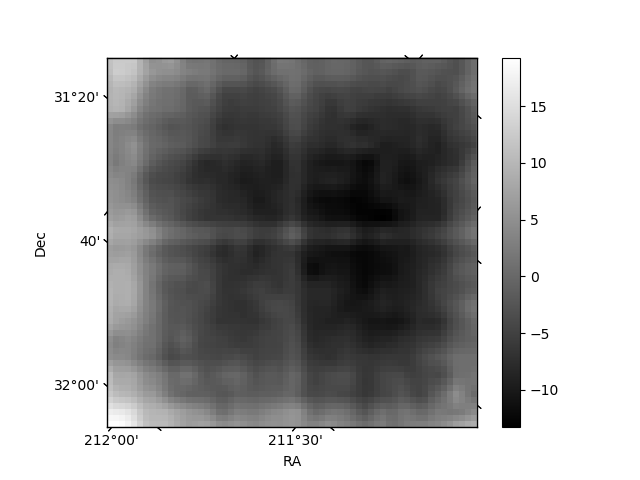
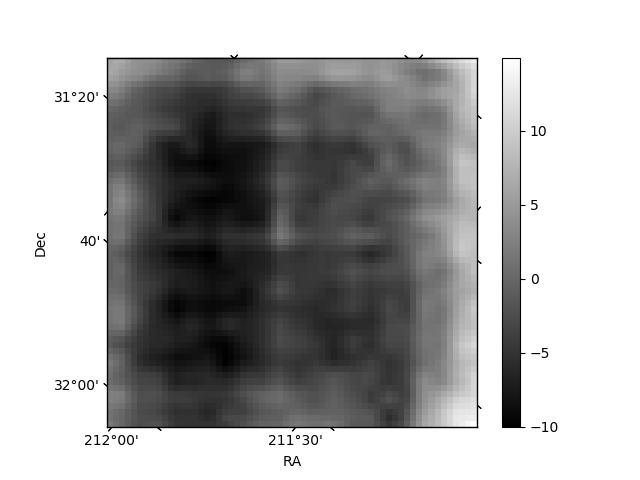
Histogram calculated using DETX and DETY for each event in the final _common_clean file
| Quadrant A | 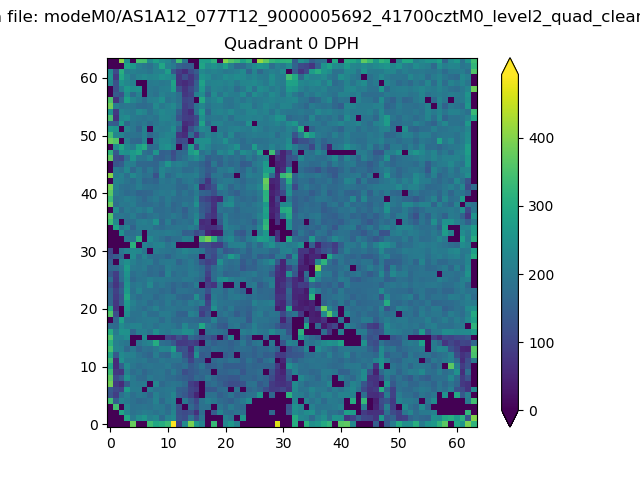 |
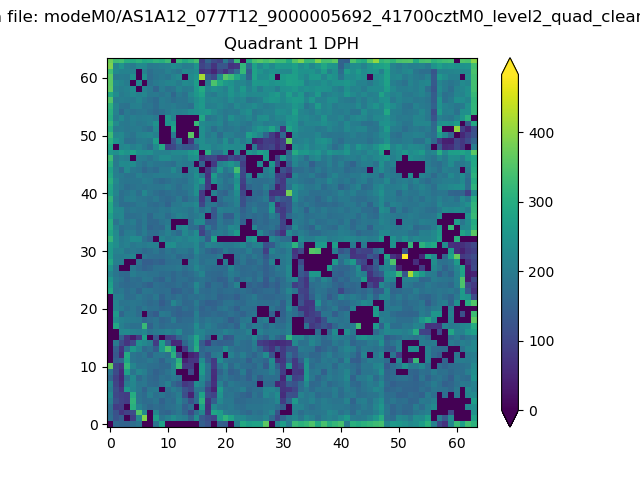 |
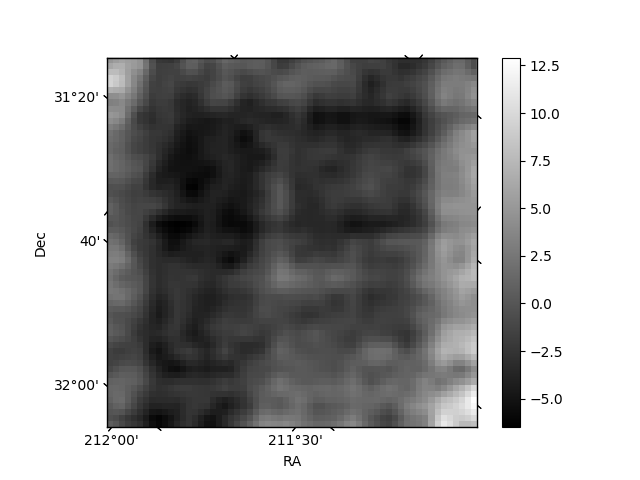
Quadrant B |
|---|---|---|---|
| Quadrant D | 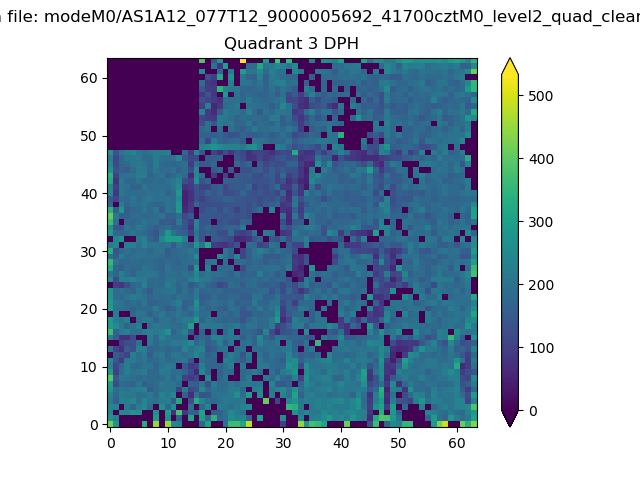 |
 |
Quadrant C |
| Plot type | Count rate plots | Images |
|---|---|---|
| Comparison with Poisson distribution Blue bars denote a histogram of data divided into 1 sec bins. Red curve is a Poisson curve with rate = median count rate of data. |
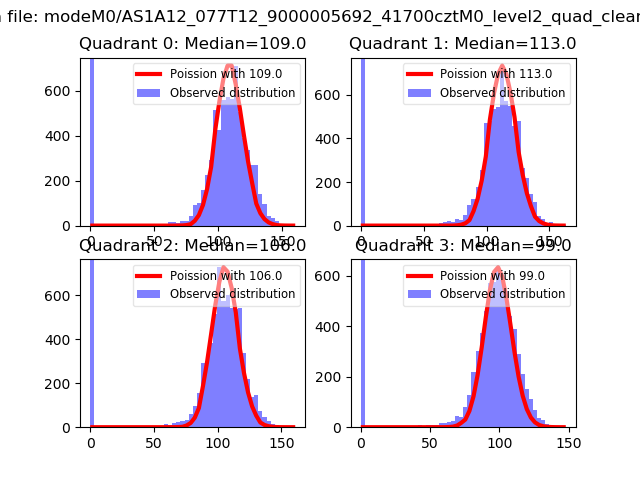 |
 |
| Quadrant-wise count rates Data is divided into 100 sec bins |
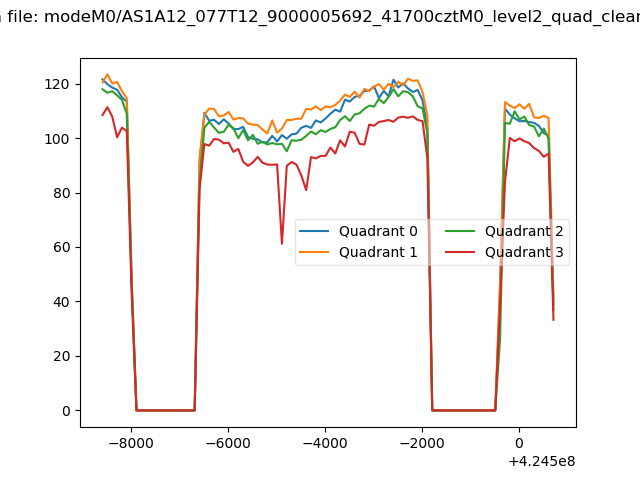 |
|
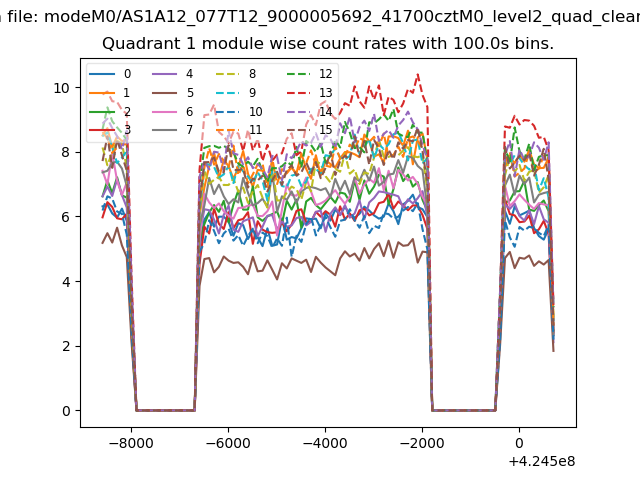
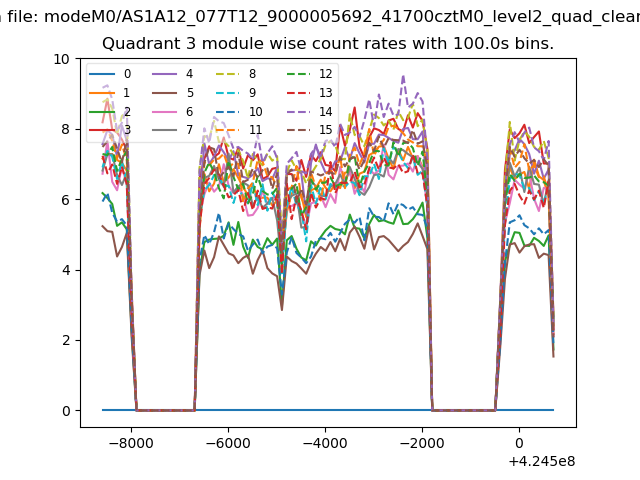
| Module-wise count rates for Quadrant A Data is divided into 100 sec bins |
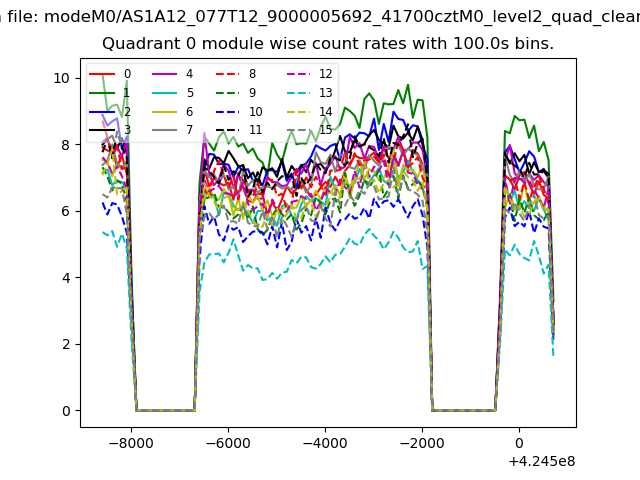 |
 |
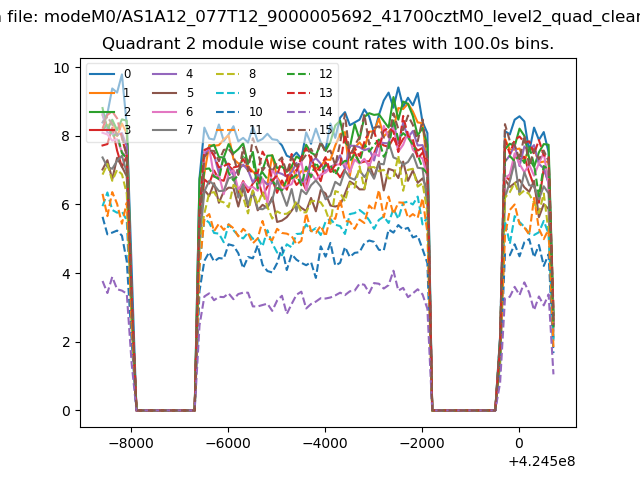
| Module-wise count rates for Quadrant B Data is divided into 100 sec bins |
 |
 |
| Module-wise count rates for Quadrant C Data is divided into 100 sec bins |
 |
 |
| Module-wise count rates for Quadrant D Data is divided into 100 sec bins |
 |
 |
| Parameter | Plot |
|---|---|
| CZT HV Monitor | 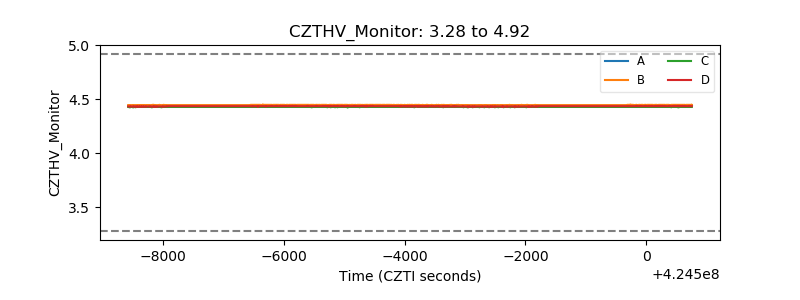 |
| D_VDD | 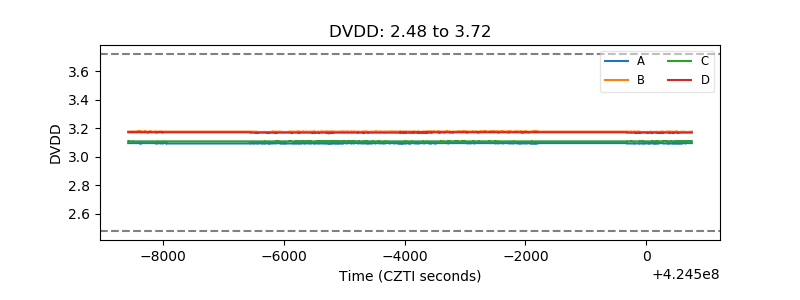 |
| Temperature 1 | 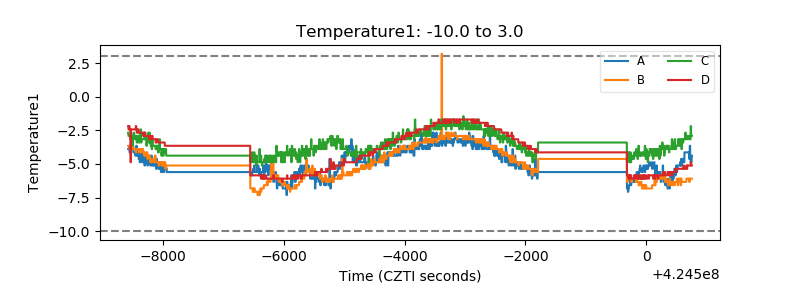 |
| Veto HV Monitor | 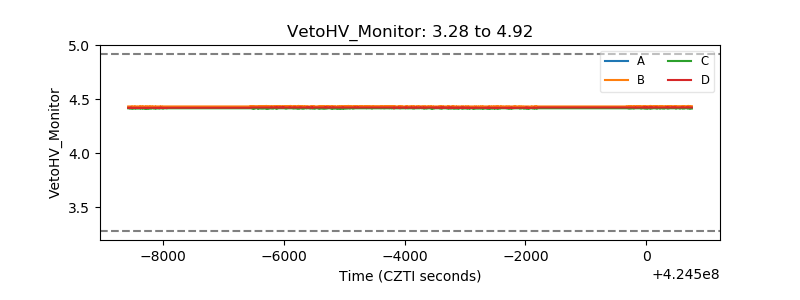 |
| Veto LLD | 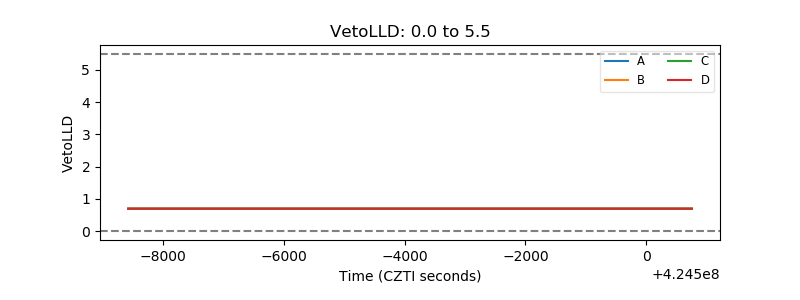 |
| Alpha Counter | 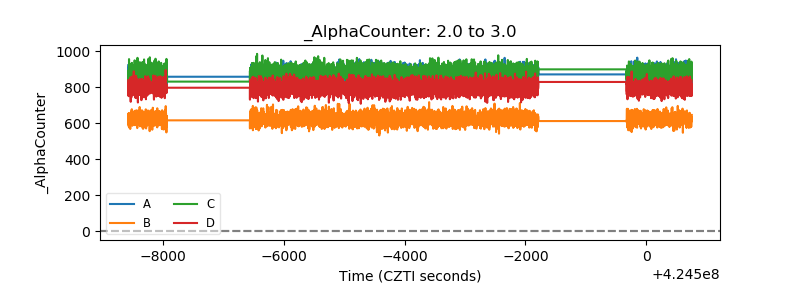 |
| _CPM_Rate | 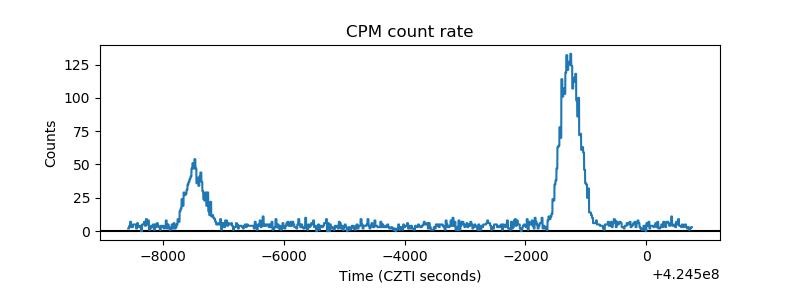 |
| CZT Counter | 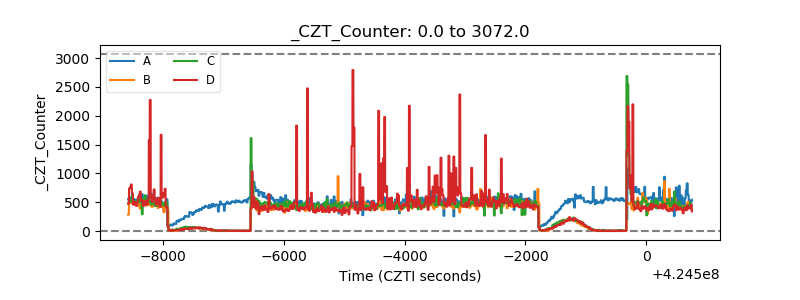 |
| +2.5 Volts monitor | 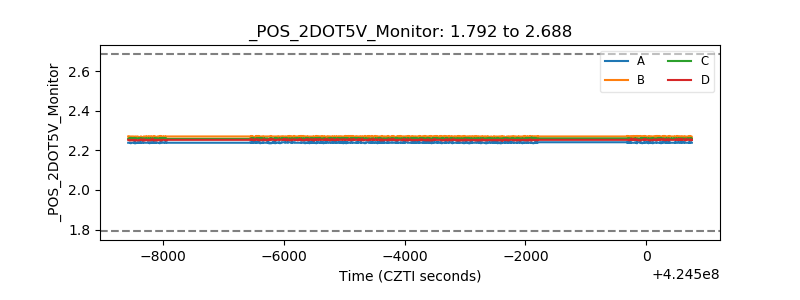 |
| +5 Volts monitor | 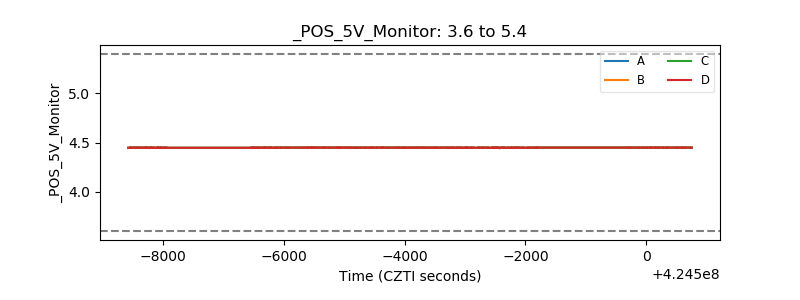 |
| _ROLL_ROT | 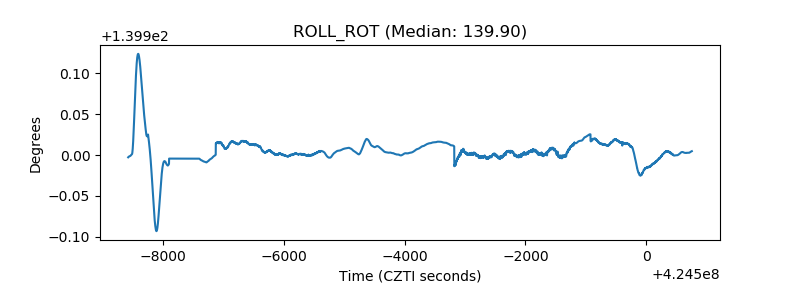 |
| _Roll_DEC |  |
| _Roll_RA | 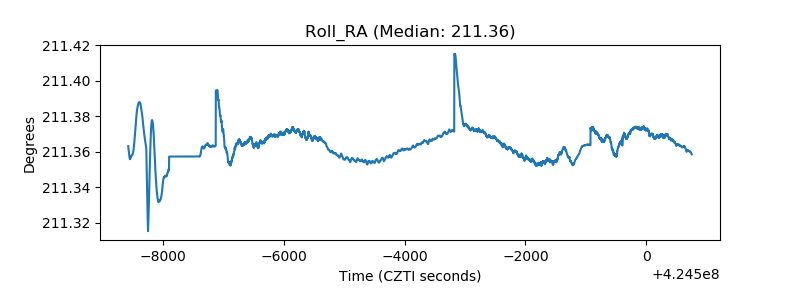 |
| Veto Counter | 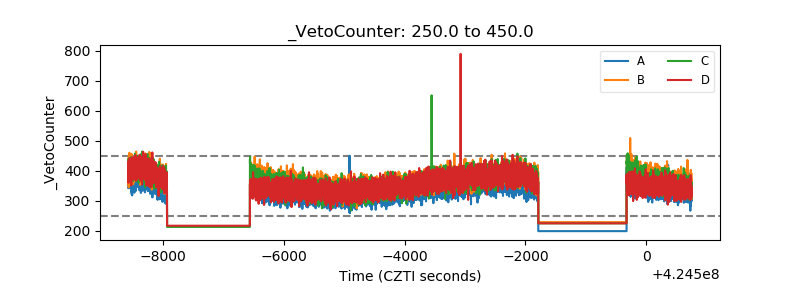 |