| Param | Original file | Final file |
|---|---|---|
| Filename | modeM0/AS1A12_077T12_9000005692_41702cztM0_level2.fits | modeM0/AS1A12_077T12_9000005692_41702cztM0_level2_quad_clean.evt |
| Size (bytes) | 308,018,880 | 87,575,040 |
| Size | 293.7 MB | 83.5 MB |
| Events in quadrant A | 2,928,323 | 592,851 |
| Events in quadrant B | 2,394,856 | 612,196 |
| Events in quadrant C | 2,767,737 | 558,156 |
| Events in quadrant D | 2,900,728 | 520,490 |
| Mode M9 | |||
|---|---|---|---|
| Quadrant | BADHDUFLAG | Total packets | Discarded packets |
| A | 0 | 29 | 0 |
| B | 0 | 30 | 0 |
| C | 0 | 30 | 0 |
| D | 0 | 30 | 0 |
| Mode M0 | |||
|---|---|---|---|
| Quadrant | BADHDUFLAG | Total packets | Discarded packets |
| A | 0 | 11910 | 2 |
| B | 0 | 10585 | 2 |
| C | 0 | 11473 | 2 |
| D | 0 | 12281 | 2 |
| Mode SS | |||
|---|---|---|---|
| Quadrant | BADHDUFLAG | Total packets | Discarded packets |
| A | 0 | 106 | 0 |
| B | 0 | 106 | 0 |
| C | 0 | 106 | 0 |
| D | 0 | 106 | 0 |
| Quadrant | Total seconds | Saturated seconds | Saturation percentage |
|---|---|---|---|
| A | 5260 | 19 | 0.361217% |
| B | 5260 | 9 | 0.171103% |
| C | 5260 | 113 | 2.148289% |
| D | 5259 | 129 | 2.452938% |
Noise dominated data is calculated using 1-second bins in cleaned event files. If a bin has >2000 counts, and if more than 50% of those come from <1% of pixels, then it is considered to be noise-dominated and hence unusable.
| Quadrant | # 1 sec bins | Bins with >0 counts | Bins with >2000 counts | High rate bins dominated by noise | Noise dominated (total time) | Noise dominated (detector-on time) | Marked lightcurve |
|---|---|---|---|---|---|---|---|
| A | 6994 | 5261 | 5 | 5 | 0.07% | 0.10% | 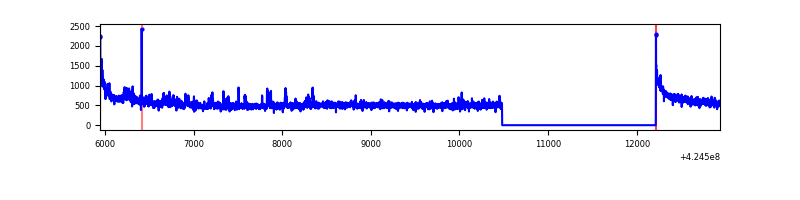 |
| B | 6994 | 5261 | 0 | 0 | 0.00% | 0.00% | 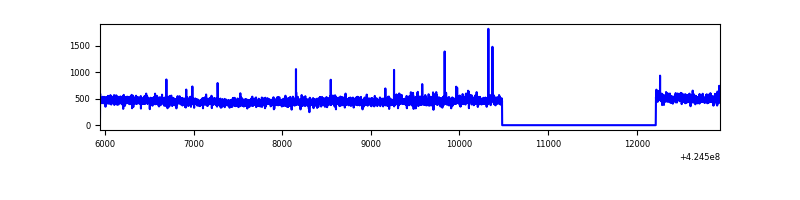 |
| C | 6994 | 5261 | 107 | 107 | 1.53% | 2.03% | 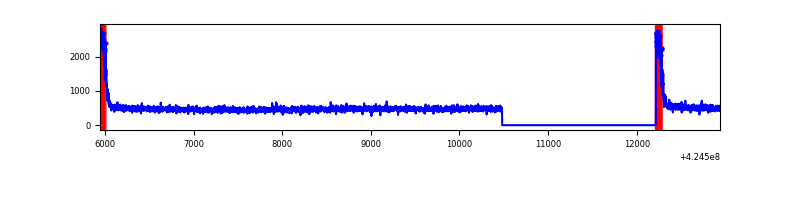 |
| D | 6993 | 5260 | 116 | 116 | 1.66% | 2.21% | 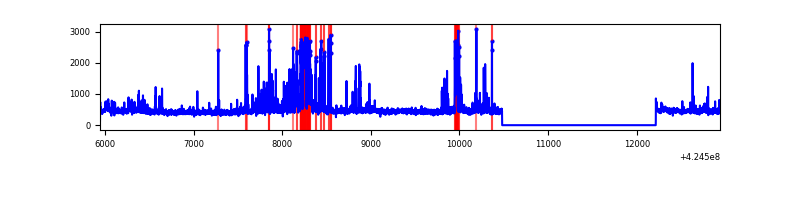 |
Top three noisy pixels from each quadrant. If the there are fewer than three noisy pixels in the level2.evt file, extra rows are filled as -1
| Pixel properties | Quadrant properties | ||||||
|---|---|---|---|---|---|---|---|
| Quadrant | DetID | PixID | Counts | Sigma | Mean | Median | Sigma |
| A | 10 | 83 | 501539 | 4053.86 | 599 | 587 | 123.6 |
| A | 9 | 240 | 99401 | 799.63 | 599 | 587 | 123.6 |
| A | 3 | 137 | 6683 | 49.33 | 599 | 587 | 123.6 |
| B | 0 | 245 | 47127 | 400.37 | 594 | 576 | 116.3 |
| B | 12 | 111 | 14941 | 123.55 | 594 | 576 | 116.3 |
| B | 11 | 111 | 14129 | 116.56 | 594 | 576 | 116.3 |
| C | 0 | 10 | 306194 | 2260.95 | 575 | 577 | 135.2 |
| C | 15 | 214 | 217184 | 1602.45 | 575 | 577 | 135.2 |
| C | 13 | 61 | 3921 | 24.74 | 575 | 577 | 135.2 |
| D | 2 | 249 | 291761 | 2040.92 | 577 | 562 | 142.7 |
| D | 13 | 249 | 206237 | 1441.51 | 577 | 562 | 142.7 |
| D | 2 | 120 | 151565 | 1058.33 | 577 | 562 | 142.7 |
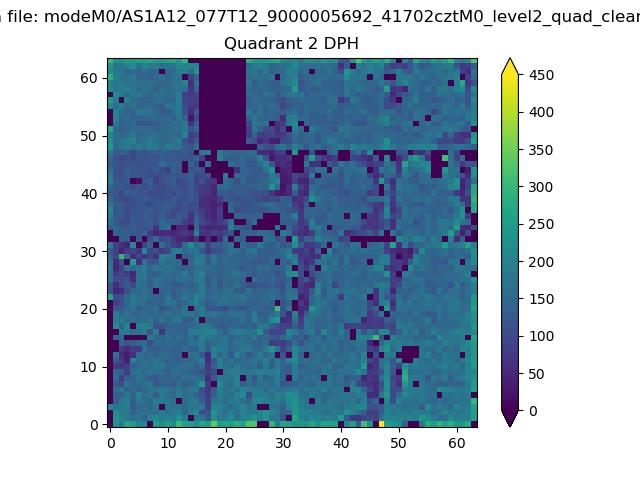
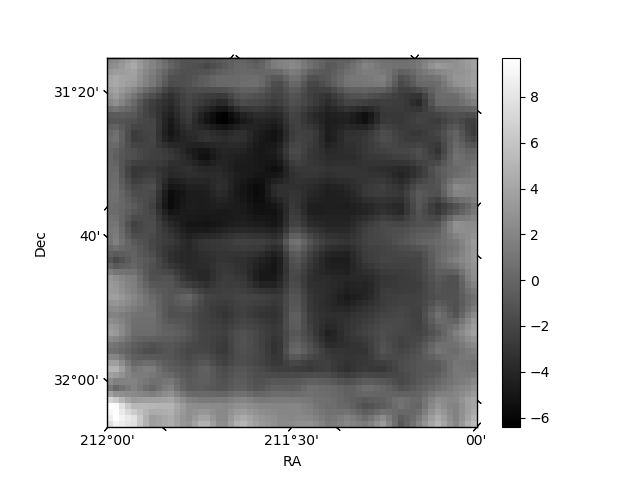
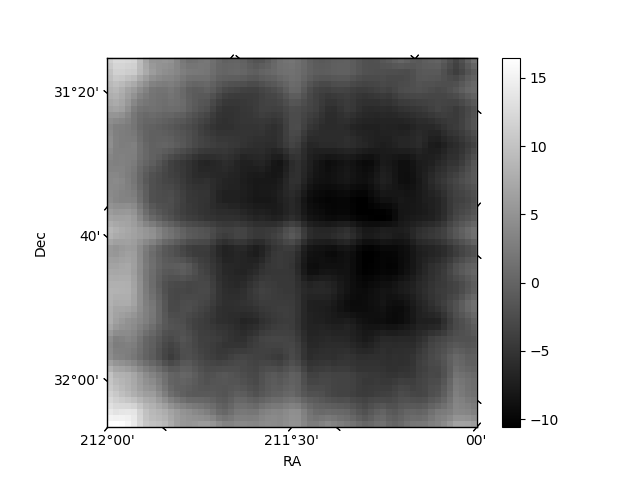
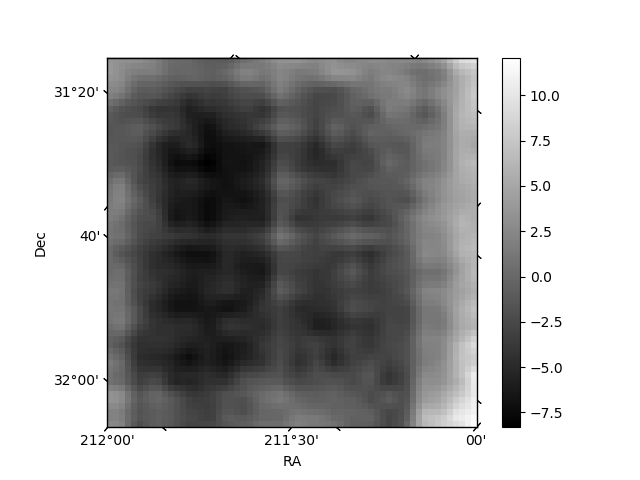
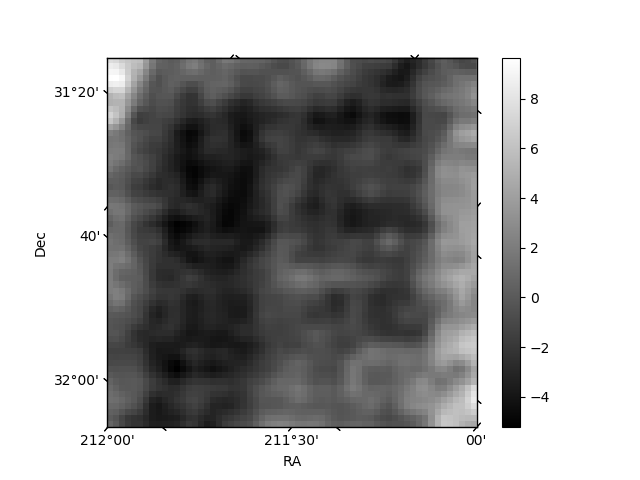
Histogram calculated using DETX and DETY for each event in the final _common_clean file
| Quadrant A | 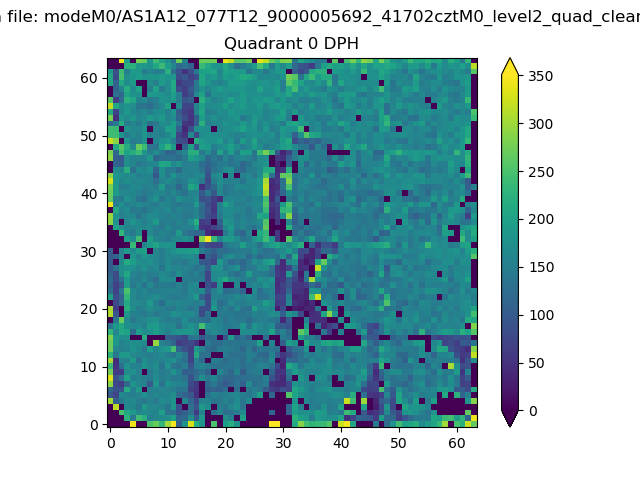 |
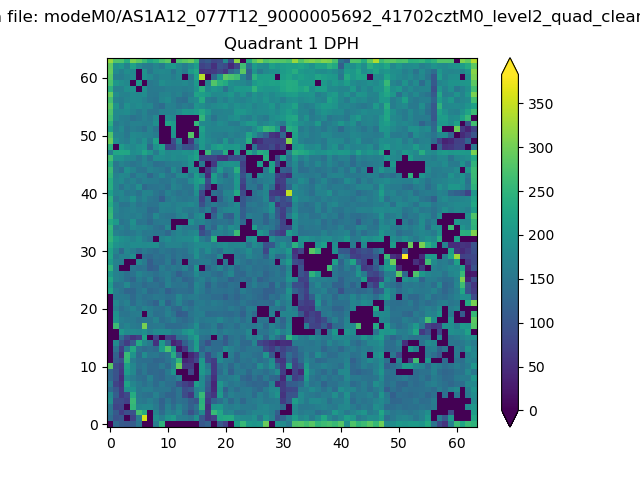 |
Quadrant B |
|---|---|---|---|
| Quadrant D | 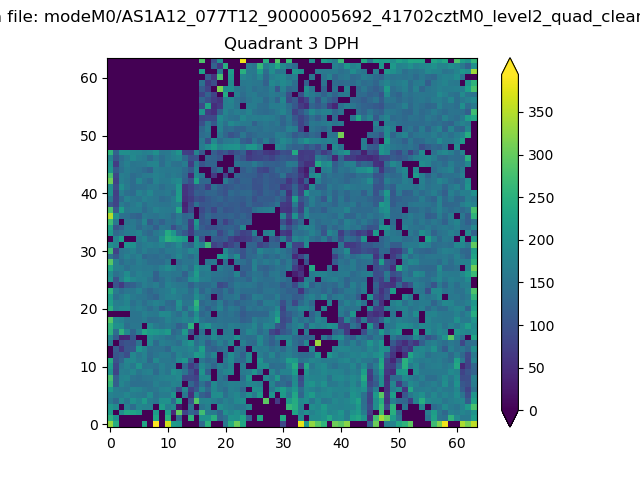 |
 |
Quadrant C |
| Plot type | Count rate plots | Images |
|---|---|---|
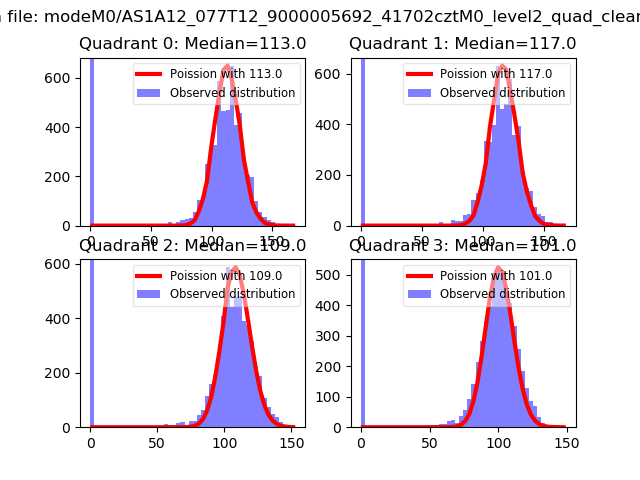
| Comparison with Poisson distribution Blue bars denote a histogram of data divided into 1 sec bins. Red curve is a Poisson curve with rate = median count rate of data. |
 |
 |
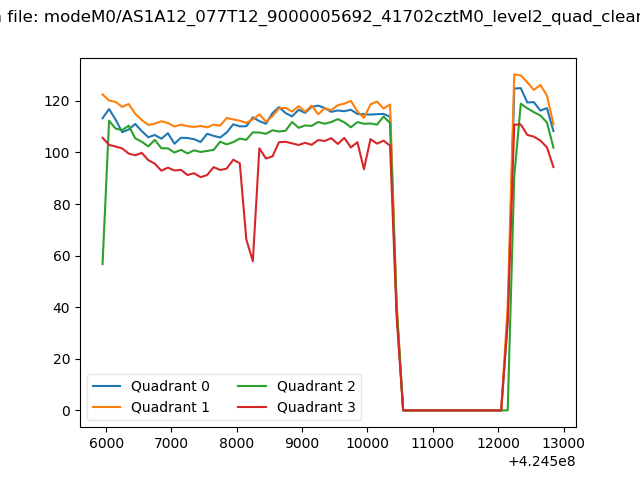
| Quadrant-wise count rates Data is divided into 100 sec bins |
 |
|
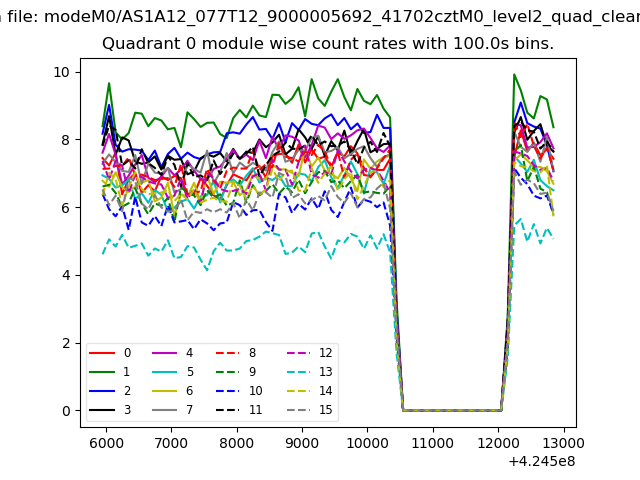
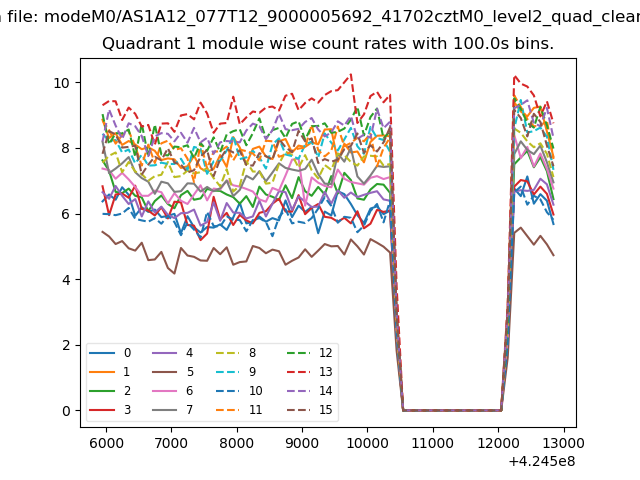
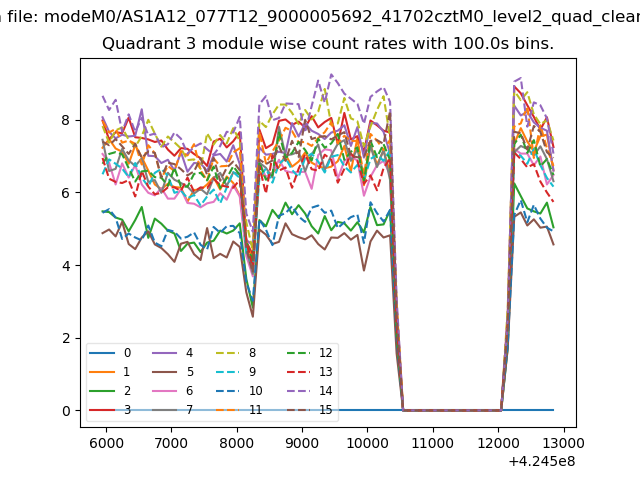
| Module-wise count rates for Quadrant A Data is divided into 100 sec bins |
 |
 |
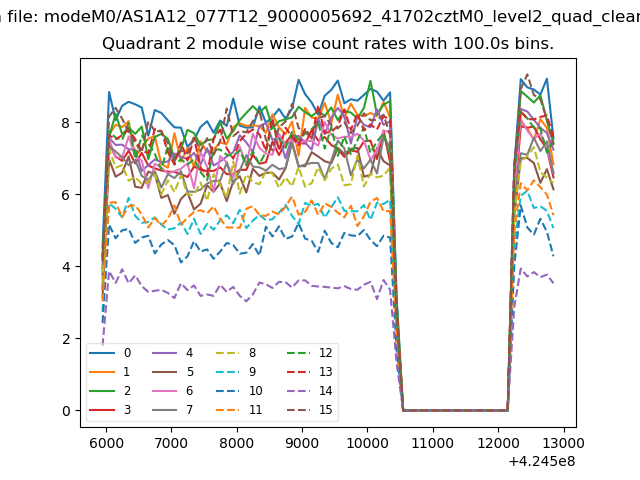
| Module-wise count rates for Quadrant B Data is divided into 100 sec bins |
 |
 |
| Module-wise count rates for Quadrant C Data is divided into 100 sec bins |
 |
 |
| Module-wise count rates for Quadrant D Data is divided into 100 sec bins |
 |
 |
| Parameter | Plot |
|---|---|
| CZT HV Monitor | 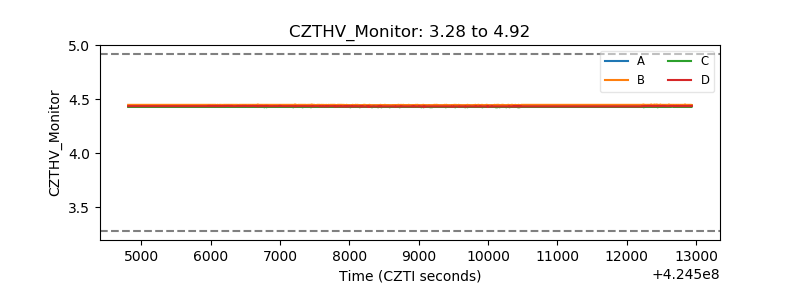 |
| D_VDD | 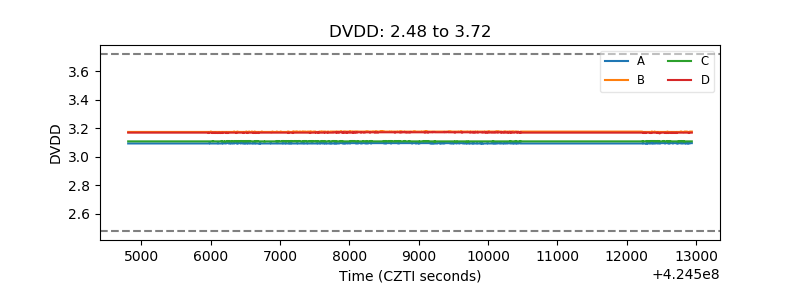 |
| Temperature 1 | 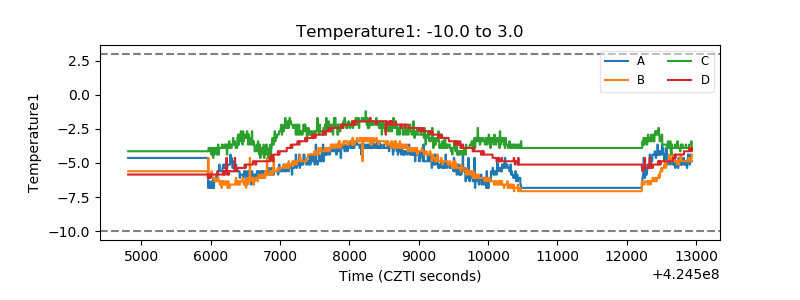 |
| Veto HV Monitor | 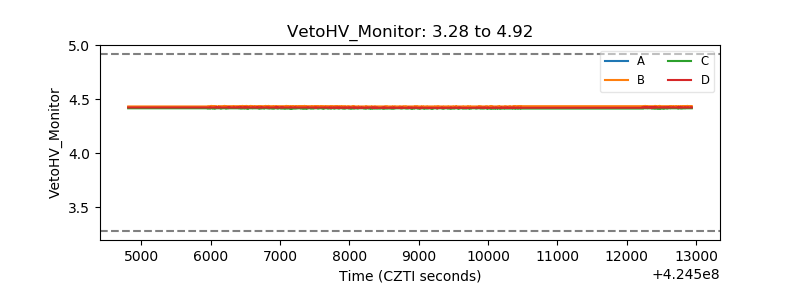 |
| Veto LLD | 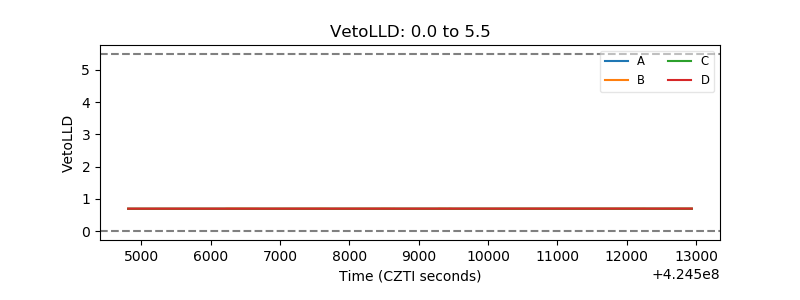 |
| Alpha Counter | 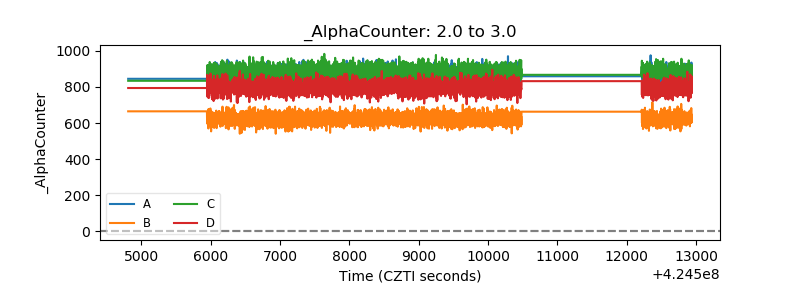 |
| _CPM_Rate | 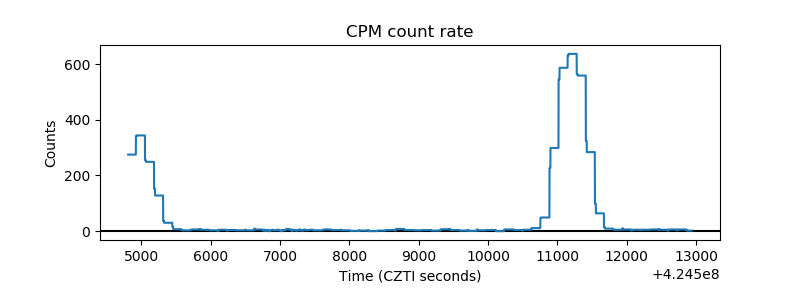 |
| CZT Counter | 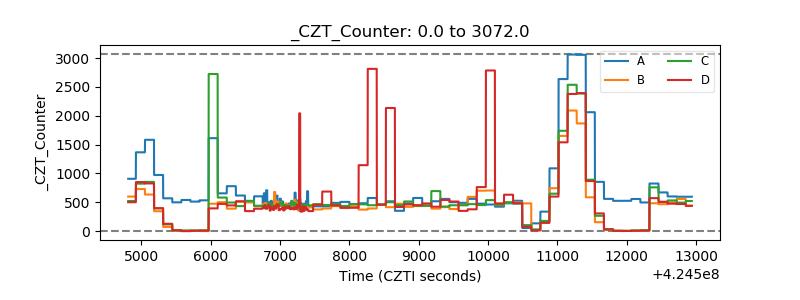 |
| +2.5 Volts monitor | 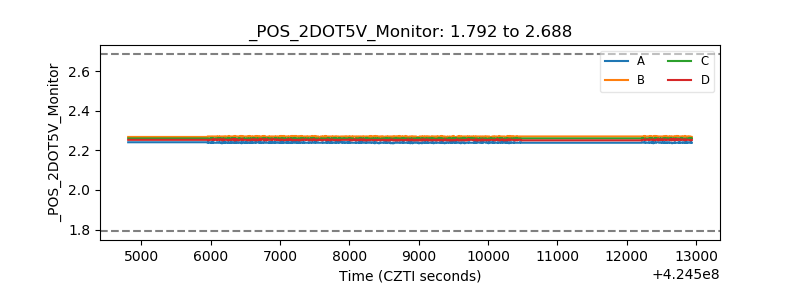 |
| +5 Volts monitor | 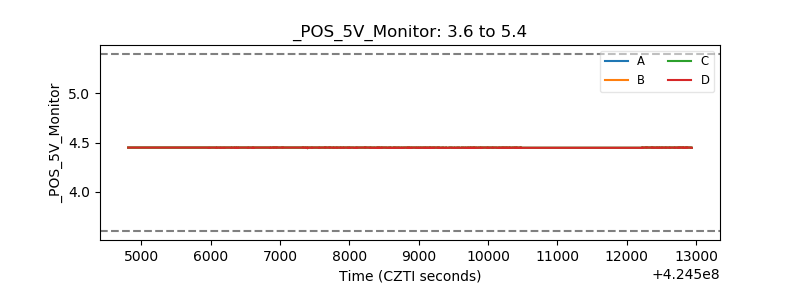 |
| _ROLL_ROT | 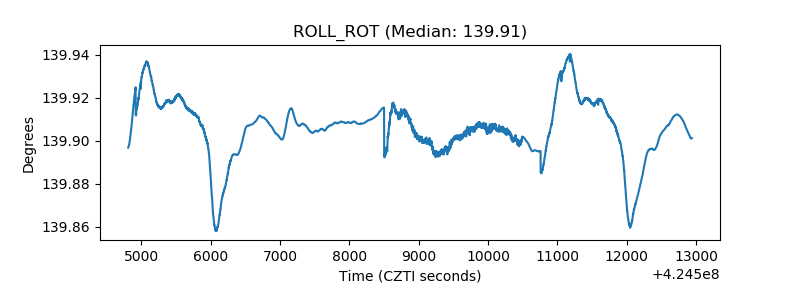 |
| _Roll_DEC | 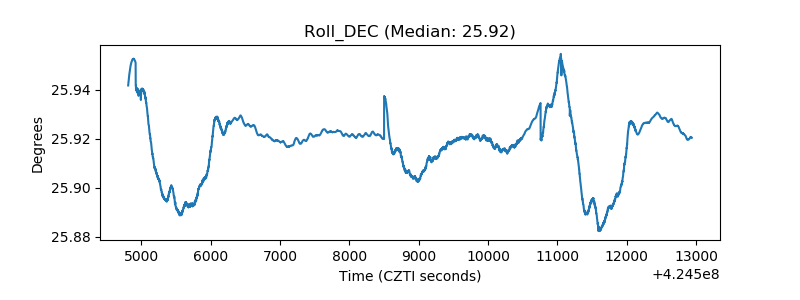 |
| _Roll_RA | 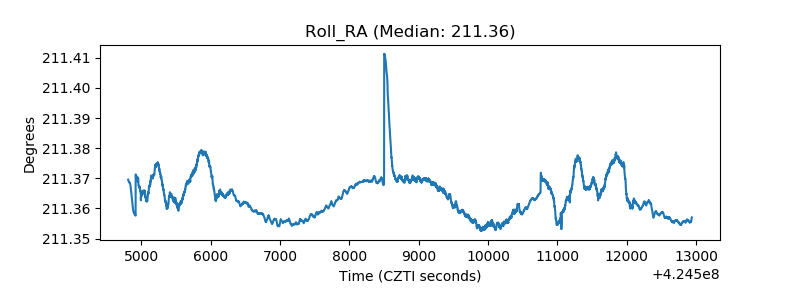 |
| Veto Counter | 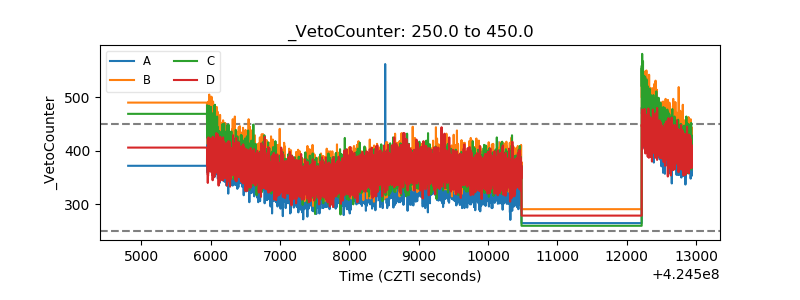 |