| Param | Original file | Final file |
|---|---|---|
| Filename | modeM0/AS1A12_077T12_9000005692_41704cztM0_level2.fits | modeM0/AS1A12_077T12_9000005692_41704cztM0_level2_quad_clean.evt |
| Size (bytes) | 364,201,920 | 104,166,720 |
| Size | 347.3 MB | 99.3 MB |
| Events in quadrant A | 3,346,647 | 712,229 |
| Events in quadrant B | 2,955,169 | 732,012 |
| Events in quadrant C | 3,114,592 | 672,512 |
| Events in quadrant D | 3,598,699 | 619,433 |
| Mode M9 | |||
|---|---|---|---|
| Quadrant | BADHDUFLAG | Total packets | Discarded packets |
| A | 0 | 36 | 0 |
| B | 0 | 36 | 0 |
| C | 0 | 36 | 0 |
| D | 0 | 36 | 0 |
| Mode M0 | |||
|---|---|---|---|
| Quadrant | BADHDUFLAG | Total packets | Discarded packets |
| A | 0 | 13466 | 2 |
| B | 0 | 12482 | 2 |
| C | 0 | 12817 | 2 |
| D | 0 | 14585 | 2 |
| Mode SS | |||
|---|---|---|---|
| Quadrant | BADHDUFLAG | Total packets | Discarded packets |
| A | 0 | 122 | 0 |
| B | 0 | 122 | 0 |
| C | 0 | 122 | 0 |
| D | 0 | 122 | 0 |
| Quadrant | Total seconds | Saturated seconds | Saturation percentage |
|---|---|---|---|
| A | 5993 | 20 | 0.333723% |
| B | 5994 | 17 | 0.283617% |
| C | 5994 | 85 | 1.418085% |
| D | 5994 | 158 | 2.635969% |
Noise dominated data is calculated using 1-second bins in cleaned event files. If a bin has >2000 counts, and if more than 50% of those come from <1% of pixels, then it is considered to be noise-dominated and hence unusable.
| Quadrant | # 1 sec bins | Bins with >0 counts | Bins with >2000 counts | High rate bins dominated by noise | Noise dominated (total time) | Noise dominated (detector-on time) | Marked lightcurve |
|---|---|---|---|---|---|---|---|
| A | 9580 | 5995 | 3 | 3 | 0.03% | 0.05% | 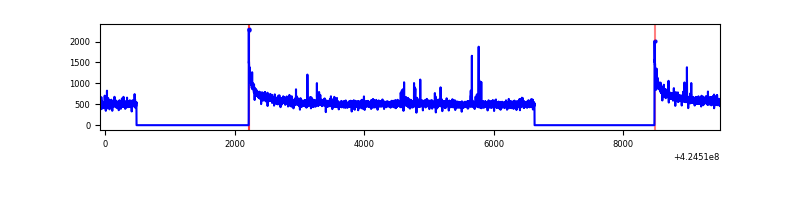 |
| B | 9581 | 5996 | 8 | 8 | 0.08% | 0.13% | 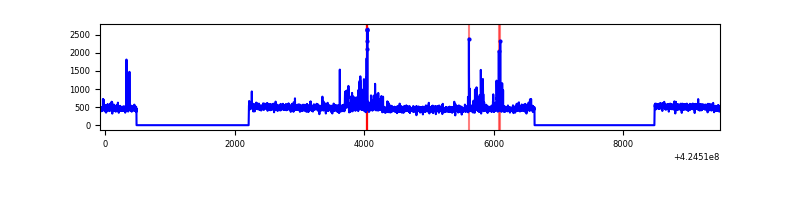 |
| C | 9581 | 5996 | 79 | 79 | 0.82% | 1.32% | 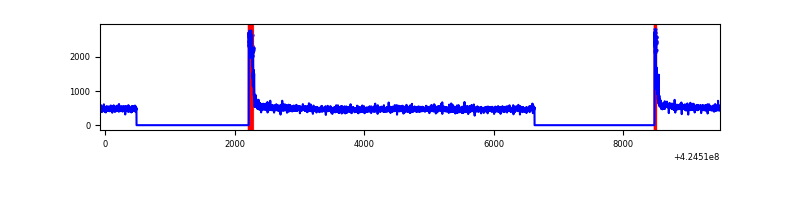 |
| D | 9581 | 5996 | 147 | 147 | 1.53% | 2.45% | 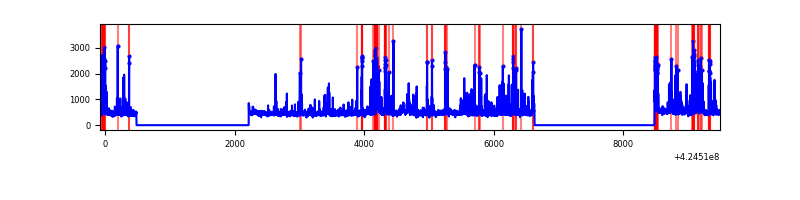 |
Top three noisy pixels from each quadrant. If the there are fewer than three noisy pixels in the level2.evt file, extra rows are filled as -1
| Pixel properties | Quadrant properties | ||||||
|---|---|---|---|---|---|---|---|
| Quadrant | DetID | PixID | Counts | Sigma | Mean | Median | Sigma |
| A | 10 | 83 | 566648 | 3903.72 | 704 | 690 | 145.0 |
| A | 13 | 248 | 23523 | 157.49 | 704 | 690 | 145.0 |
| A | 2 | 79 | 15361 | 101.19 | 704 | 690 | 145.0 |
| B | 0 | 245 | 215394 | 1590.18 | 693 | 676 | 135.0 |
| B | 12 | 111 | 17221 | 122.53 | 693 | 676 | 135.0 |
| B | 11 | 111 | 16053 | 113.88 | 693 | 676 | 135.0 |
| C | 15 | 214 | 247141 | 1563.05 | 675 | 680 | 157.7 |
| C | 0 | 10 | 224587 | 1420.01 | 675 | 680 | 157.7 |
| C | 15 | 111 | 12697 | 76.21 | 675 | 680 | 157.7 |
| D | 13 | 249 | 390615 | 2376.74 | 673 | 655 | 164.1 |
| D | 2 | 249 | 276413 | 1680.7 | 673 | 655 | 164.1 |
| D | 2 | 120 | 172479 | 1047.24 | 673 | 655 | 164.1 |
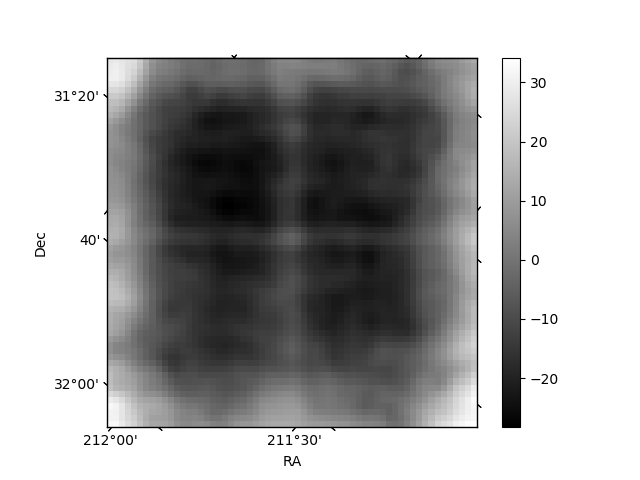
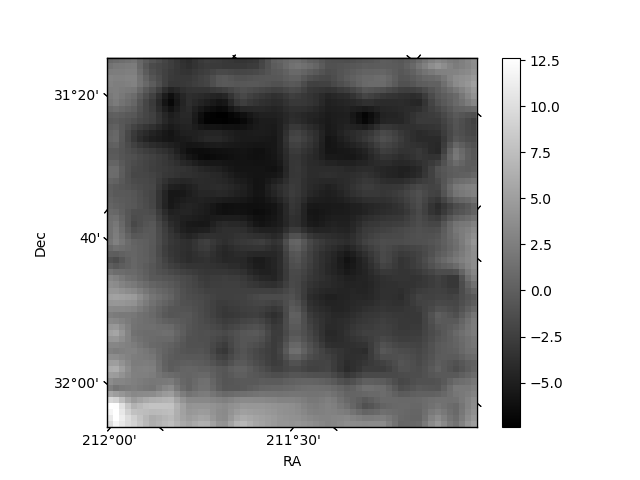
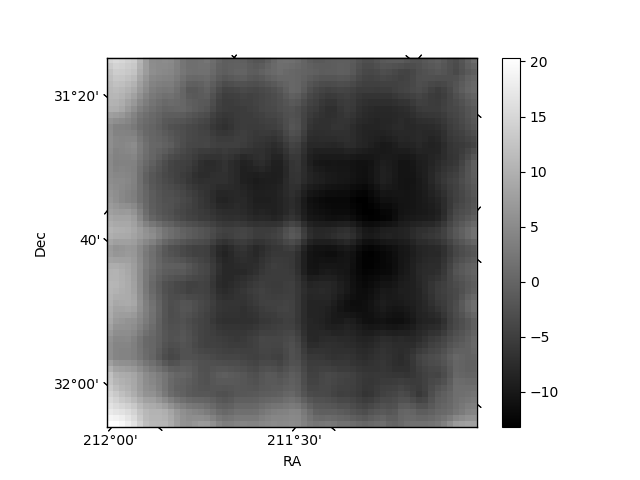
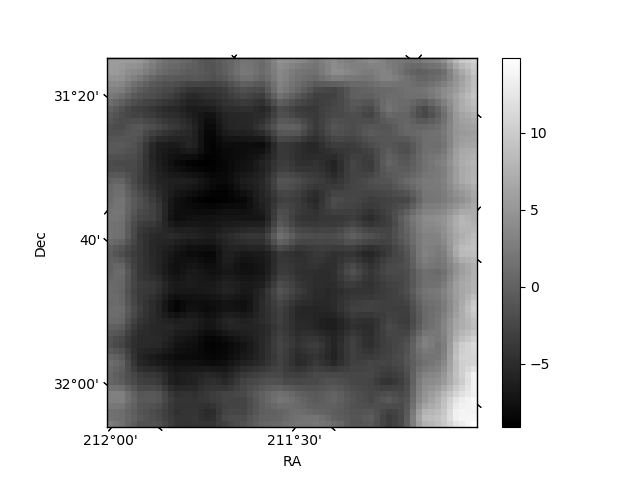
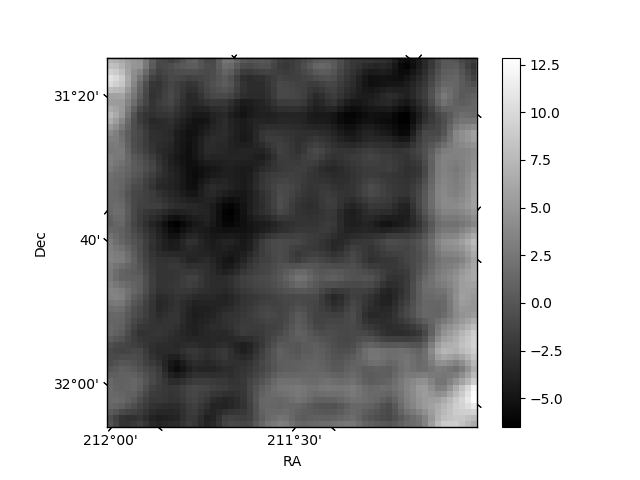
Histogram calculated using DETX and DETY for each event in the final _common_clean file
| Quadrant A | 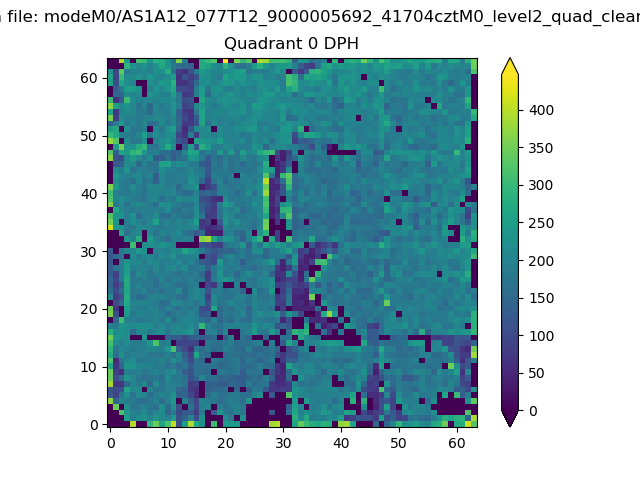 |
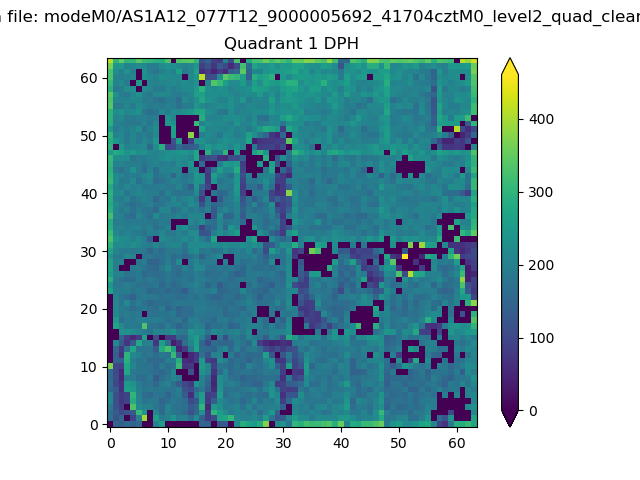 |
Quadrant B |
|---|---|---|---|
| Quadrant D | 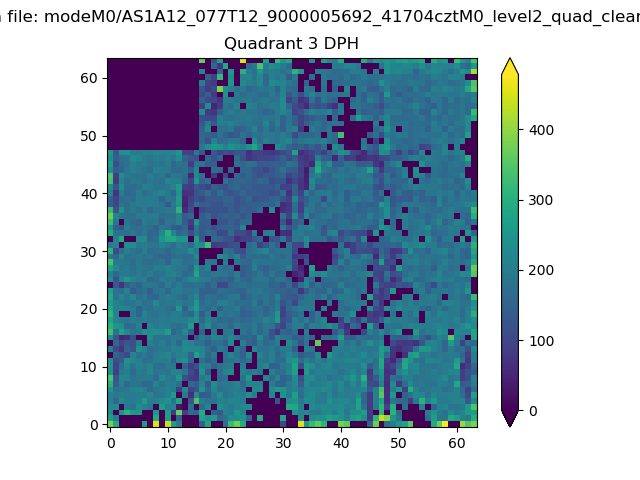 |
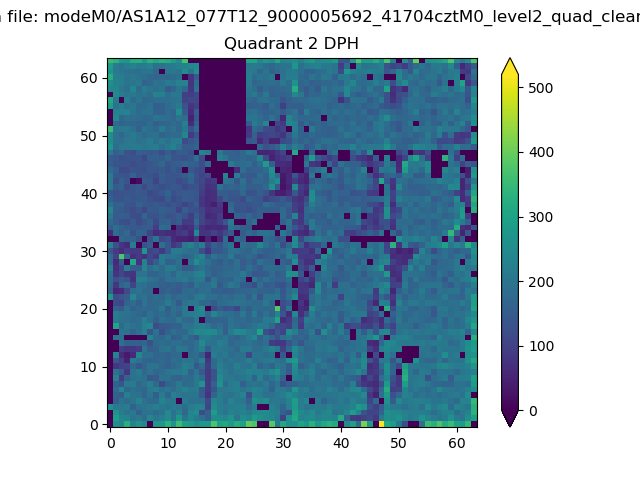 |
Quadrant C |
| Plot type | Count rate plots | Images |
|---|---|---|
| Comparison with Poisson distribution Blue bars denote a histogram of data divided into 1 sec bins. Red curve is a Poisson curve with rate = median count rate of data. |
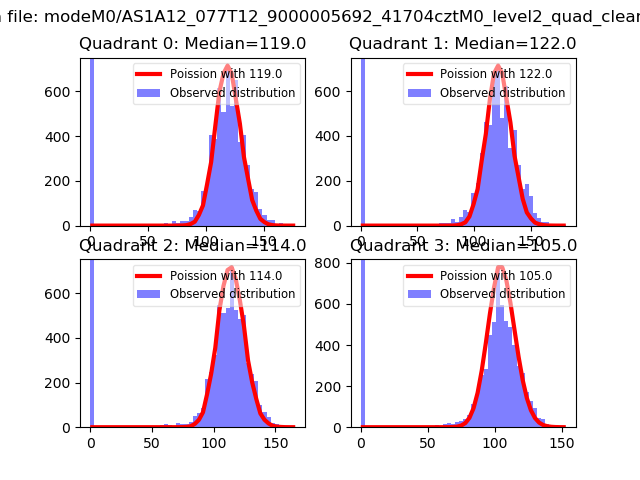 |
 |
| Quadrant-wise count rates Data is divided into 100 sec bins |
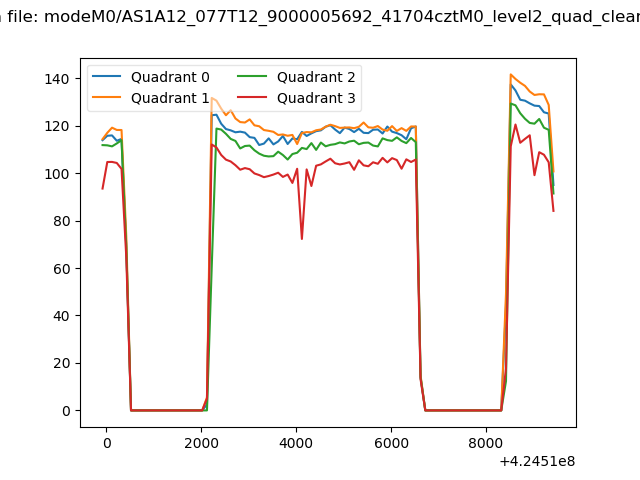 |
|
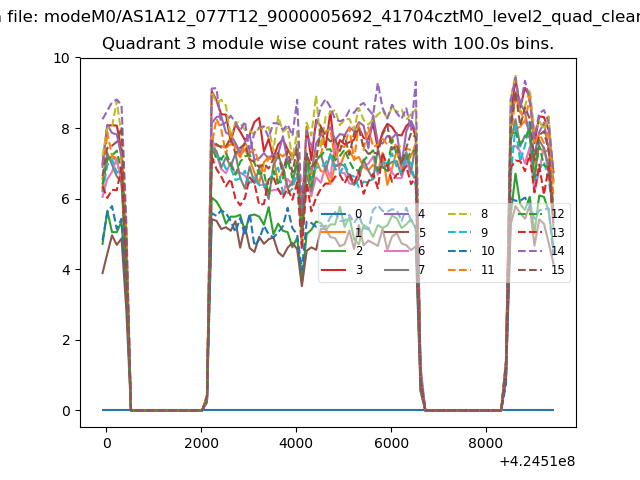
| Module-wise count rates for Quadrant A Data is divided into 100 sec bins |
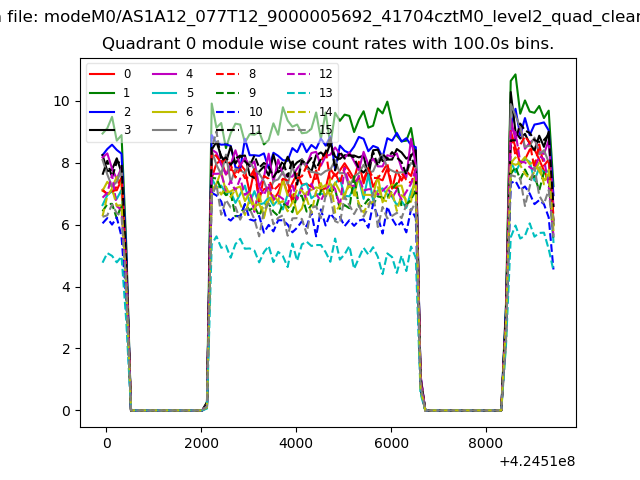 |
 |
| Module-wise count rates for Quadrant B Data is divided into 100 sec bins |
 |
 |
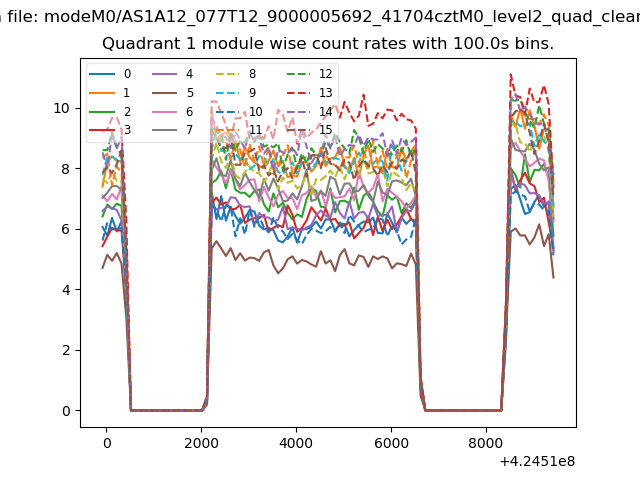
| Module-wise count rates for Quadrant C Data is divided into 100 sec bins |
 |
 |
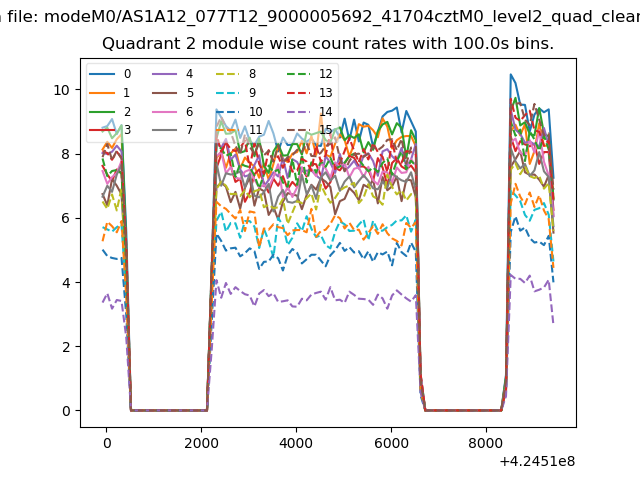
| Module-wise count rates for Quadrant D Data is divided into 100 sec bins |
 |
 |
| Parameter | Plot |
|---|---|
| CZT HV Monitor | 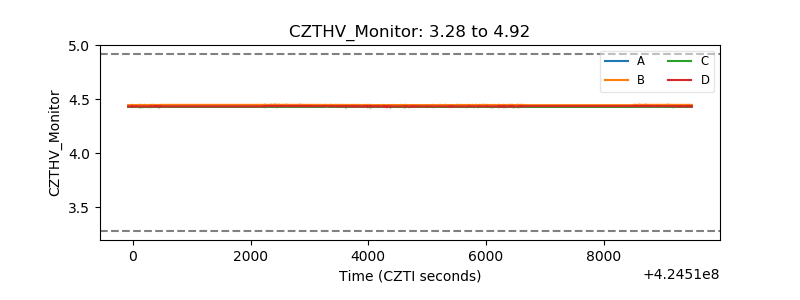 |
| D_VDD | 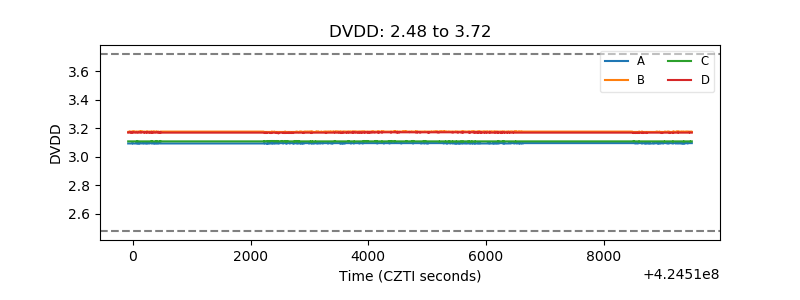 |
| Temperature 1 | 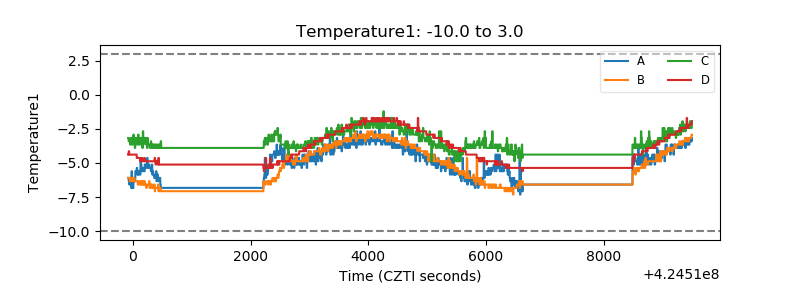 |
| Veto HV Monitor | 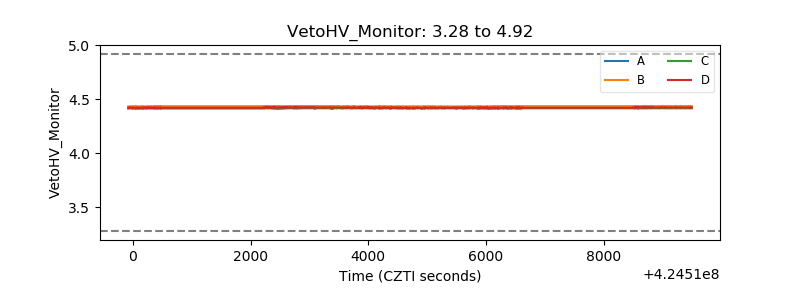 |
| Veto LLD | 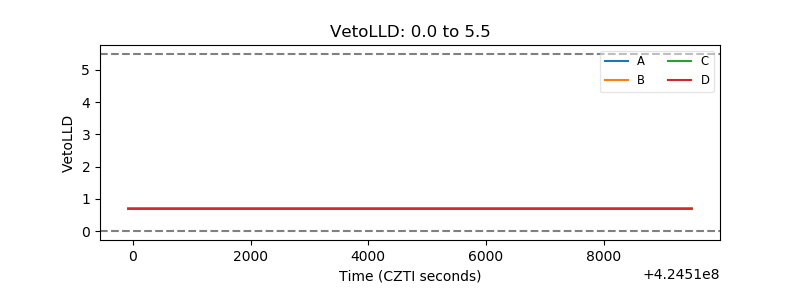 |
| Alpha Counter | 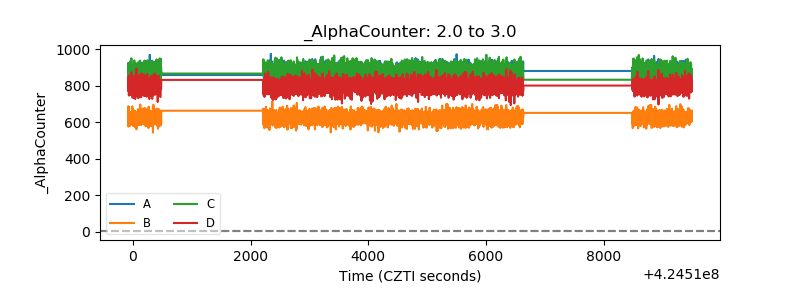 |
| _CPM_Rate | 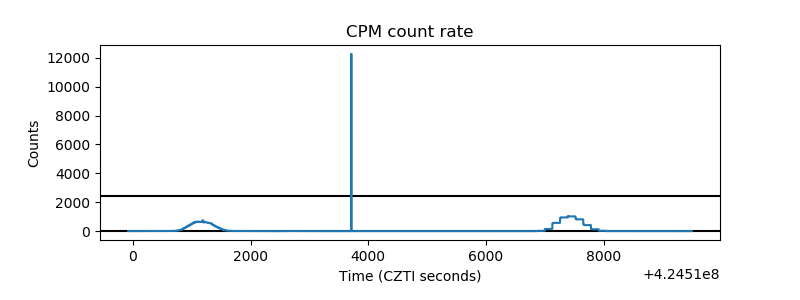 |
| CZT Counter | 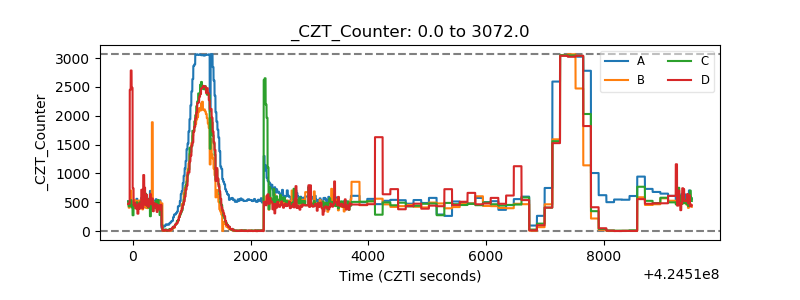 |
| +2.5 Volts monitor | 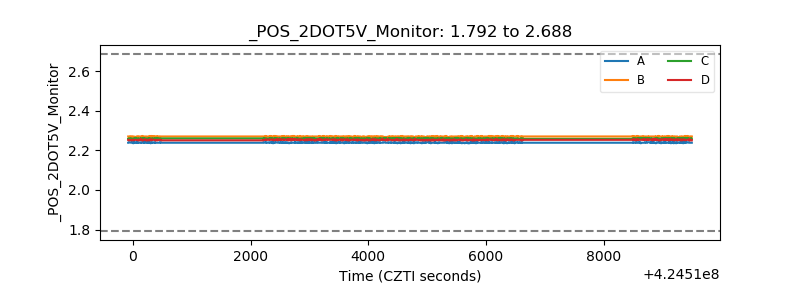 |
| +5 Volts monitor | 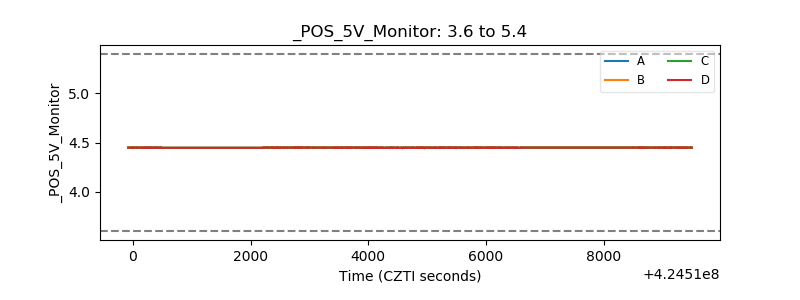 |
| _ROLL_ROT | 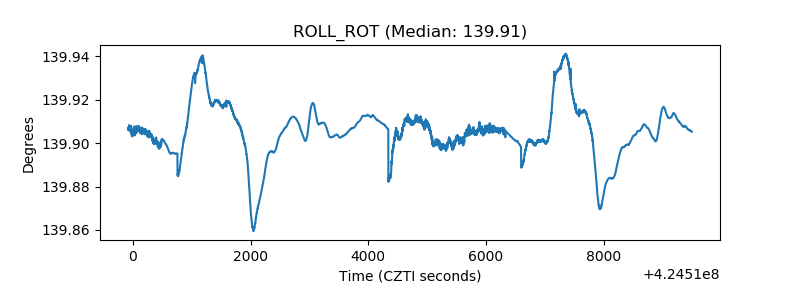 |
| _Roll_DEC | 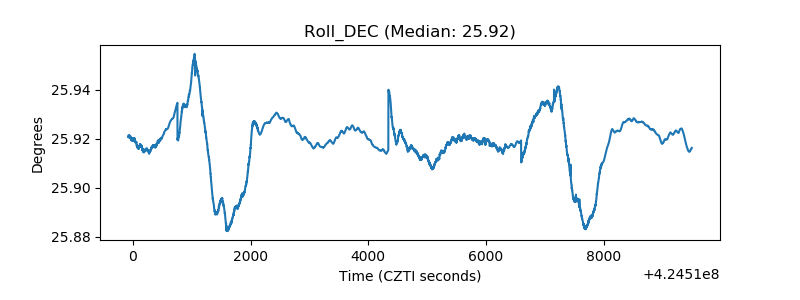 |
| _Roll_RA | 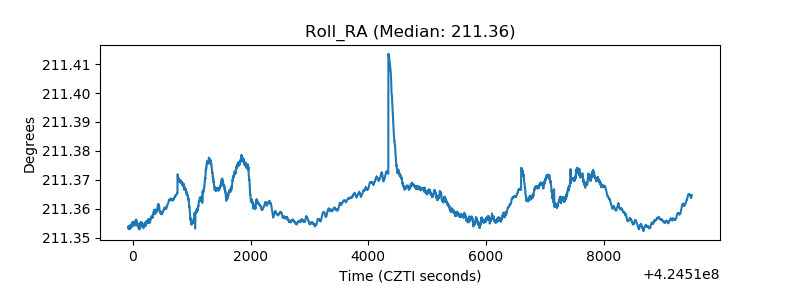 |
| Veto Counter | 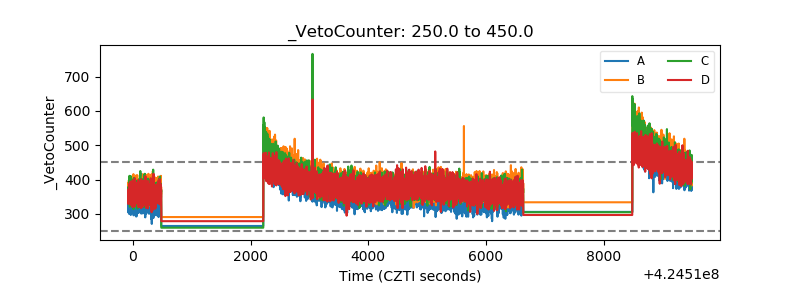 |