| Param | Original file | Final file |
|---|---|---|
| Filename | modeM0/AS1A12_077T12_9000005692_41705cztM0_level2.fits | modeM0/AS1A12_077T12_9000005692_41705cztM0_level2_quad_clean.evt |
| Size (bytes) | 373,890,240 | 96,206,400 |
| Size | 356.6 MB | 91.7 MB |
| Events in quadrant A | 3,098,493 | 679,018 |
| Events in quadrant B | 2,552,678 | 694,997 |
| Events in quadrant C | 2,829,684 | 642,475 |
| Events in quadrant D | 4,939,385 | 519,301 |
| Mode M9 | |||
|---|---|---|---|
| Quadrant | BADHDUFLAG | Total packets | Discarded packets |
| A | 0 | 20 | 0 |
| B | 0 | 20 | 0 |
| C | 0 | 21 | 0 |
| D | 0 | 21 | 0 |
| Mode M0 | |||
|---|---|---|---|
| Quadrant | BADHDUFLAG | Total packets | Discarded packets |
| A | 0 | 12447 | 2 |
| B | 0 | 10913 | 2 |
| C | 0 | 11504 | 2 |
| D | 0 | 18132 | 2 |
| Mode SS | |||
|---|---|---|---|
| Quadrant | BADHDUFLAG | Total packets | Discarded packets |
| A | 0 | 110 | 0 |
| B | 0 | 110 | 0 |
| C | 0 | 110 | 0 |
| D | 0 | 110 | 0 |
| Quadrant | Total seconds | Saturated seconds | Saturation percentage |
|---|---|---|---|
| A | 5392 | 20 | 0.370920% |
| B | 5392 | 6 | 0.111276% |
| C | 5392 | 42 | 0.778932% |
| D | 5392 | 827 | 15.337537% |
Noise dominated data is calculated using 1-second bins in cleaned event files. If a bin has >2000 counts, and if more than 50% of those come from <1% of pixels, then it is considered to be noise-dominated and hence unusable.
| Quadrant | # 1 sec bins | Bins with >0 counts | Bins with >2000 counts | High rate bins dominated by noise | Noise dominated (total time) | Noise dominated (detector-on time) | Marked lightcurve |
|---|---|---|---|---|---|---|---|
| A | 7334 | 5393 | 2 | 2 | 0.03% | 0.04% | 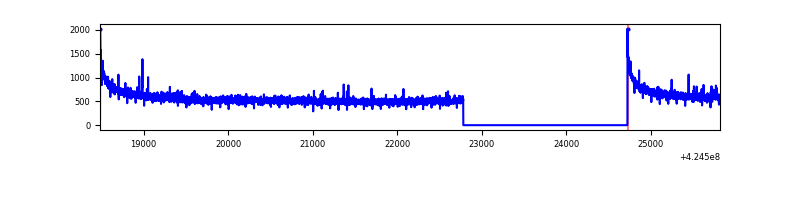 |
| B | 7334 | 5393 | 1 | 1 | 0.01% | 0.02% | 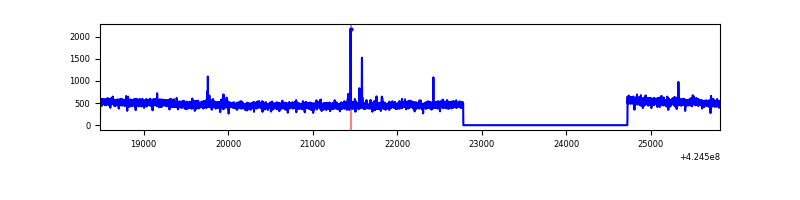 |
| C | 7334 | 5393 | 30 | 30 | 0.41% | 0.56% | 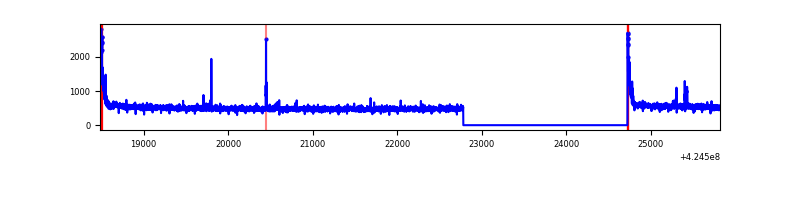 |
| D | 7334 | 5393 | 820 | 820 | 11.18% | 15.20% | 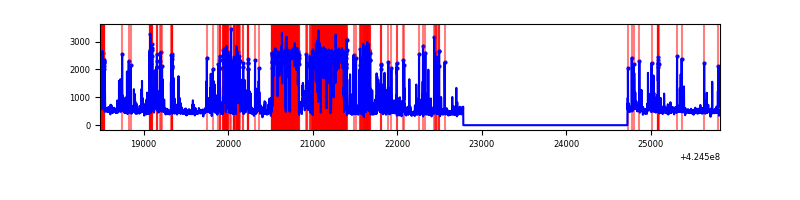 |
Top three noisy pixels from each quadrant. If the there are fewer than three noisy pixels in the level2.evt file, extra rows are filled as -1
| Pixel properties | Quadrant properties | ||||||
|---|---|---|---|---|---|---|---|
| Quadrant | DetID | PixID | Counts | Sigma | Mean | Median | Sigma |
| A | 10 | 83 | 531465 | 3959.36 | 657 | 645 | 134.1 |
| A | 2 | 79 | 17962 | 129.17 | 657 | 645 | 134.1 |
| A | 13 | 248 | 11131 | 78.21 | 657 | 645 | 134.1 |
| B | 12 | 111 | 15498 | 119.82 | 642 | 625 | 124.1 |
| B | 11 | 111 | 14527 | 112.0 | 642 | 625 | 124.1 |
| B | 14 | 111 | 13982 | 107.61 | 642 | 625 | 124.1 |
| C | 15 | 214 | 223991 | 1527.92 | 628 | 634 | 146.2 |
| C | 0 | 10 | 117728 | 801.01 | 628 | 634 | 146.2 |
| C | 15 | 111 | 23126 | 153.86 | 628 | 634 | 146.2 |
| D | 2 | 249 | 1858999 | 13105.23 | 583 | 568 | 141.8 |
| D | 13 | 249 | 474196 | 3339.92 | 583 | 568 | 141.8 |
| D | 2 | 120 | 202286 | 1422.47 | 583 | 568 | 141.8 |
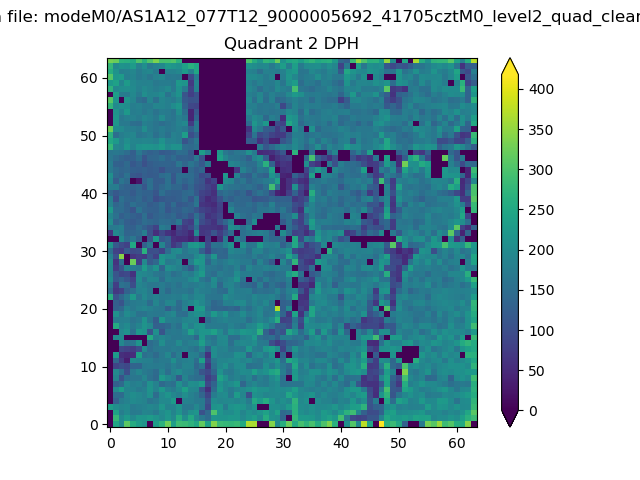
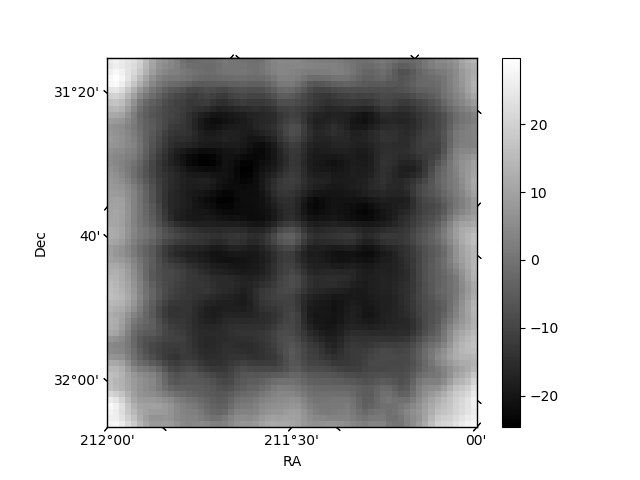
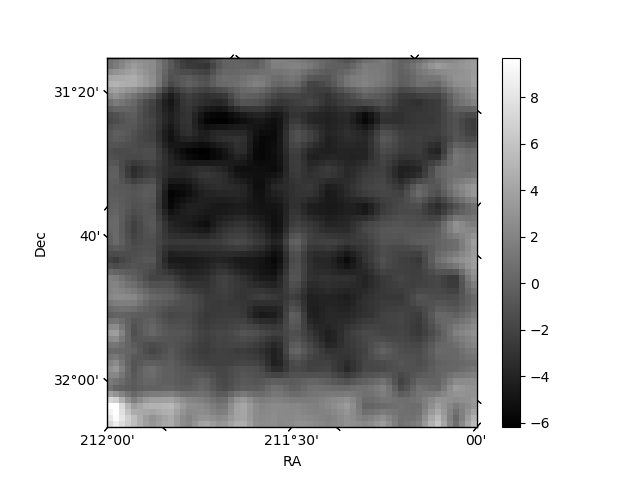
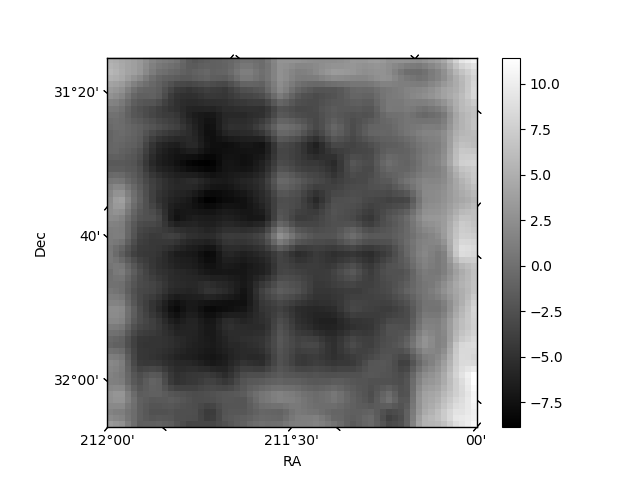
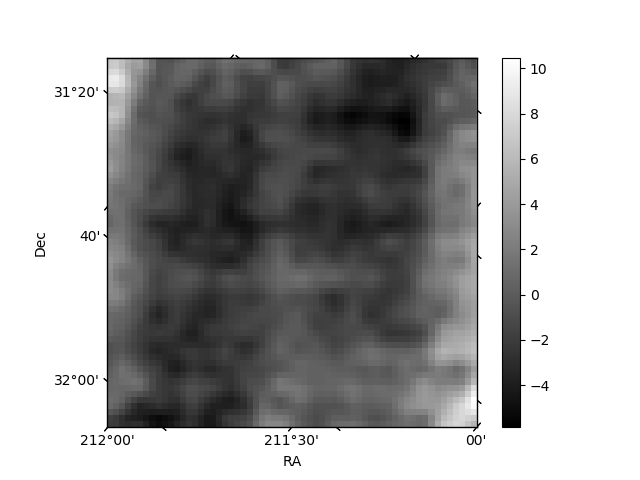
Histogram calculated using DETX and DETY for each event in the final _common_clean file
| Quadrant A | 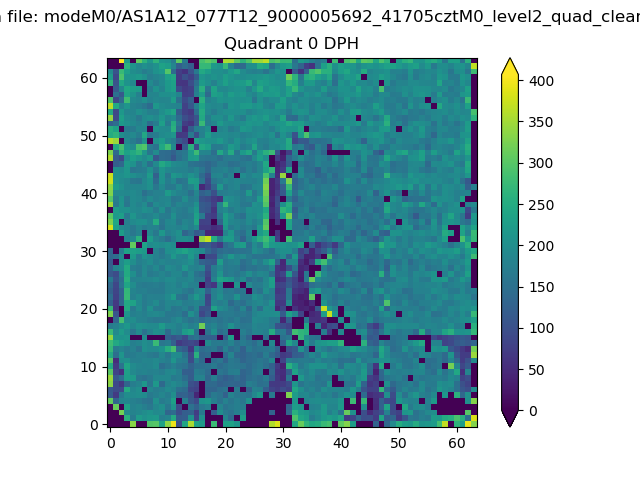 |
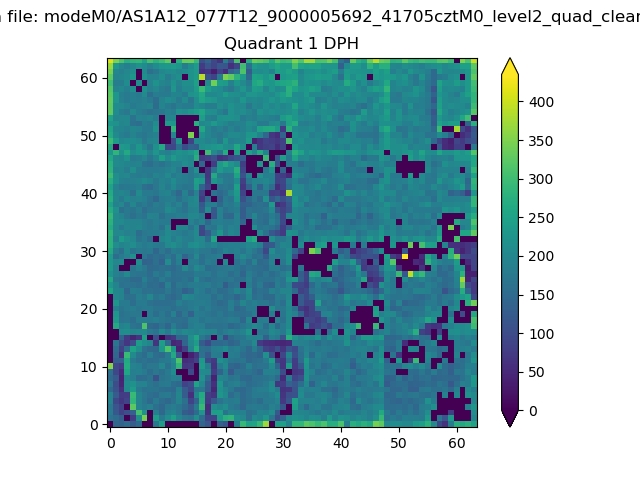 |
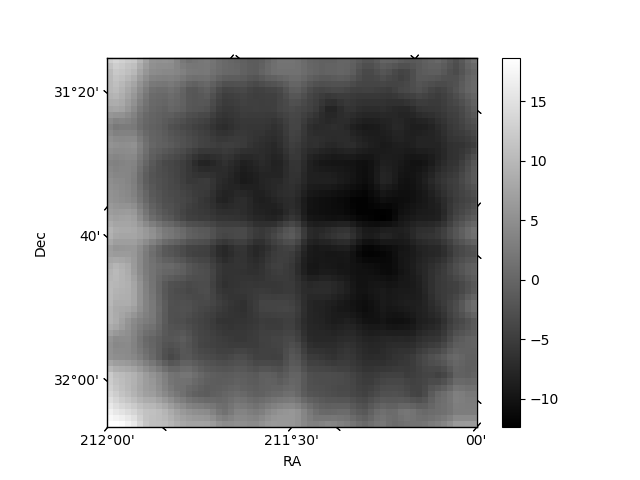
Quadrant B |
|---|---|---|---|
| Quadrant D | 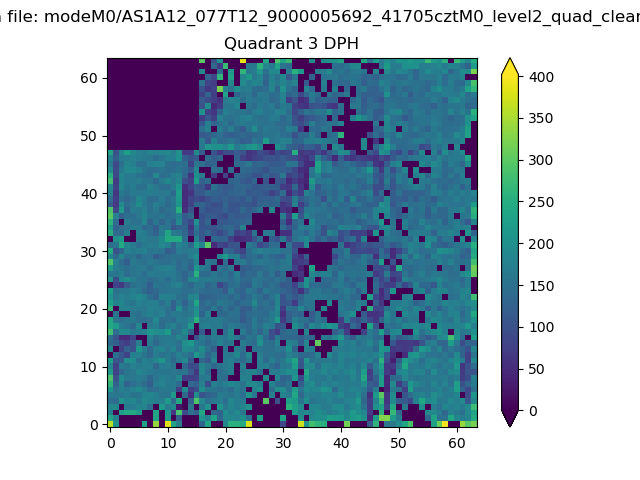 |
 |
Quadrant C |
| Plot type | Count rate plots | Images |
|---|---|---|
| Comparison with Poisson distribution Blue bars denote a histogram of data divided into 1 sec bins. Red curve is a Poisson curve with rate = median count rate of data. |
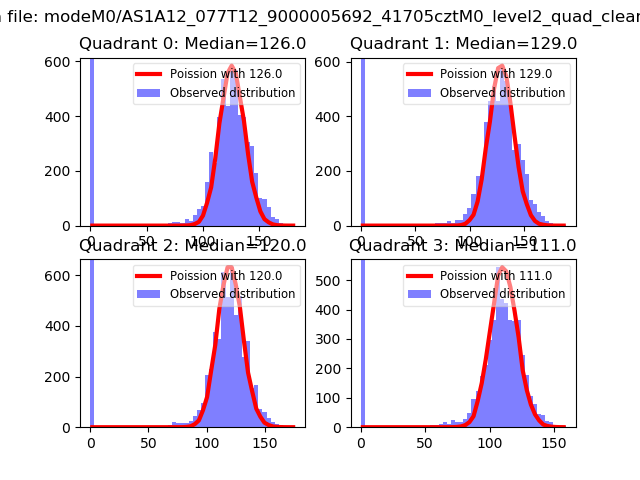 |
 |
| Quadrant-wise count rates Data is divided into 100 sec bins |
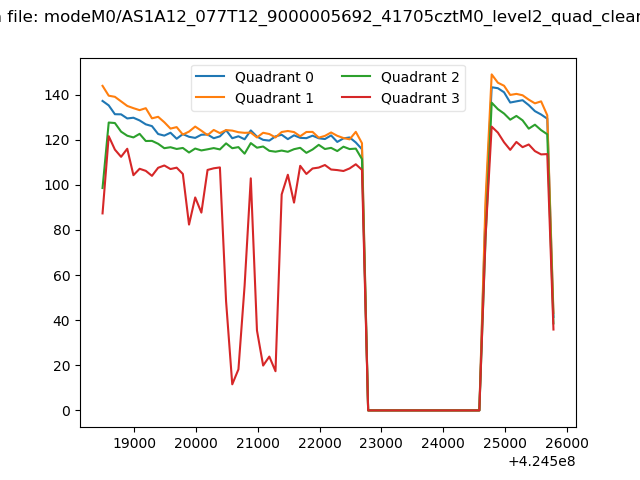 |
|
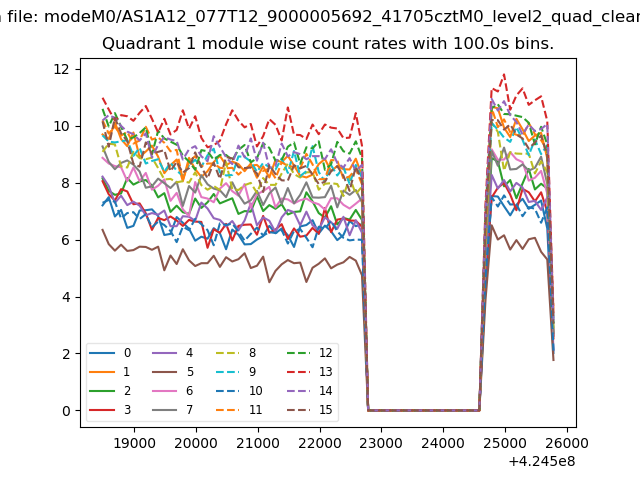
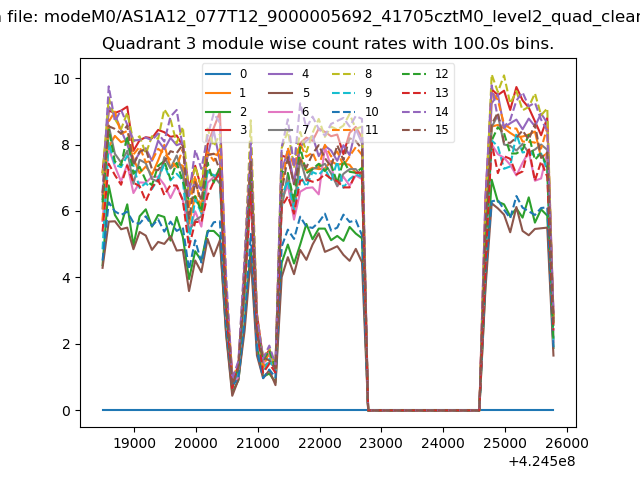
| Module-wise count rates for Quadrant A Data is divided into 100 sec bins |
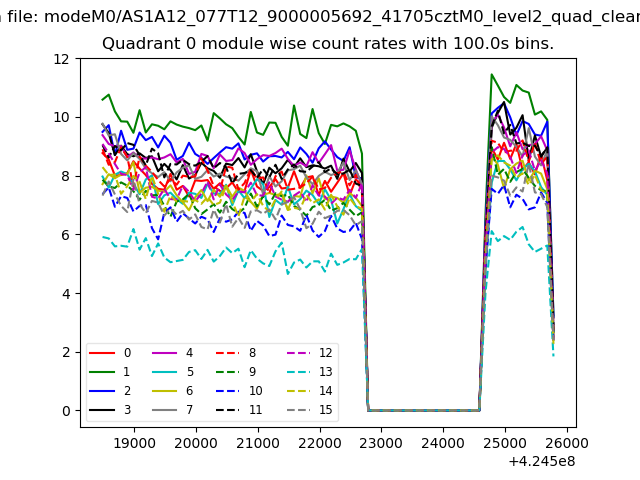 |
 |
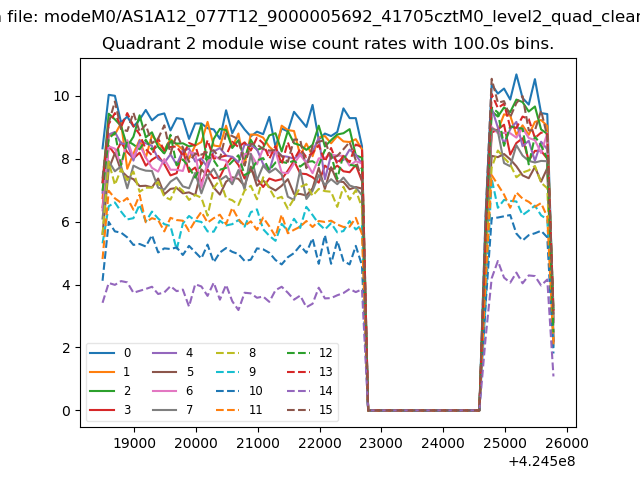
| Module-wise count rates for Quadrant B Data is divided into 100 sec bins |
 |
 |
| Module-wise count rates for Quadrant C Data is divided into 100 sec bins |
 |
 |
| Module-wise count rates for Quadrant D Data is divided into 100 sec bins |
 |
 |
| Parameter | Plot |
|---|---|
| CZT HV Monitor | 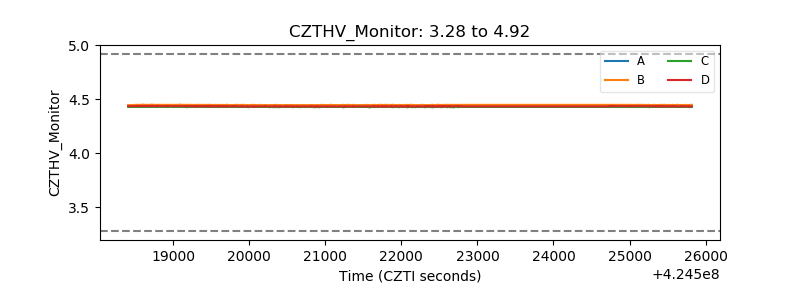 |
| D_VDD | 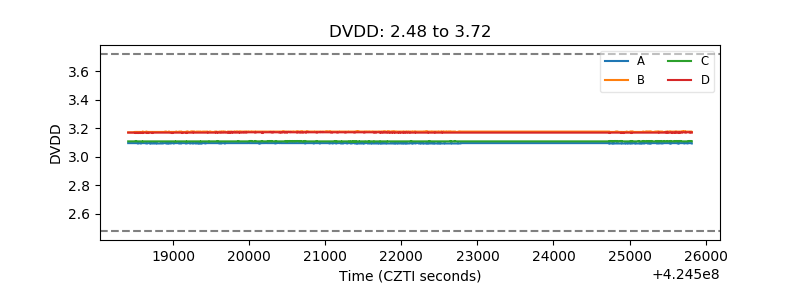 |
| Temperature 1 | 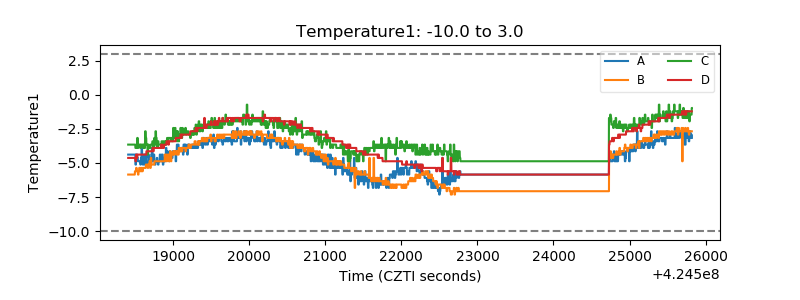 |
| Veto HV Monitor | 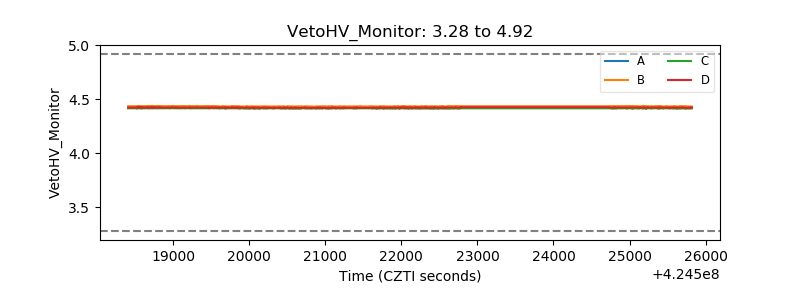 |
| Veto LLD | 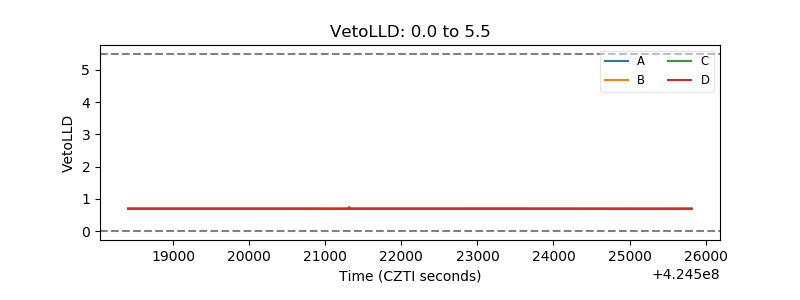 |
| Alpha Counter |  |
| _CPM_Rate | 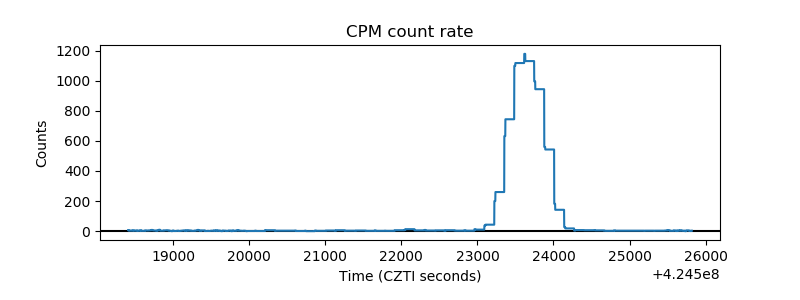 |
| CZT Counter | 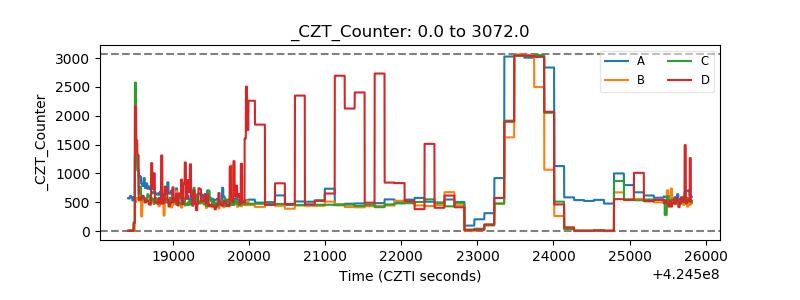 |
| +2.5 Volts monitor | 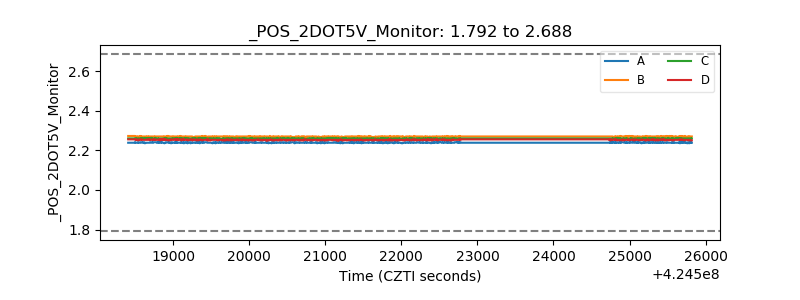 |
| +5 Volts monitor | 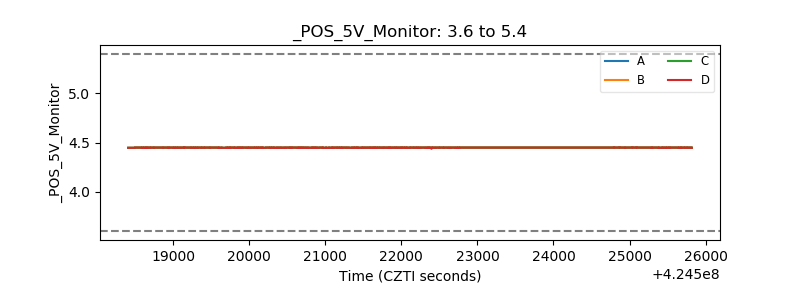 |
| _ROLL_ROT | 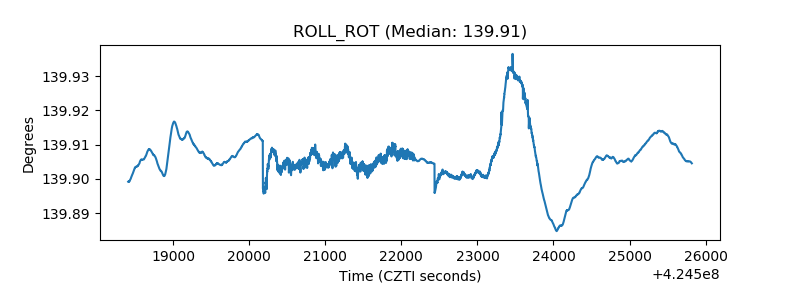 |
| _Roll_DEC | 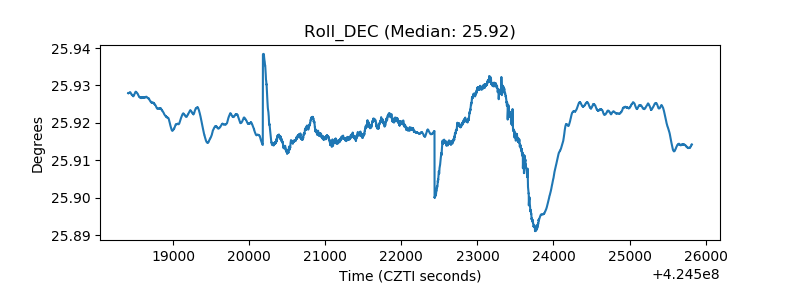 |
| _Roll_RA | 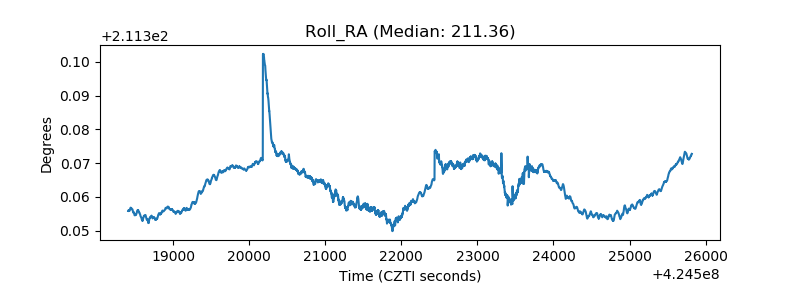 |
| Veto Counter | 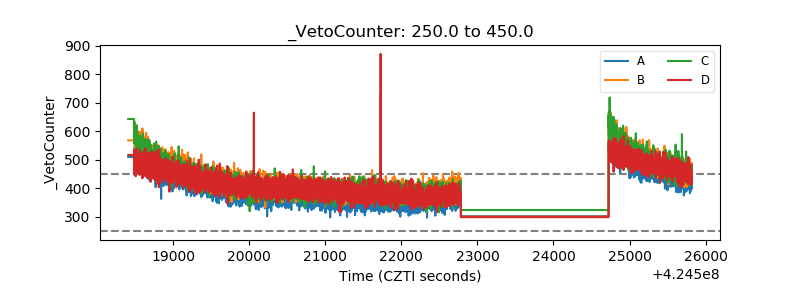 |