| Param | Original file | Final file |
|---|---|---|
| Filename | modeM0/AS1A12_077T12_9000005692_41706cztM0_level2.fits | modeM0/AS1A12_077T12_9000005692_41706cztM0_level2_quad_clean.evt |
| Size (bytes) | 341,110,080 | 97,197,120 |
| Size | 325.3 MB | 92.7 MB |
| Events in quadrant A | 3,039,989 | 675,993 |
| Events in quadrant B | 2,528,915 | 687,415 |
| Events in quadrant C | 2,807,171 | 636,170 |
| Events in quadrant D | 3,842,677 | 576,699 |
| Mode M9 | |||
|---|---|---|---|
| Quadrant | BADHDUFLAG | Total packets | Discarded packets |
| A | 0 | 35 | 0 |
| B | 0 | 36 | 0 |
| C | 0 | 36 | 0 |
| D | 0 | 36 | 0 |
| Mode M0 | |||
|---|---|---|---|
| Quadrant | BADHDUFLAG | Total packets | Discarded packets |
| A | 0 | 12224 | 2 |
| B | 0 | 10735 | 2 |
| C | 0 | 11331 | 2 |
| D | 0 | 14816 | 2 |
| Mode SS | |||
|---|---|---|---|
| Quadrant | BADHDUFLAG | Total packets | Discarded packets |
| A | 0 | 108 | 0 |
| B | 0 | 108 | 0 |
| C | 0 | 108 | 0 |
| D | 0 | 108 | 0 |
| Quadrant | Total seconds | Saturated seconds | Saturation percentage |
|---|---|---|---|
| A | 5240 | 14 | 0.267176% |
| B | 5240 | 6 | 0.114504% |
| C | 5240 | 65 | 1.240458% |
| D | 5240 | 262 | 5.000000% |
Noise dominated data is calculated using 1-second bins in cleaned event files. If a bin has >2000 counts, and if more than 50% of those come from <1% of pixels, then it is considered to be noise-dominated and hence unusable.
| Quadrant | # 1 sec bins | Bins with >0 counts | Bins with >2000 counts | High rate bins dominated by noise | Noise dominated (total time) | Noise dominated (detector-on time) | Marked lightcurve |
|---|---|---|---|---|---|---|---|
| A | 7303 | 5241 | 3 | 3 | 0.04% | 0.06% | 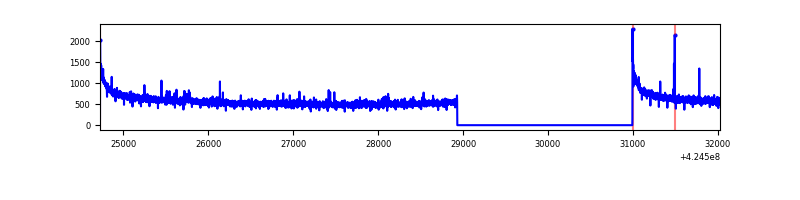 |
| B | 7303 | 5241 | 1 | 1 | 0.01% | 0.02% | 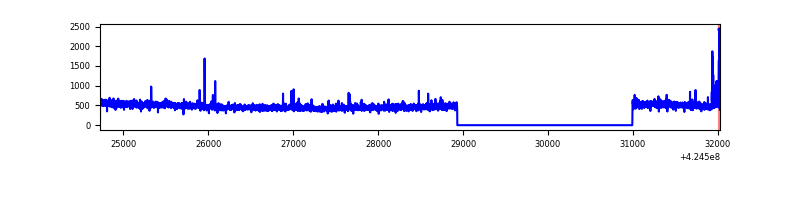 |
| C | 7303 | 5241 | 54 | 54 | 0.74% | 1.03% | 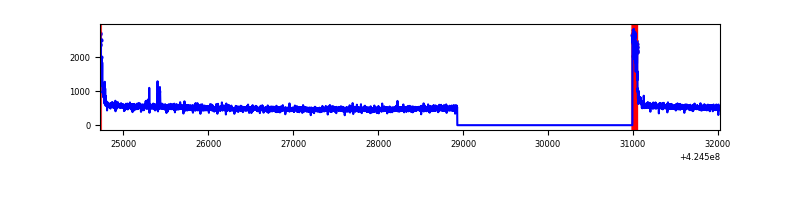 |
| D | 7303 | 5241 | 275 | 275 | 3.77% | 5.25% | 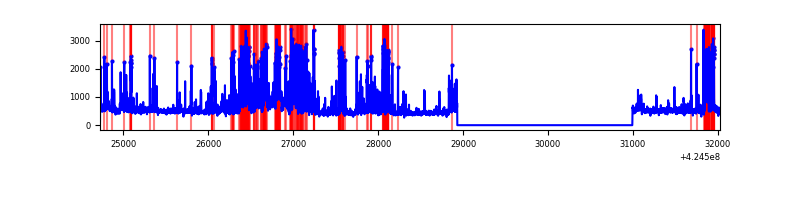 |
Top three noisy pixels from each quadrant. If the there are fewer than three noisy pixels in the level2.evt file, extra rows are filled as -1
| Pixel properties | Quadrant properties | ||||||
|---|---|---|---|---|---|---|---|
| Quadrant | DetID | PixID | Counts | Sigma | Mean | Median | Sigma |
| A | 10 | 83 | 525225 | 4022.98 | 642 | 631 | 130.4 |
| A | 2 | 79 | 32470 | 244.17 | 642 | 631 | 130.4 |
| A | 13 | 254 | 6927 | 48.28 | 642 | 631 | 130.4 |
| B | 5 | 255 | 38555 | 318.39 | 626 | 610 | 119.2 |
| B | 15 | 35 | 15528 | 125.17 | 626 | 610 | 119.2 |
| B | 12 | 111 | 14837 | 119.38 | 626 | 610 | 119.2 |
| C | 15 | 214 | 215379 | 1500.65 | 614 | 619 | 143.1 |
| C | 0 | 10 | 177230 | 1234.08 | 614 | 619 | 143.1 |
| C | 15 | 111 | 15701 | 105.39 | 614 | 619 | 143.1 |
| D | 2 | 249 | 1079079 | 7274.05 | 611 | 594 | 148.3 |
| D | 13 | 249 | 353719 | 2381.72 | 611 | 594 | 148.3 |
| D | 2 | 234 | 23274 | 152.97 | 611 | 594 | 148.3 |
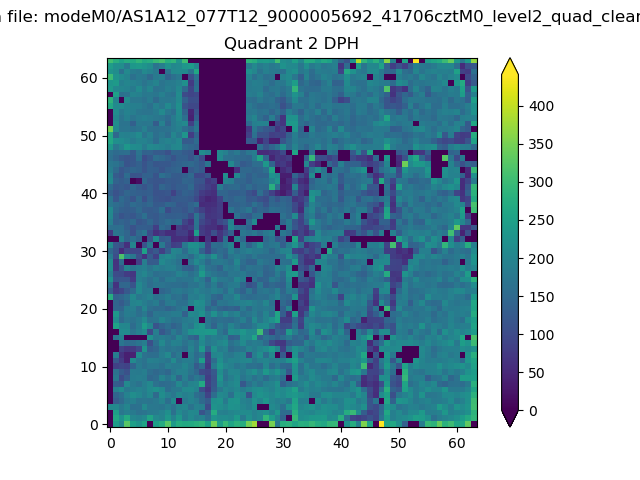
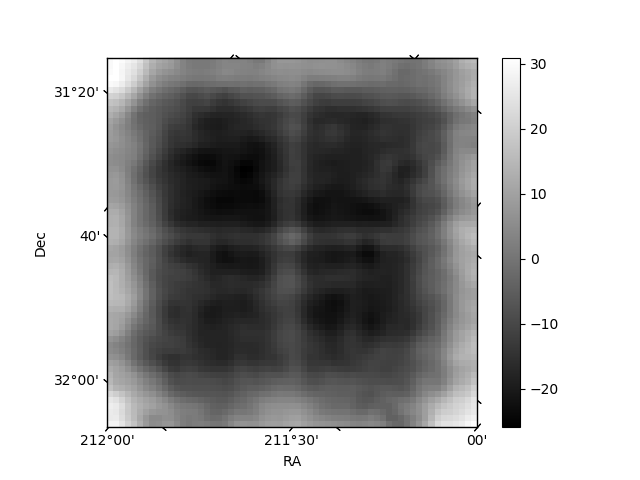
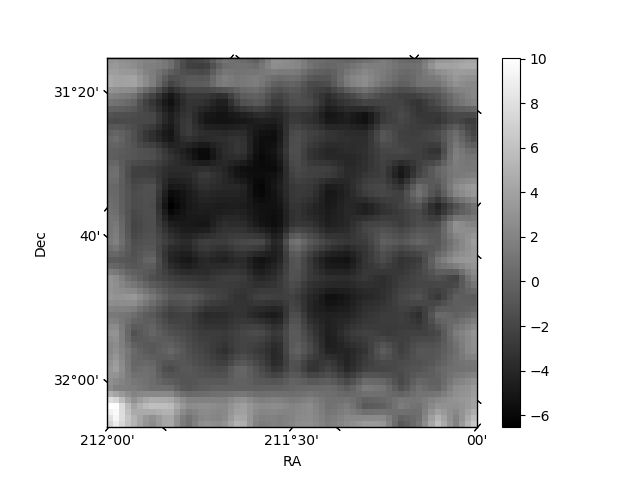
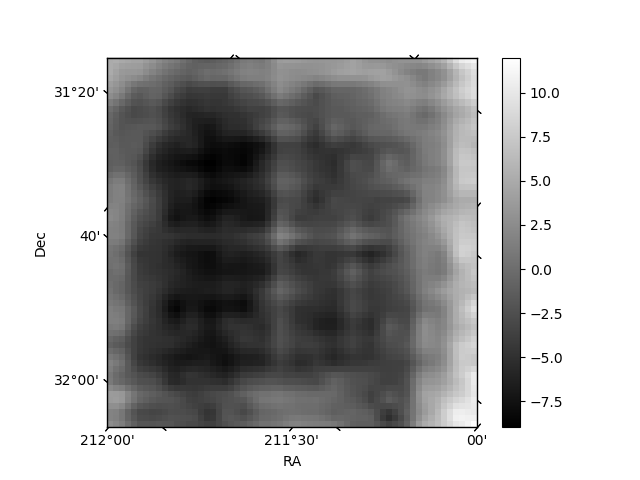
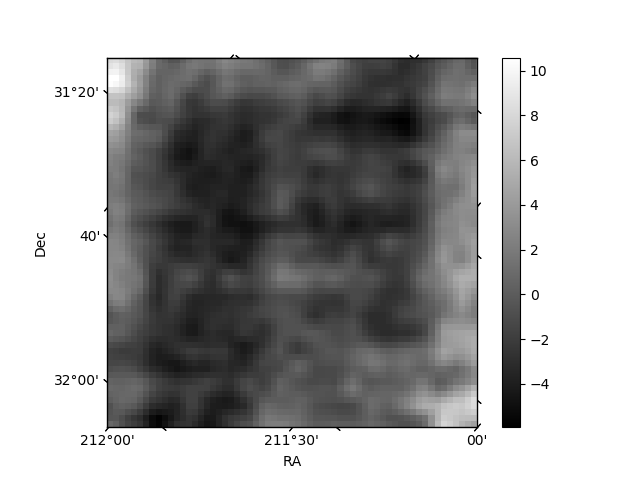
Histogram calculated using DETX and DETY for each event in the final _common_clean file
| Quadrant A | 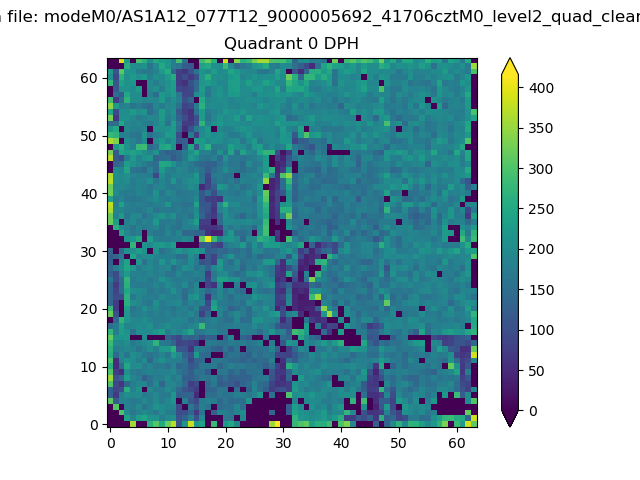 |
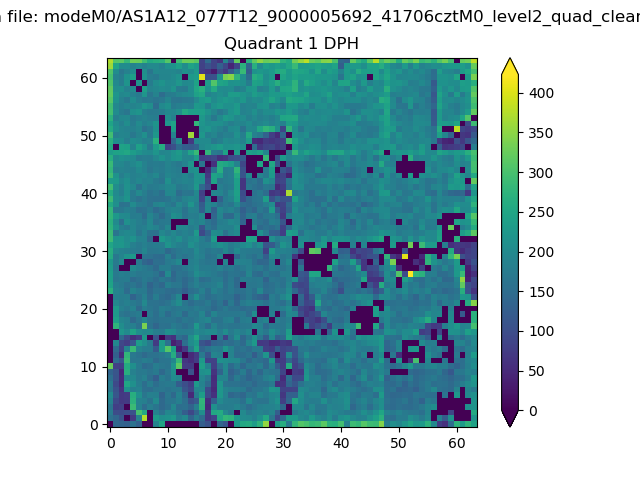 |
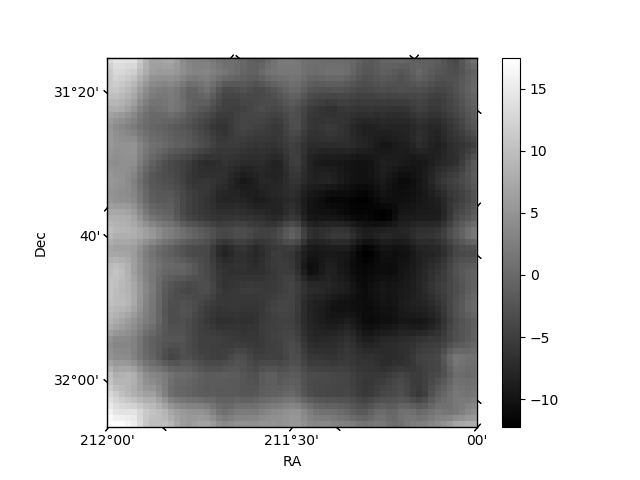
Quadrant B |
|---|---|---|---|
| Quadrant D | 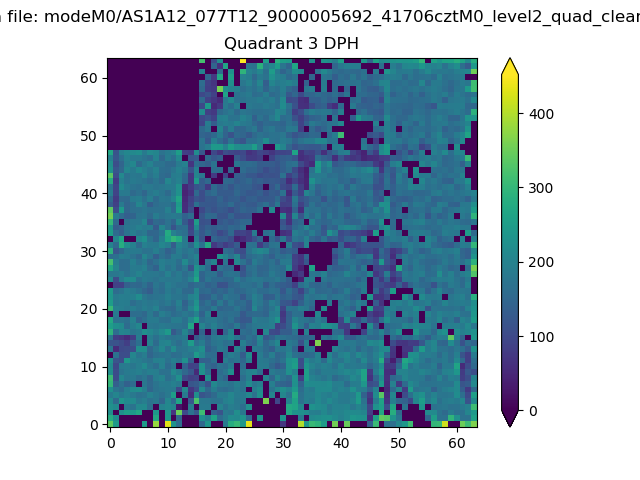 |
 |
Quadrant C |
| Plot type | Count rate plots | Images |
|---|---|---|
| Comparison with Poisson distribution Blue bars denote a histogram of data divided into 1 sec bins. Red curve is a Poisson curve with rate = median count rate of data. |
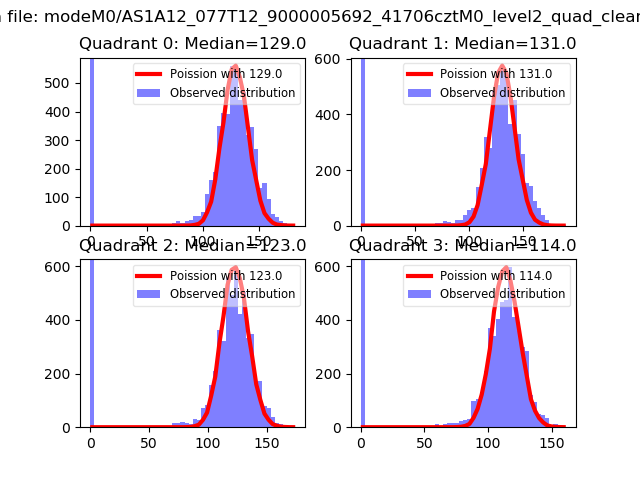 |
 |
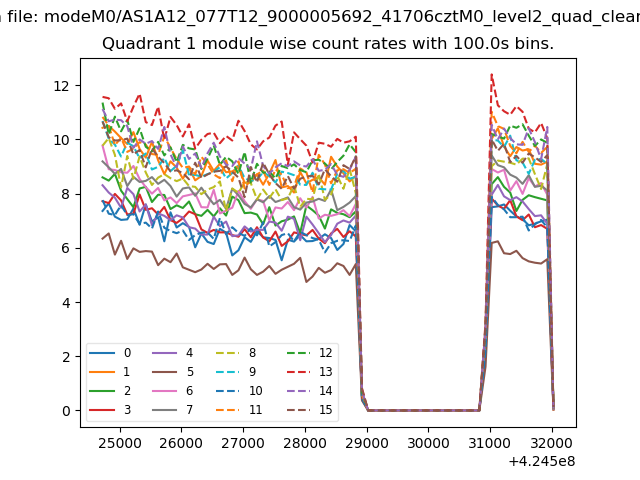
| Quadrant-wise count rates Data is divided into 100 sec bins |
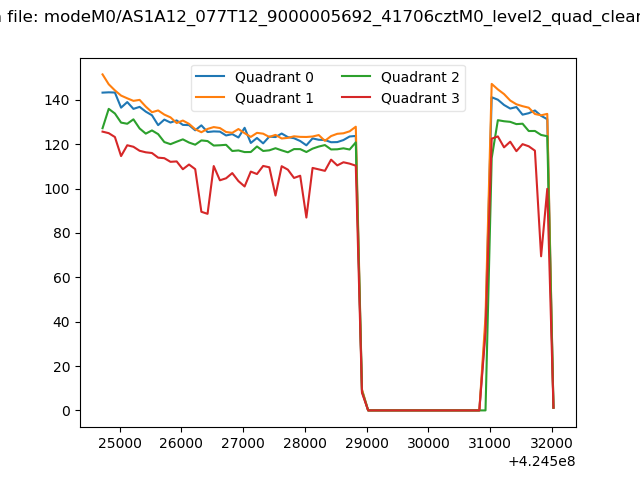 |
|
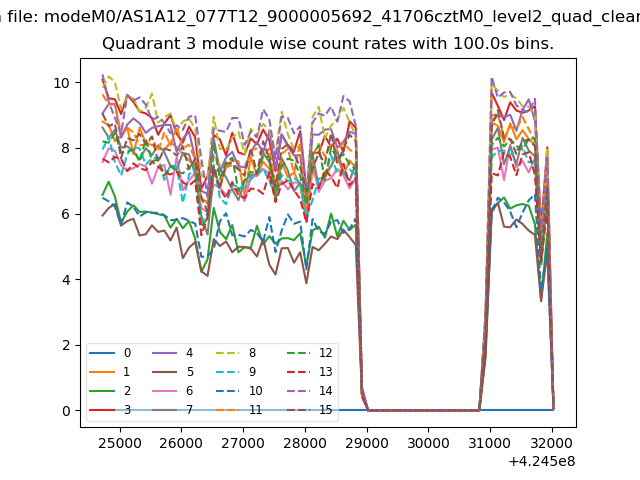
| Module-wise count rates for Quadrant A Data is divided into 100 sec bins |
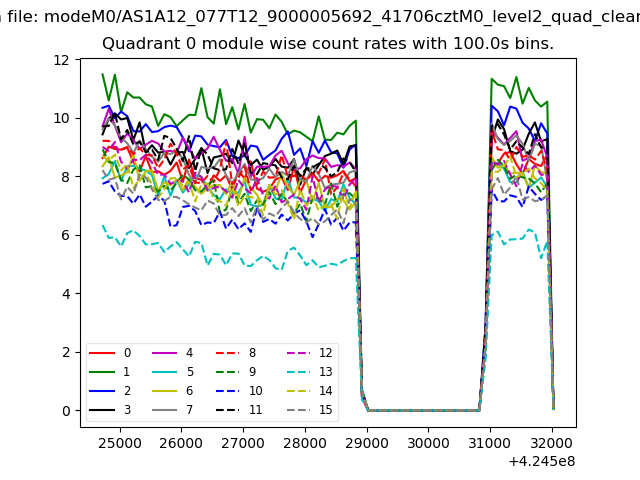 |
 |
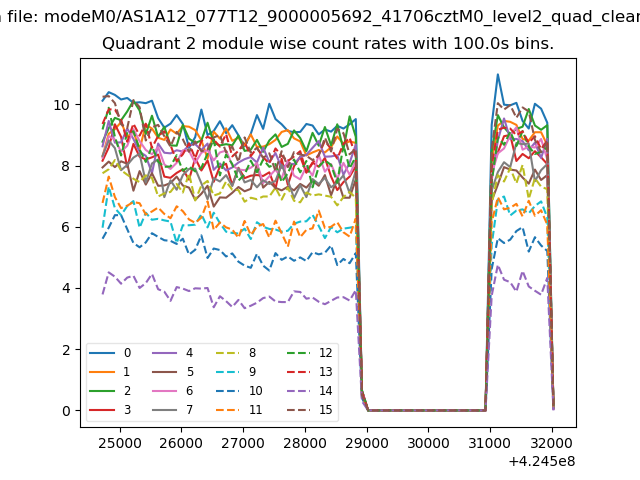
| Module-wise count rates for Quadrant B Data is divided into 100 sec bins |
 |
 |
| Module-wise count rates for Quadrant C Data is divided into 100 sec bins |
 |
 |
| Module-wise count rates for Quadrant D Data is divided into 100 sec bins |
 |
 |
| Parameter | Plot |
|---|---|
| CZT HV Monitor | 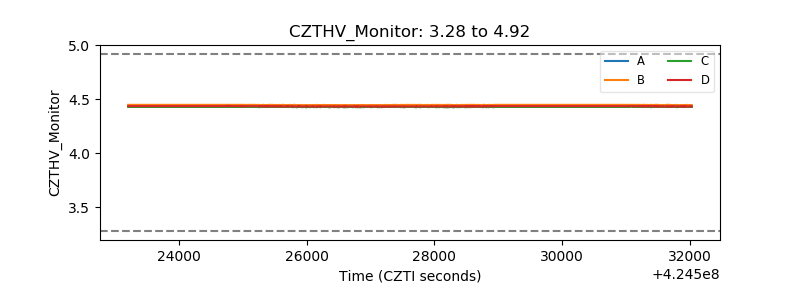 |
| D_VDD | 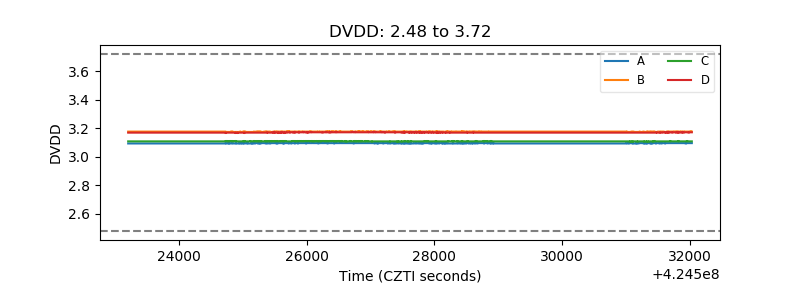 |
| Temperature 1 | 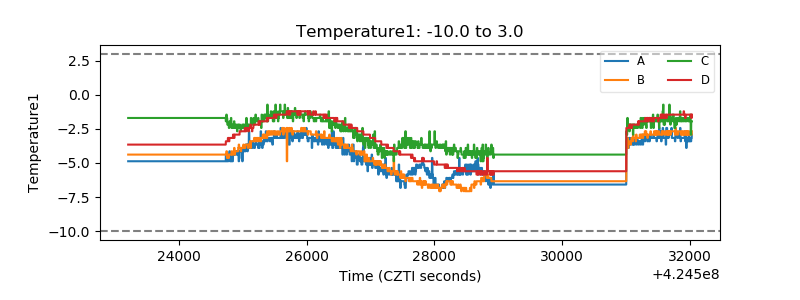 |
| Veto HV Monitor | 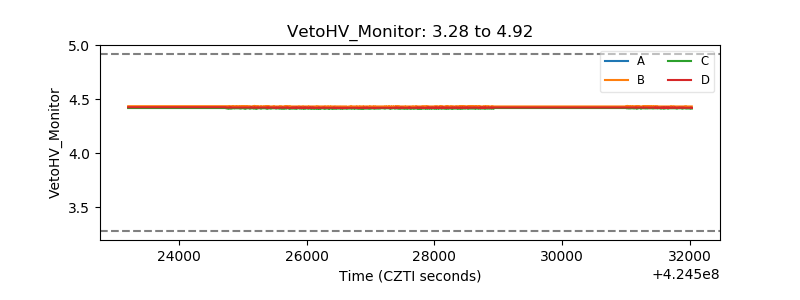 |
| Veto LLD | 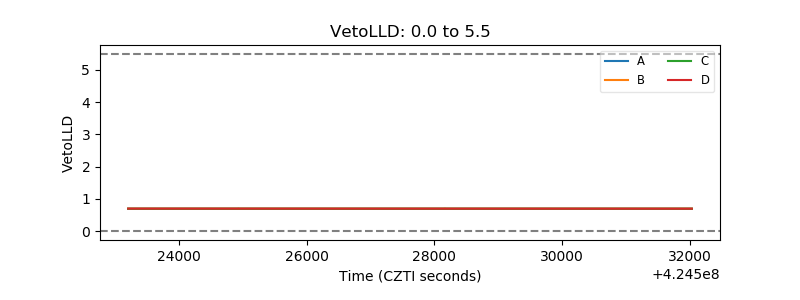 |
| Alpha Counter | 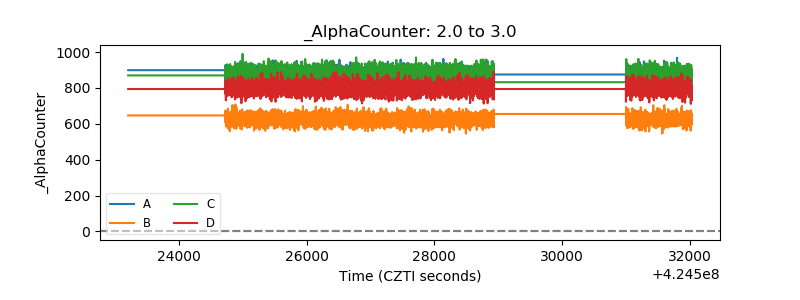 |
| _CPM_Rate | 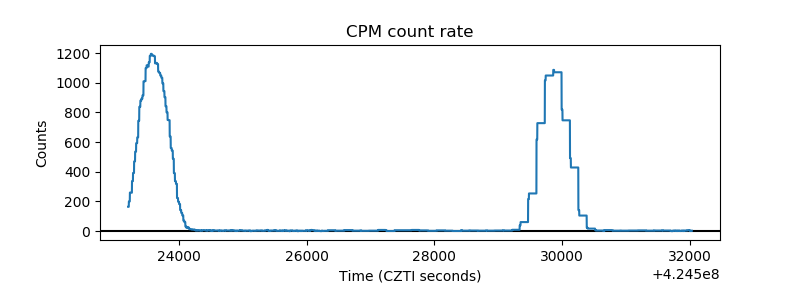 |
| CZT Counter | 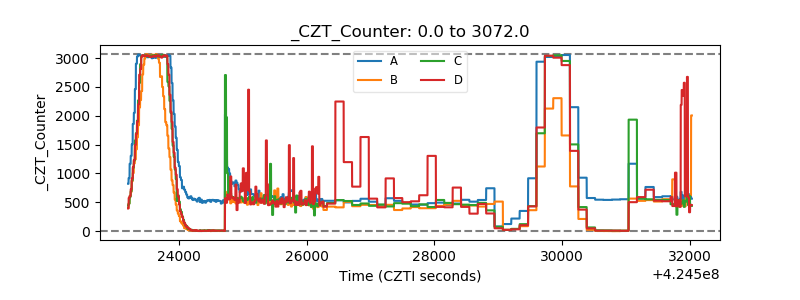 |
| +2.5 Volts monitor | 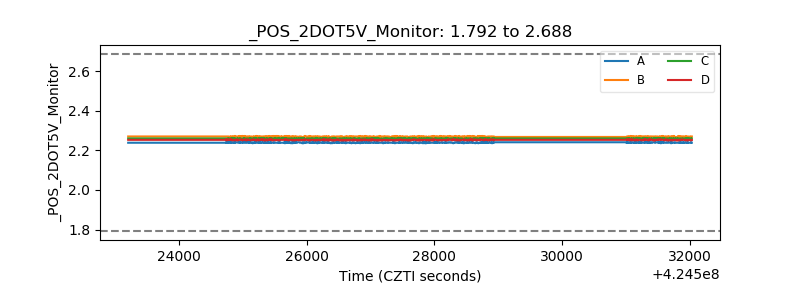 |
| +5 Volts monitor | 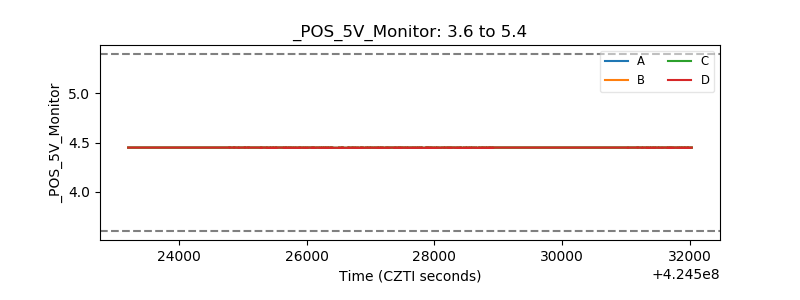 |
| _ROLL_ROT | 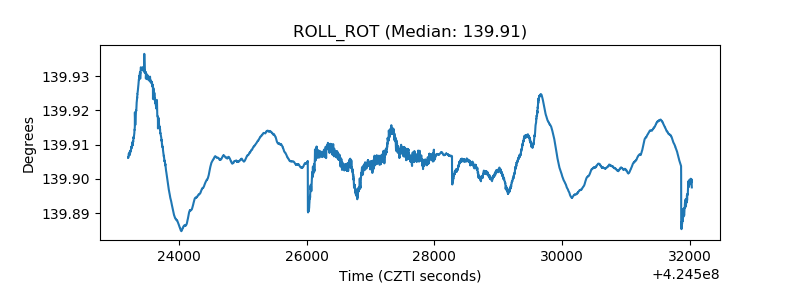 |
| _Roll_DEC | 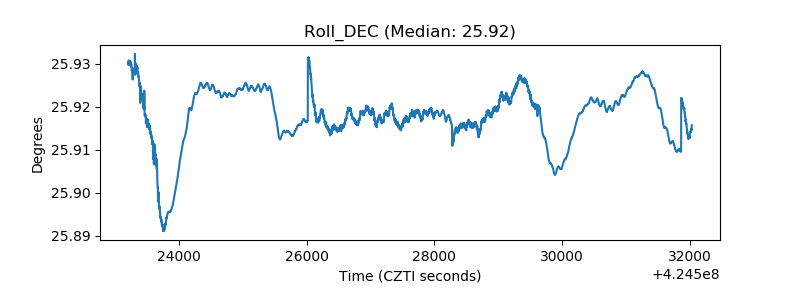 |
| _Roll_RA | 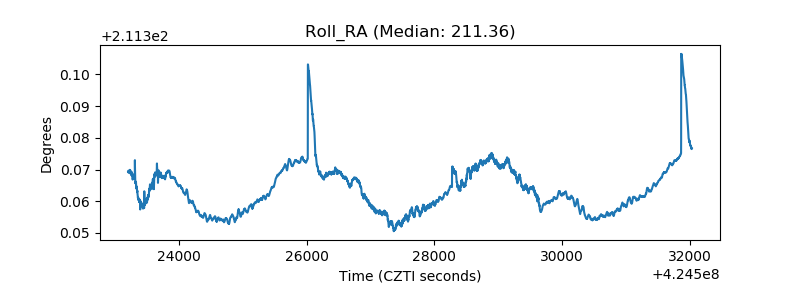 |
| Veto Counter | 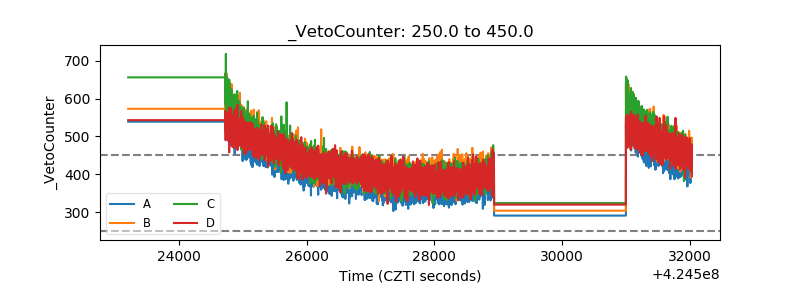 |