| Param | Original file | Final file |
|---|---|---|
| Filename | modeM0/AS1A12_077T12_9000005692_41707cztM0_level2.fits | modeM0/AS1A12_077T12_9000005692_41707cztM0_level2_quad_clean.evt |
| Size (bytes) | 320,241,600 | 91,699,200 |
| Size | 305.4 MB | 87.5 MB |
| Events in quadrant A | 2,862,071 | 633,829 |
| Events in quadrant B | 2,378,836 | 643,373 |
| Events in quadrant C | 2,776,122 | 595,995 |
| Events in quadrant D | 3,444,521 | 550,201 |
| Mode M9 | |||
|---|---|---|---|
| Quadrant | BADHDUFLAG | Total packets | Discarded packets |
| A | 0 | 21 | 0 |
| B | 0 | 22 | 0 |
| C | 0 | 22 | 0 |
| D | 0 | 22 | 0 |
| Mode M0 | |||
|---|---|---|---|
| Quadrant | BADHDUFLAG | Total packets | Discarded packets |
| A | 0 | 11582 | 2 |
| B | 0 | 10287 | 2 |
| C | 0 | 11179 | 2 |
| D | 0 | 13572 | 2 |
| Mode SS | |||
|---|---|---|---|
| Quadrant | BADHDUFLAG | Total packets | Discarded packets |
| A | 0 | 104 | 0 |
| B | 0 | 104 | 0 |
| C | 0 | 104 | 0 |
| D | 0 | 104 | 0 |
| Quadrant | Total seconds | Saturated seconds | Saturation percentage |
|---|---|---|---|
| A | 5039 | 15 | 0.297678% |
| B | 5039 | 9 | 0.178607% |
| C | 5039 | 118 | 2.341734% |
| D | 5039 | 220 | 4.365946% |
Noise dominated data is calculated using 1-second bins in cleaned event files. If a bin has >2000 counts, and if more than 50% of those come from <1% of pixels, then it is considered to be noise-dominated and hence unusable.
| Quadrant | # 1 sec bins | Bins with >0 counts | Bins with >2000 counts | High rate bins dominated by noise | Noise dominated (total time) | Noise dominated (detector-on time) | Marked lightcurve |
|---|---|---|---|---|---|---|---|
| A | 7162 | 5040 | 3 | 3 | 0.04% | 0.06% | 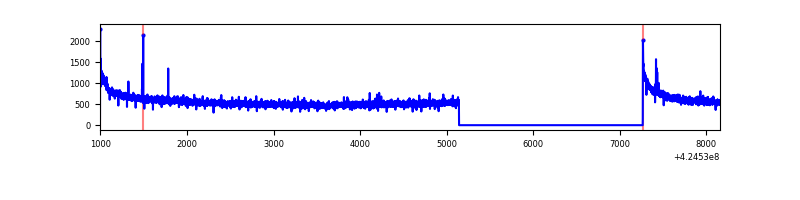 |
| B | 7162 | 5040 | 1 | 1 | 0.01% | 0.02% | 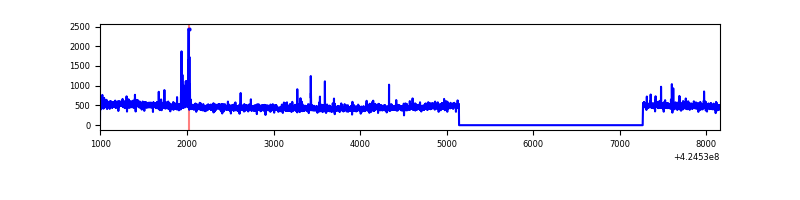 |
| C | 7162 | 5040 | 113 | 113 | 1.58% | 2.24% | 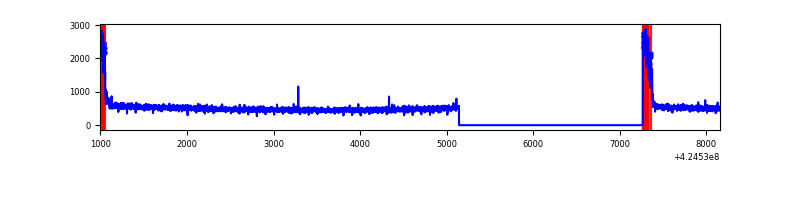 |
| D | 7162 | 5040 | 214 | 214 | 2.99% | 4.25% | 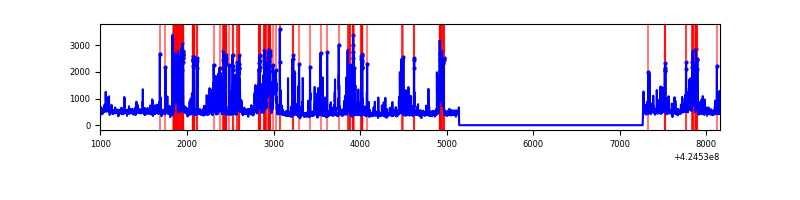 |
Top three noisy pixels from each quadrant. If the there are fewer than three noisy pixels in the level2.evt file, extra rows are filled as -1
| Pixel properties | Quadrant properties | ||||||
|---|---|---|---|---|---|---|---|
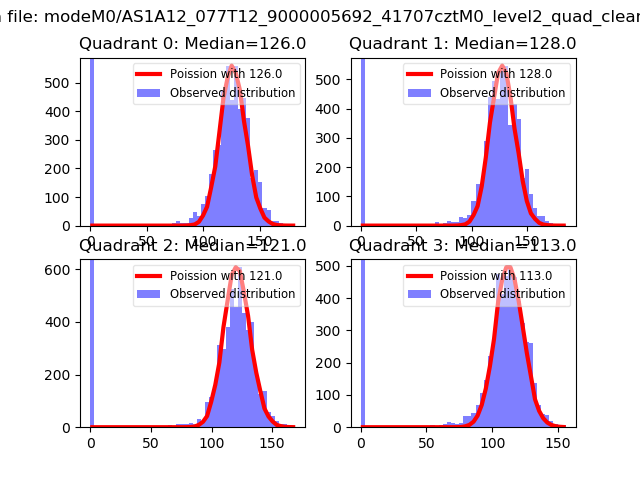
| Quadrant | DetID | PixID | Counts | Sigma | Mean | Median | Sigma |
| A | 10 | 83 | 519448 | 4216.27 | 599 | 587 | 123.1 |
| A | 2 | 79 | 16512 | 129.41 | 599 | 587 | 123.1 |
| A | 13 | 248 | 7887 | 59.32 | 599 | 587 | 123.1 |
| B | 5 | 255 | 37277 | 324.05 | 586 | 569 | 113.3 |
| B | 0 | 190 | 20858 | 179.1 | 586 | 569 | 113.3 |
| B | 12 | 111 | 14040 | 118.92 | 586 | 569 | 113.3 |
| C | 0 | 10 | 331834 | 2482.83 | 573 | 578 | 133.4 |
| C | 15 | 214 | 206602 | 1544.19 | 573 | 578 | 133.4 |
| C | 13 | 61 | 3741 | 23.71 | 573 | 578 | 133.4 |
| D | 2 | 249 | 677825 | 4845.77 | 575 | 562 | 139.8 |
| D | 13 | 249 | 513659 | 3671.17 | 575 | 562 | 139.8 |
| D | 2 | 234 | 25222 | 176.44 | 575 | 562 | 139.8 |
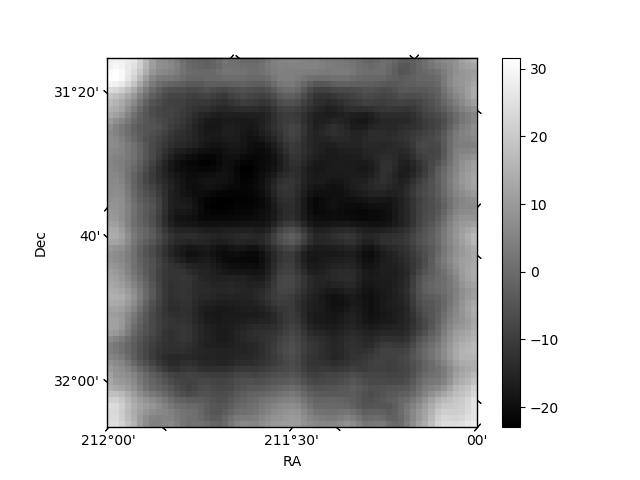
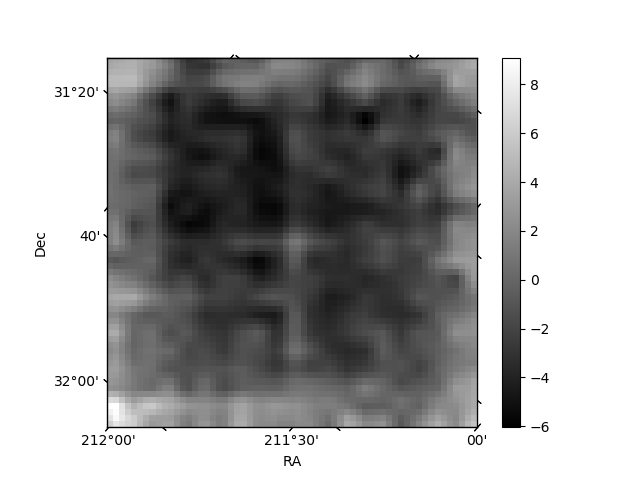
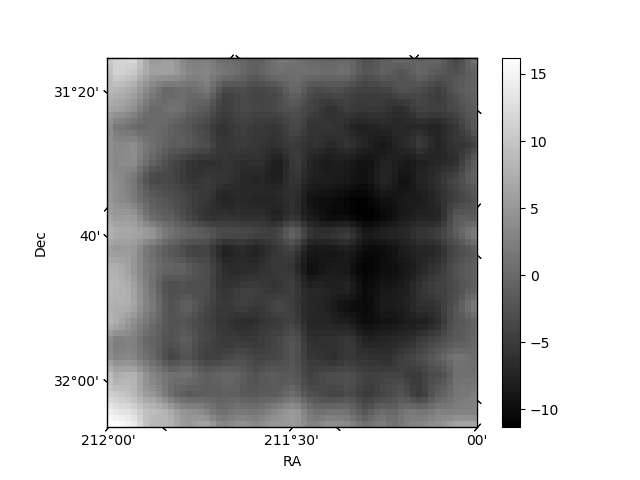
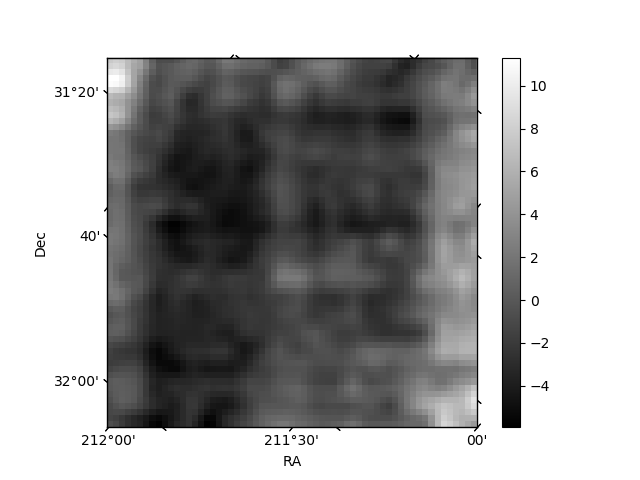
Histogram calculated using DETX and DETY for each event in the final _common_clean file
| Quadrant A | 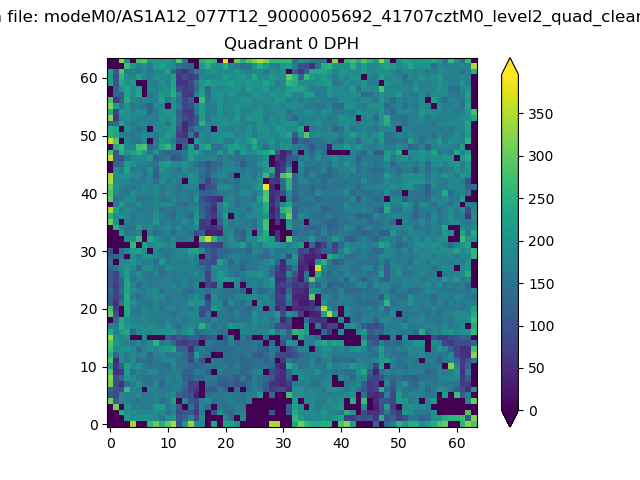 |
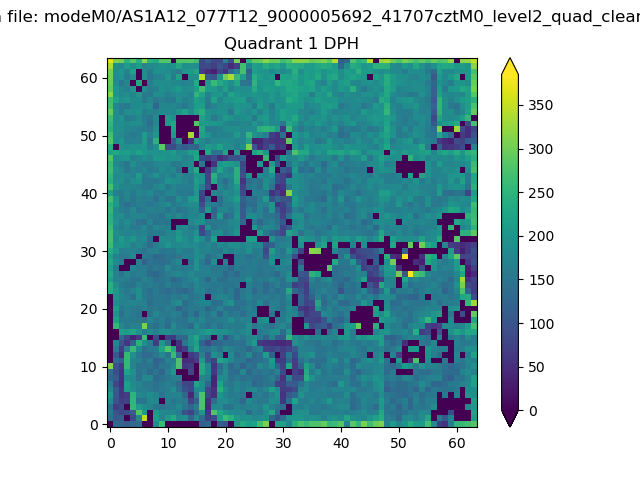 |
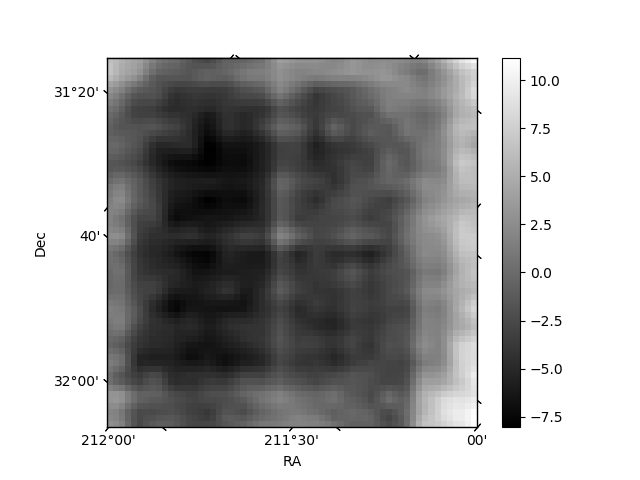
Quadrant B |
|---|---|---|---|
| Quadrant D | 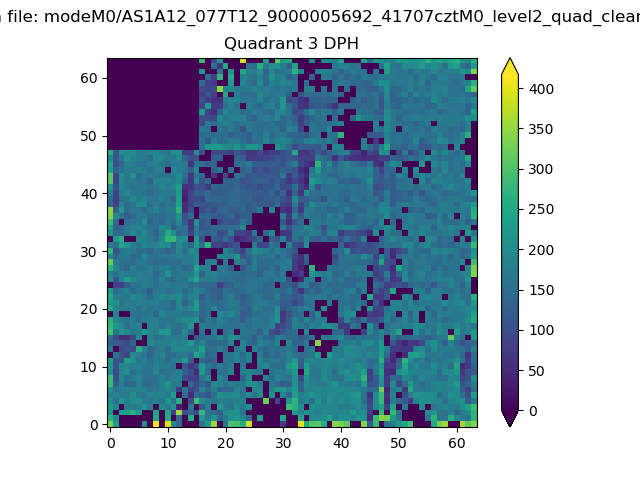 |
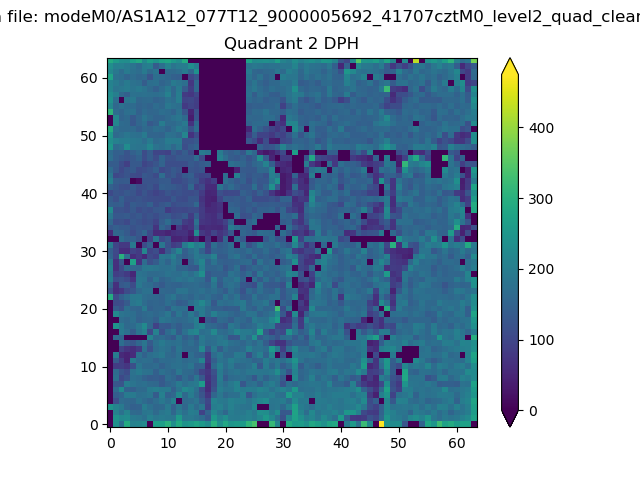 |
Quadrant C |
| Plot type | Count rate plots | Images |
|---|---|---|
| Comparison with Poisson distribution Blue bars denote a histogram of data divided into 1 sec bins. Red curve is a Poisson curve with rate = median count rate of data. |
 |
 |
| Quadrant-wise count rates Data is divided into 100 sec bins |
 |
|
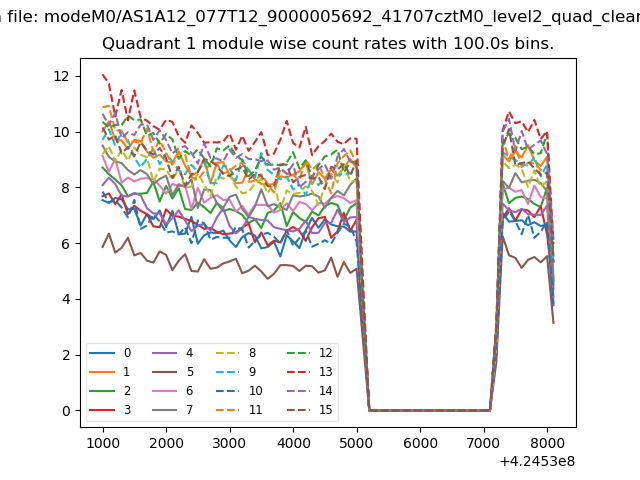
| Module-wise count rates for Quadrant A Data is divided into 100 sec bins |
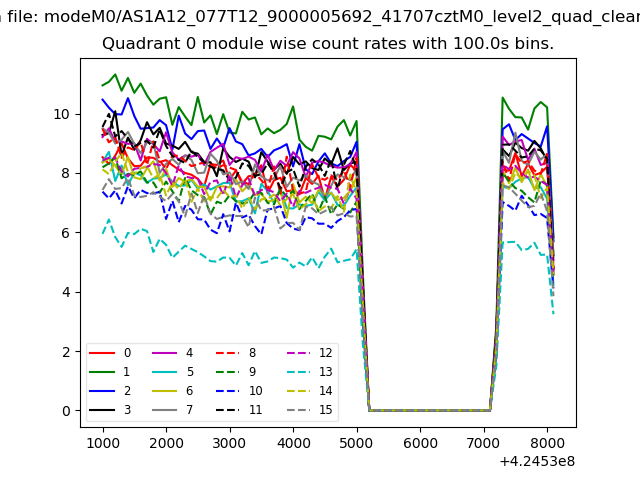 |
 |
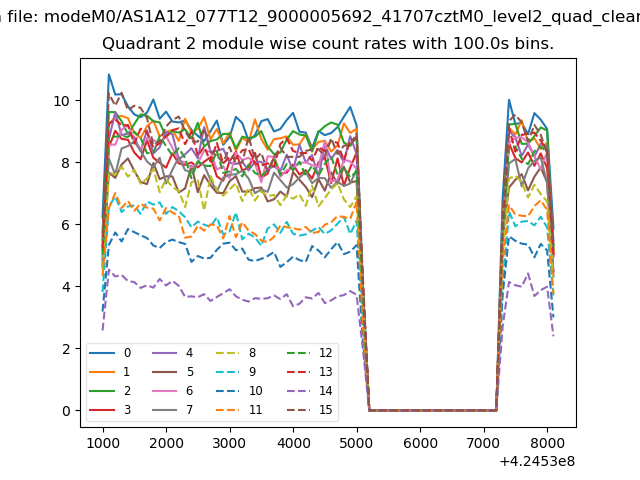
| Module-wise count rates for Quadrant B Data is divided into 100 sec bins |
 |
 |
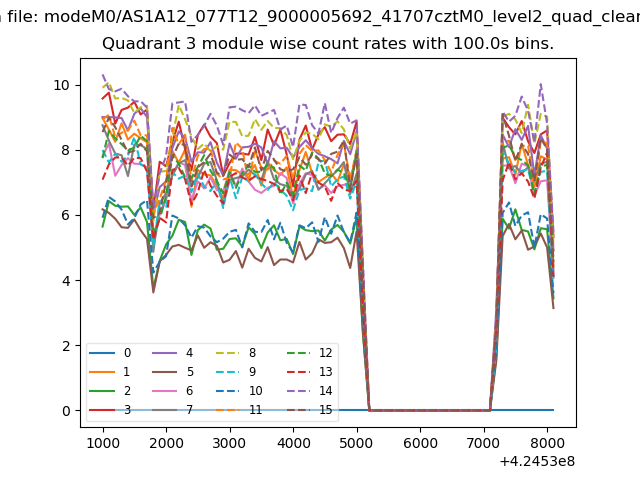
| Module-wise count rates for Quadrant C Data is divided into 100 sec bins |
 |
 |
| Module-wise count rates for Quadrant D Data is divided into 100 sec bins |
 |
 |
| Parameter | Plot |
|---|---|
| CZT HV Monitor | 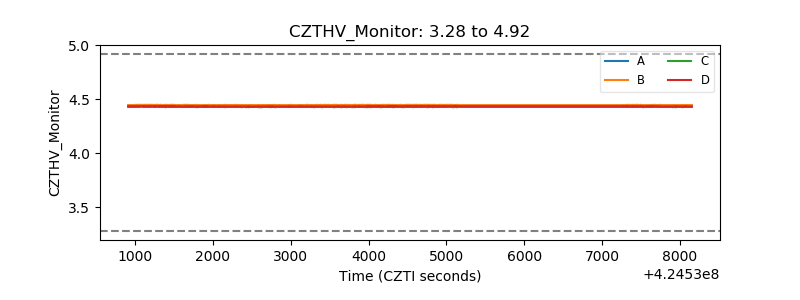 |
| D_VDD | 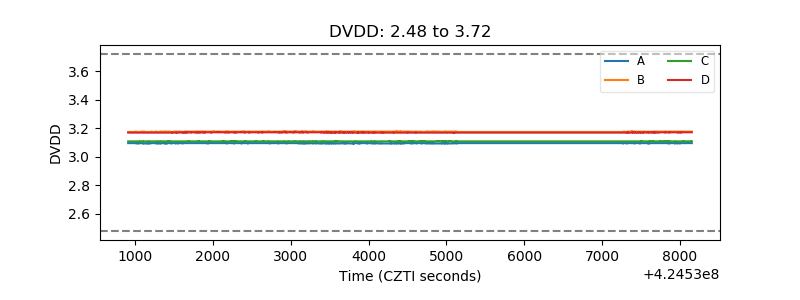 |
| Temperature 1 | 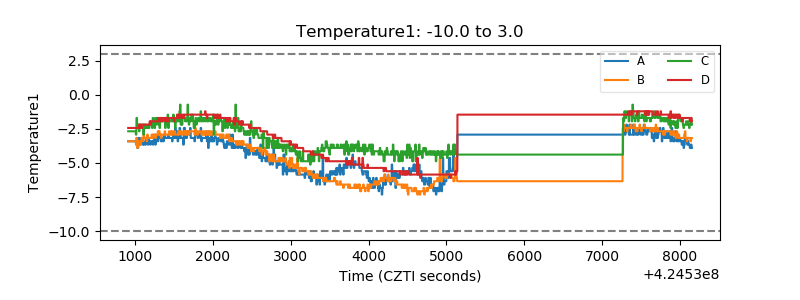 |
| Veto HV Monitor | 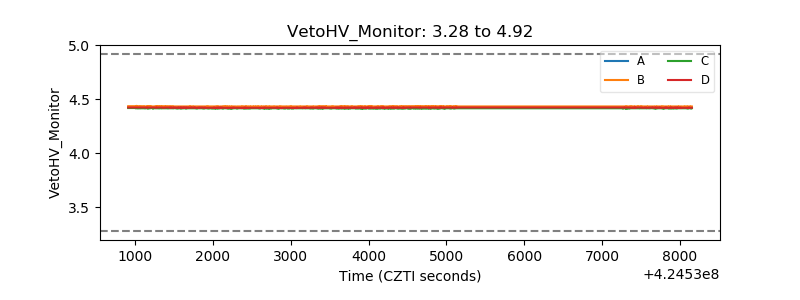 |
| Veto LLD | 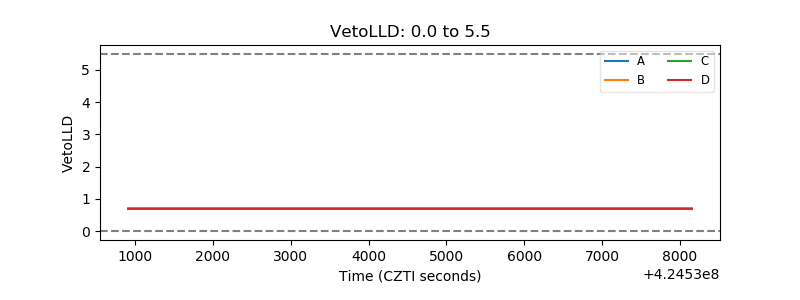 |
| Alpha Counter | 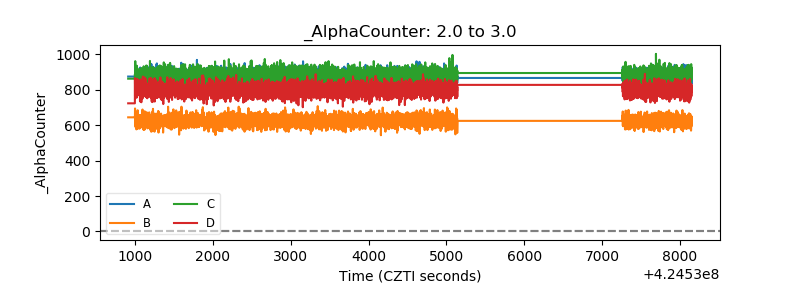 |
| _CPM_Rate | 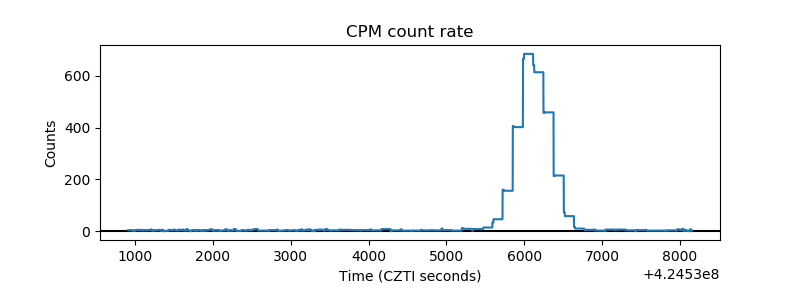 |
| CZT Counter | 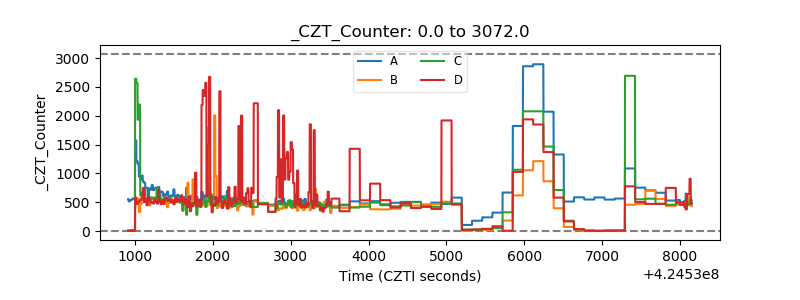 |
| +2.5 Volts monitor | 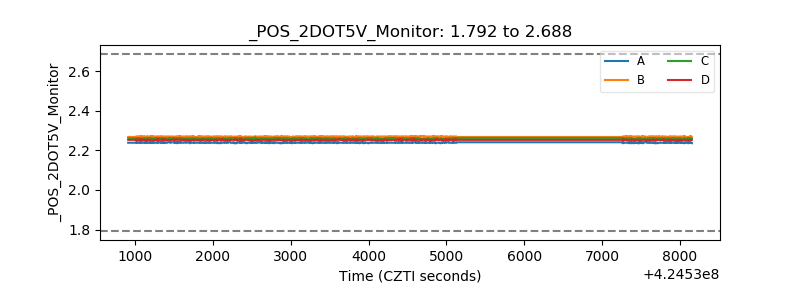 |
| +5 Volts monitor | 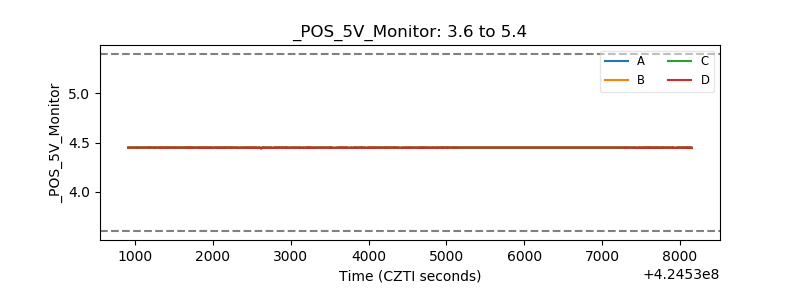 |
| _ROLL_ROT | 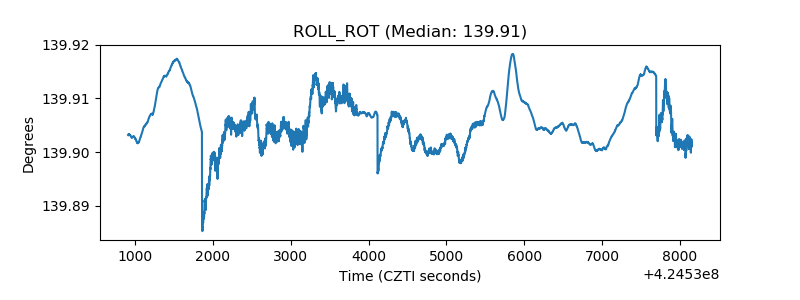 |
| _Roll_DEC | 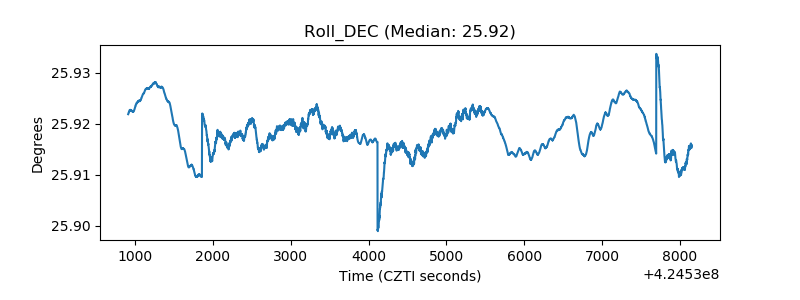 |
| _Roll_RA | 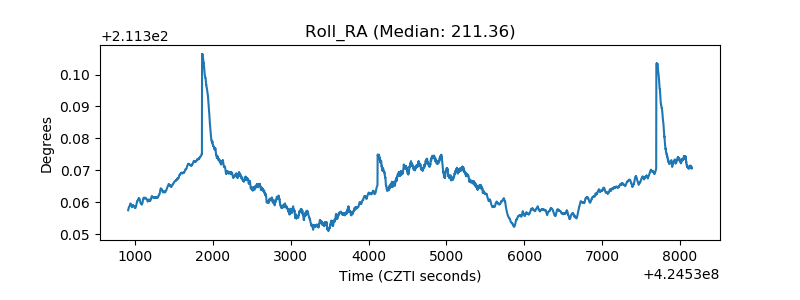 |
| Veto Counter | 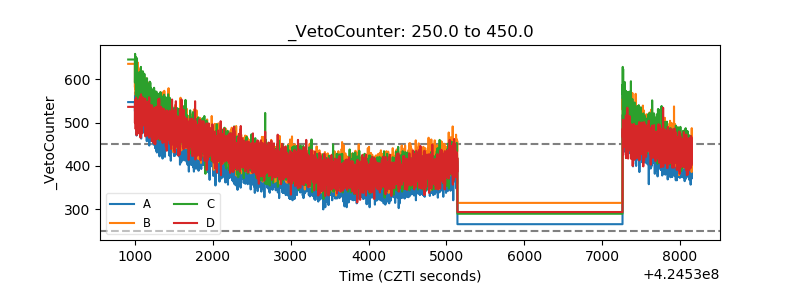 |