| Param | Original file | Final file |
|---|---|---|
| Filename | modeM0/AS1A12_077T12_9000005692_41708cztM0_level2.fits | modeM0/AS1A12_077T12_9000005692_41708cztM0_level2_quad_clean.evt |
| Size (bytes) | 306,483,840 | 87,514,560 |
| Size | 292.3 MB | 83.5 MB |
| Events in quadrant A | 2,823,747 | 598,384 |
| Events in quadrant B | 2,497,329 | 605,841 |
| Events in quadrant C | 2,790,423 | 561,446 |
| Events in quadrant D | 2,843,563 | 533,712 |
| Mode M9 | |||
|---|---|---|---|
| Quadrant | BADHDUFLAG | Total packets | Discarded packets |
| A | 0 | 36 | 0 |
| B | 0 | 36 | 0 |
| C | 0 | 37 | 0 |
| D | 0 | 37 | 0 |
| Mode M0 | |||
|---|---|---|---|
| Quadrant | BADHDUFLAG | Total packets | Discarded packets |
| A | 0 | 11427 | 2 |
| B | 0 | 10767 | 2 |
| C | 0 | 11354 | 2 |
| D | 0 | 11905 | 2 |
| Mode SS | |||
|---|---|---|---|
| Quadrant | BADHDUFLAG | Total packets | Discarded packets |
| A | 0 | 102 | 0 |
| B | 0 | 102 | 0 |
| C | 0 | 102 | 0 |
| D | 0 | 102 | 0 |
| Quadrant | Total seconds | Saturated seconds | Saturation percentage |
|---|---|---|---|
| A | 5001 | 13 | 0.259948% |
| B | 5001 | 32 | 0.639872% |
| C | 5001 | 168 | 3.359328% |
| D | 5001 | 92 | 1.839632% |
Noise dominated data is calculated using 1-second bins in cleaned event files. If a bin has >2000 counts, and if more than 50% of those come from <1% of pixels, then it is considered to be noise-dominated and hence unusable.
| Quadrant | # 1 sec bins | Bins with >0 counts | Bins with >2000 counts | High rate bins dominated by noise | Noise dominated (total time) | Noise dominated (detector-on time) | Marked lightcurve |
|---|---|---|---|---|---|---|---|
| A | 7123 | 5002 | 6 | 6 | 0.08% | 0.12% | 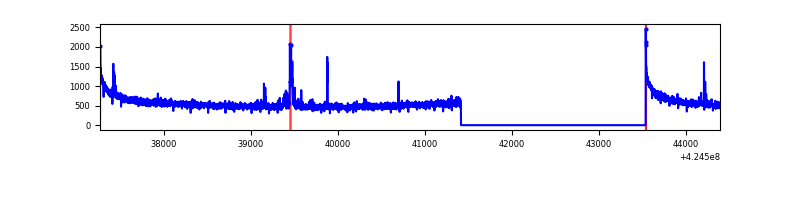 |
| B | 7123 | 5002 | 24 | 24 | 0.34% | 0.48% | 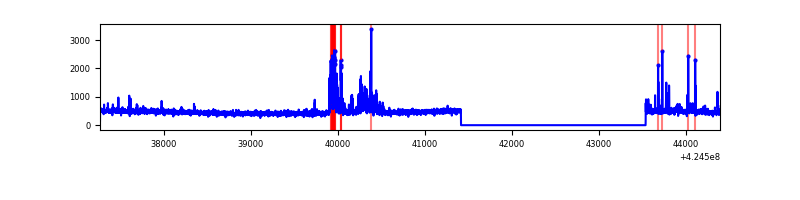 |
| C | 7123 | 5002 | 163 | 163 | 2.29% | 3.26% | 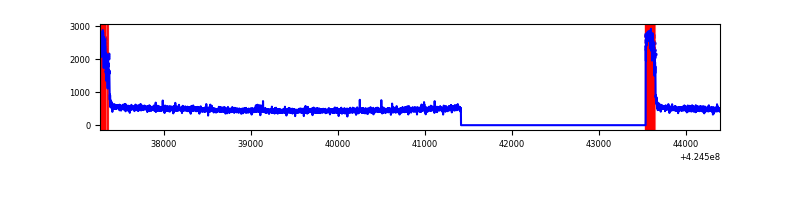 |
| D | 7123 | 5002 | 89 | 89 | 1.25% | 1.78% | 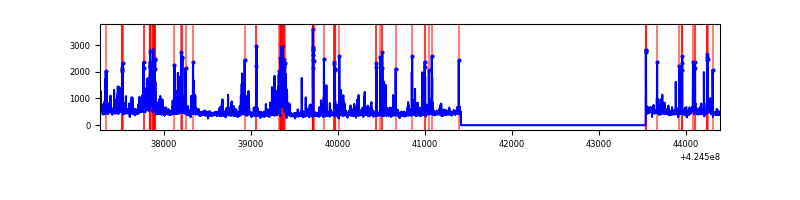 |
Top three noisy pixels from each quadrant. If the there are fewer than three noisy pixels in the level2.evt file, extra rows are filled as -1
| Pixel properties | Quadrant properties | ||||||
|---|---|---|---|---|---|---|---|
| Quadrant | DetID | PixID | Counts | Sigma | Mean | Median | Sigma |
| A | 10 | 83 | 521895 | 4429.74 | 570 | 559 | 117.7 |
| A | 15 | 223 | 80571 | 679.85 | 570 | 559 | 117.7 |
| A | 2 | 79 | 9150 | 73.0 | 570 | 559 | 117.7 |
| B | 5 | 255 | 219463 | 2020.4 | 562 | 548 | 108.4 |
| B | 4 | 141 | 38317 | 348.58 | 562 | 548 | 108.4 |
| B | 0 | 190 | 20692 | 185.91 | 562 | 548 | 108.4 |
| C | 0 | 10 | 459362 | 3609.24 | 544 | 549 | 127.1 |
| C | 15 | 214 | 203192 | 1594.08 | 544 | 549 | 127.1 |
| C | 14 | 254 | 5127 | 36.01 | 544 | 549 | 127.1 |
| D | 2 | 249 | 488348 | 3644.55 | 554 | 540 | 133.8 |
| D | 13 | 249 | 159427 | 1187.09 | 554 | 540 | 133.8 |
| D | 2 | 234 | 25178 | 184.08 | 554 | 540 | 133.8 |
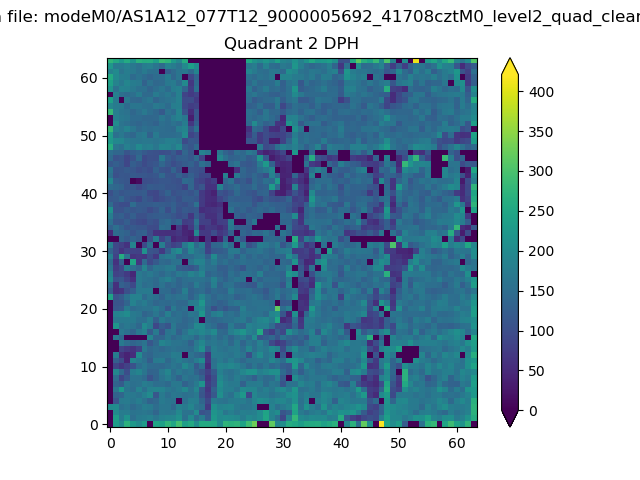
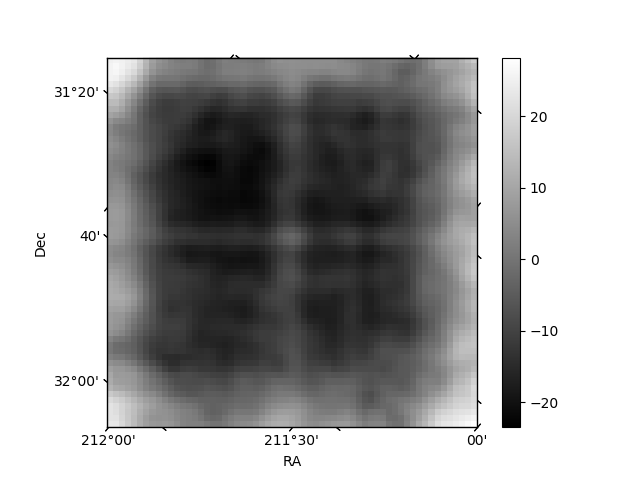
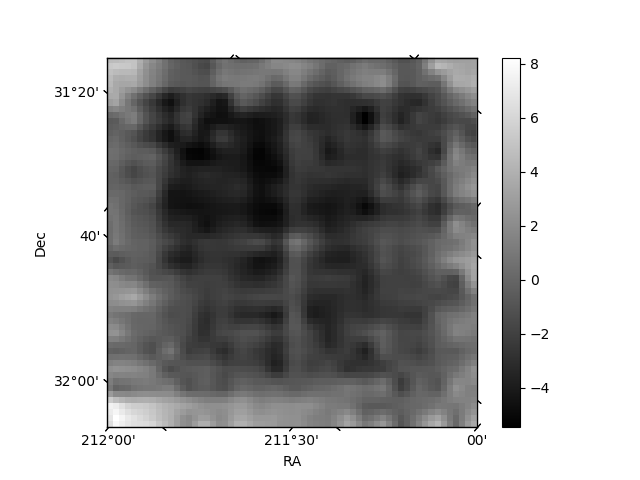
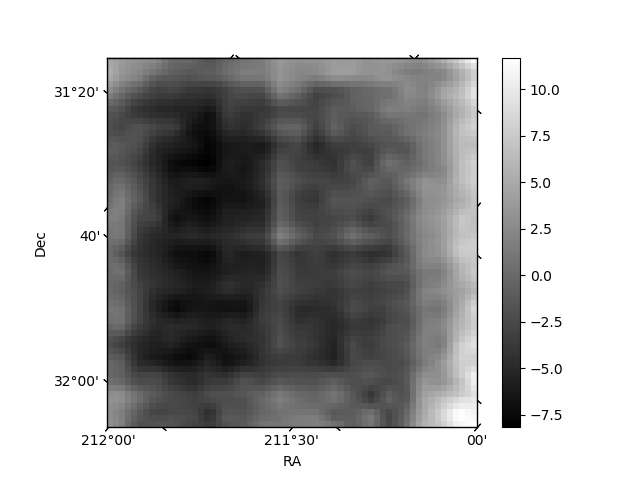
Histogram calculated using DETX and DETY for each event in the final _common_clean file
| Quadrant A | 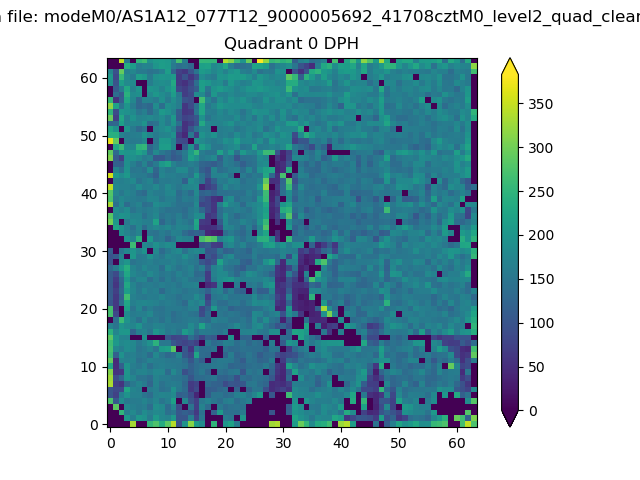 |
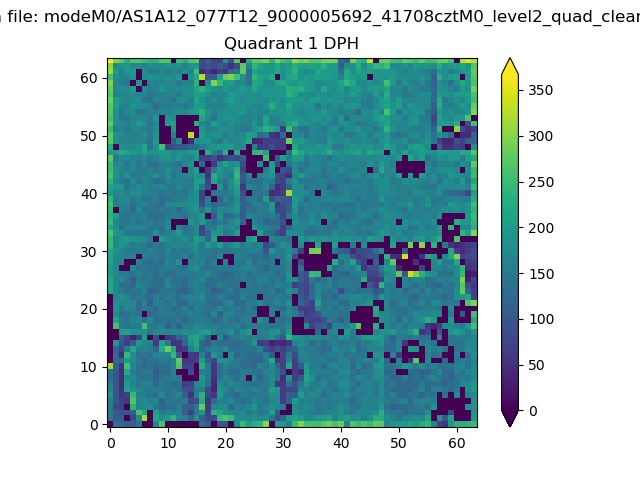 |
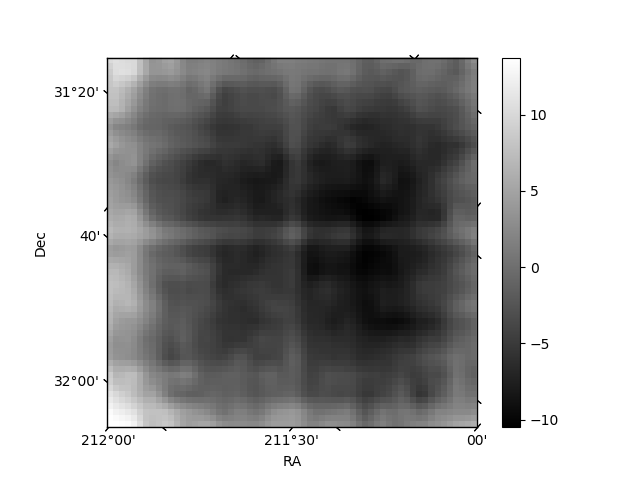
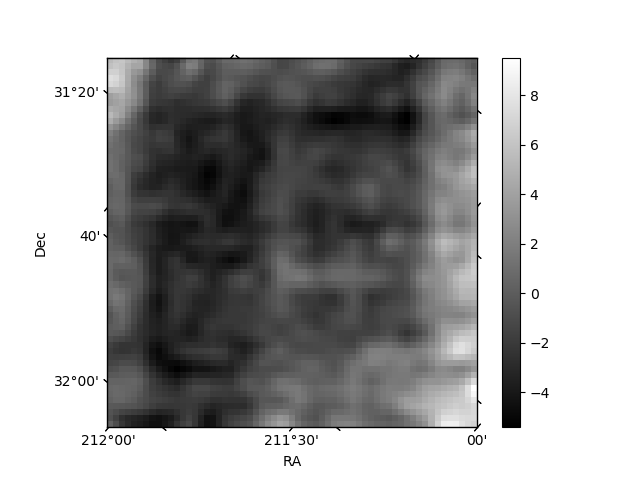
Quadrant B |
|---|---|---|---|
| Quadrant D | 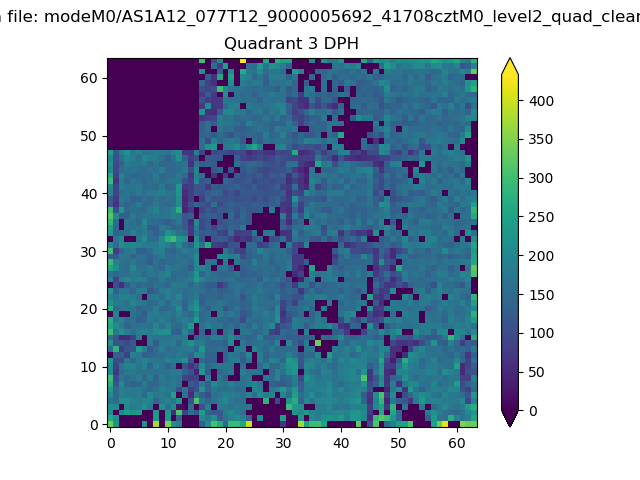 |
 |
Quadrant C |
| Plot type | Count rate plots | Images |
|---|---|---|
| Comparison with Poisson distribution Blue bars denote a histogram of data divided into 1 sec bins. Red curve is a Poisson curve with rate = median count rate of data. |
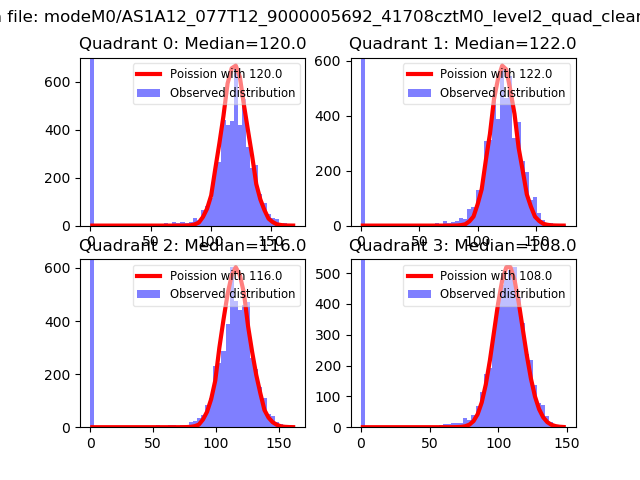 |
 |
| Quadrant-wise count rates Data is divided into 100 sec bins |
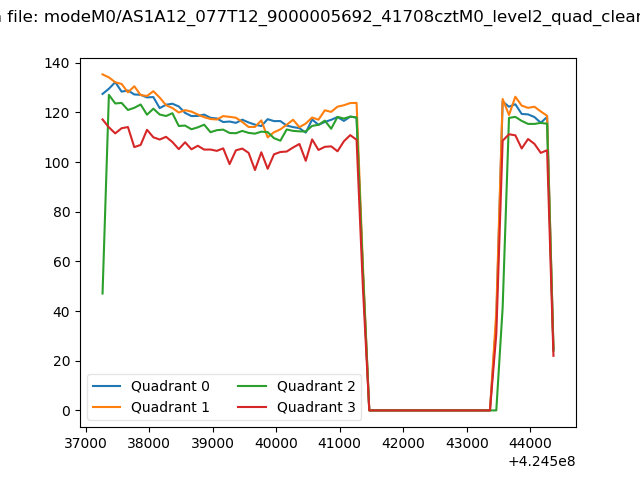 |
|
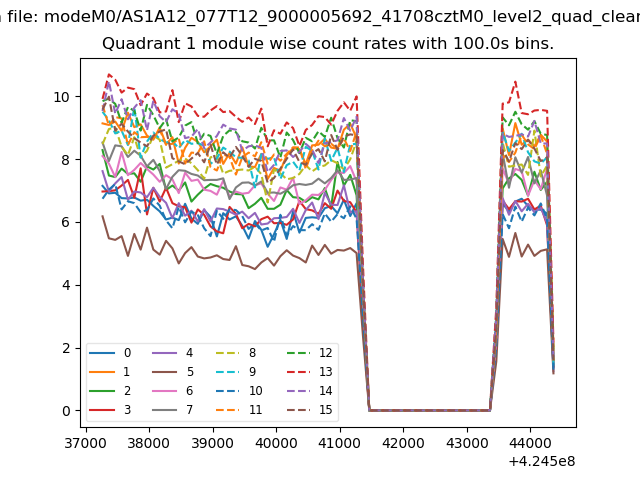
| Module-wise count rates for Quadrant A Data is divided into 100 sec bins |
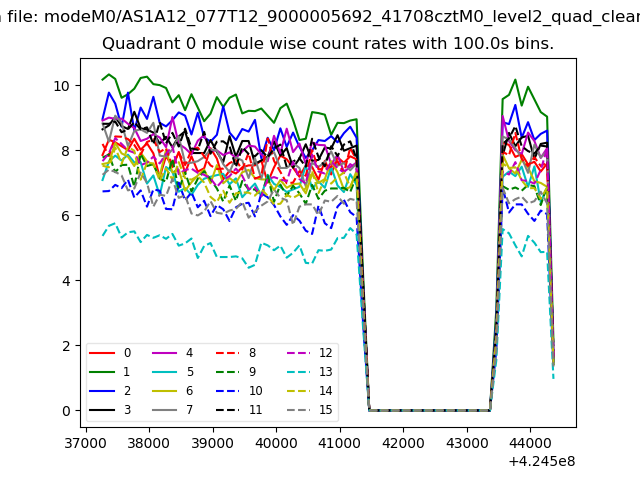 |
 |
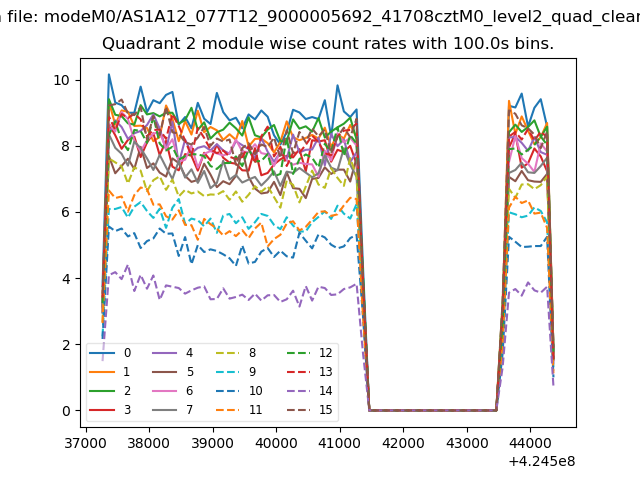
| Module-wise count rates for Quadrant B Data is divided into 100 sec bins |
 |
 |
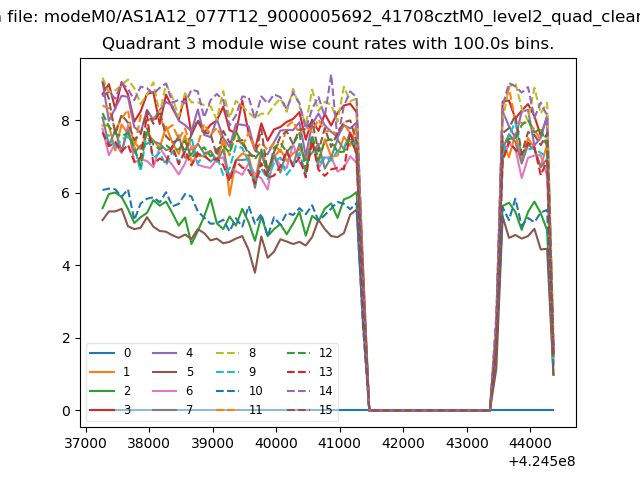
| Module-wise count rates for Quadrant C Data is divided into 100 sec bins |
 |
 |
| Module-wise count rates for Quadrant D Data is divided into 100 sec bins |
 |
 |
| Parameter | Plot |
|---|---|
| CZT HV Monitor | 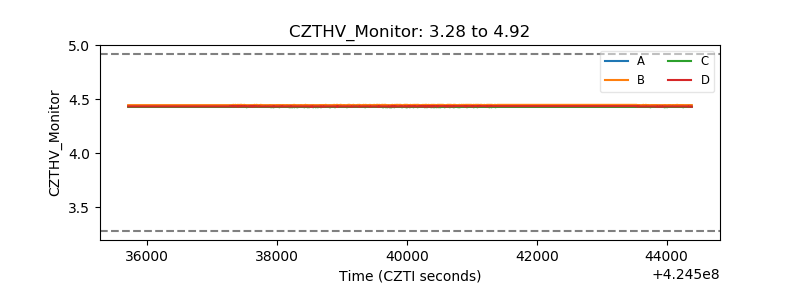 |
| D_VDD | 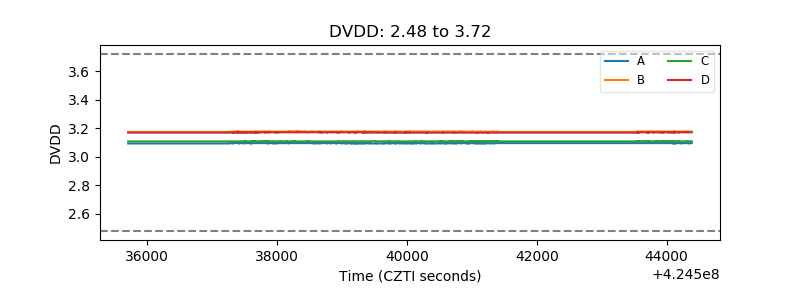 |
| Temperature 1 | 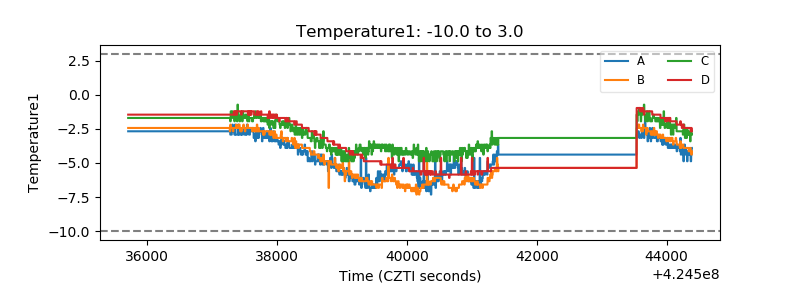 |
| Veto HV Monitor |  |
| Veto LLD | 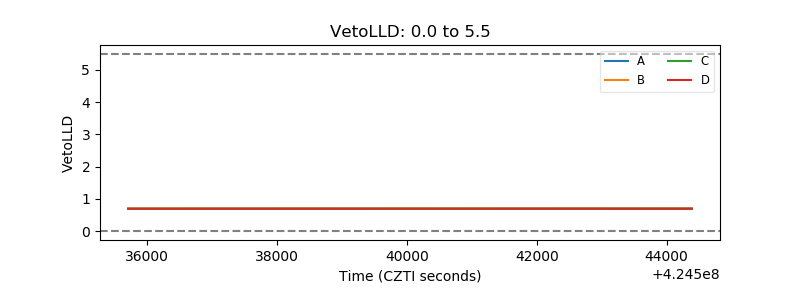 |
| Alpha Counter | 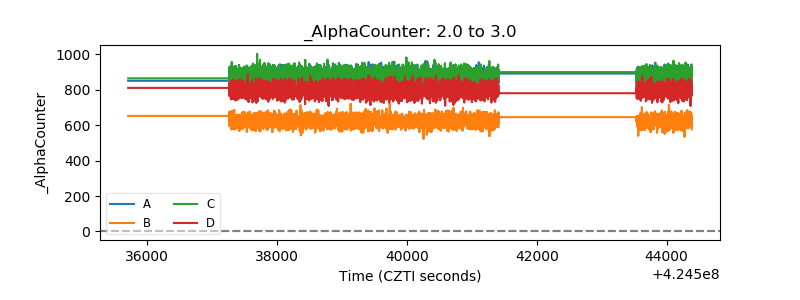 |
| _CPM_Rate | 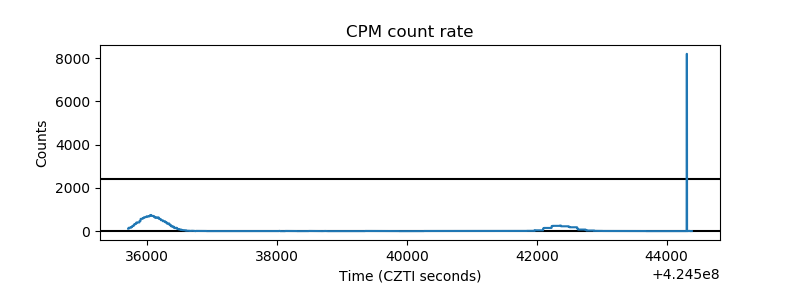 |
| CZT Counter | 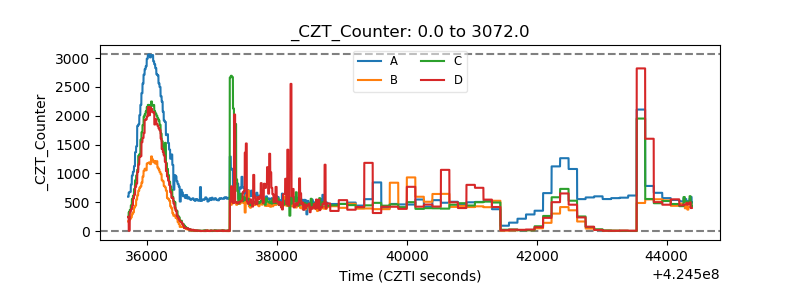 |
| +2.5 Volts monitor | 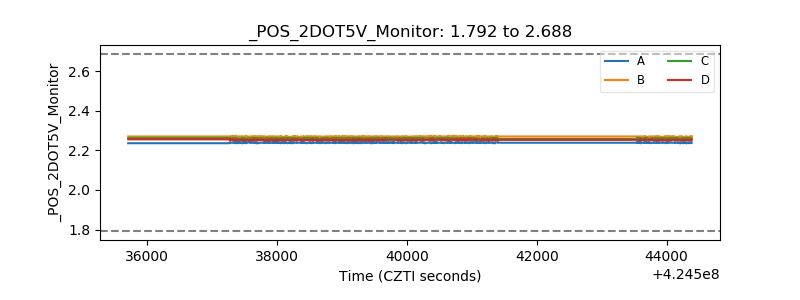 |
| +5 Volts monitor | 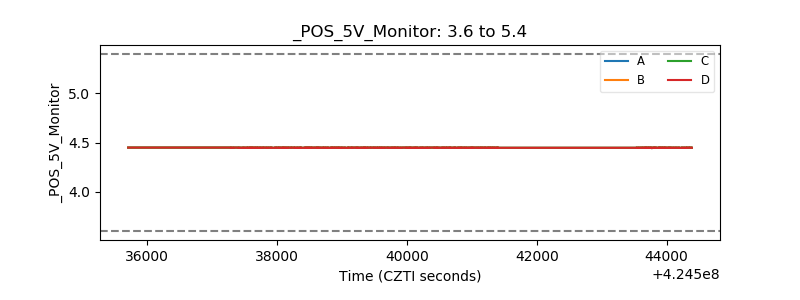 |
| _ROLL_ROT | 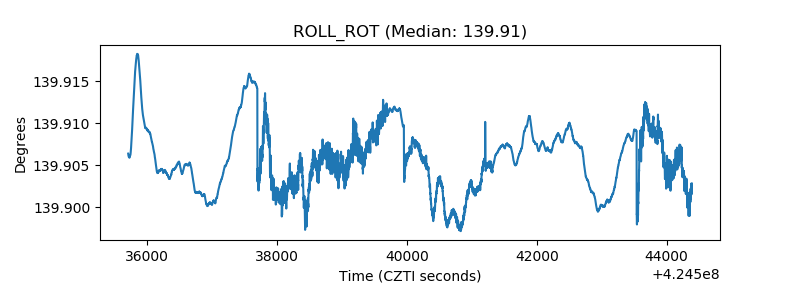 |
| _Roll_DEC | 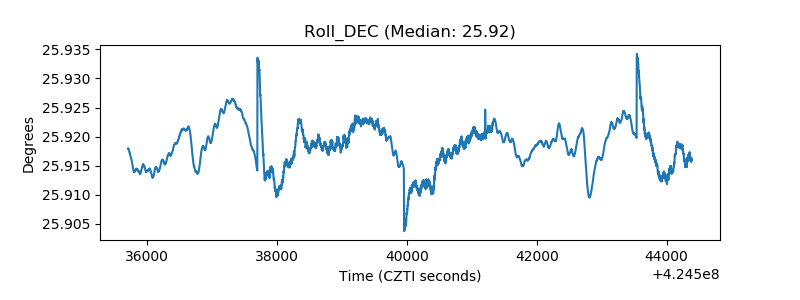 |
| _Roll_RA | 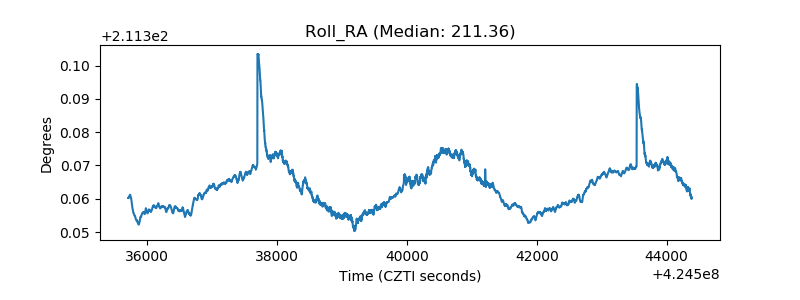 |
| Veto Counter | 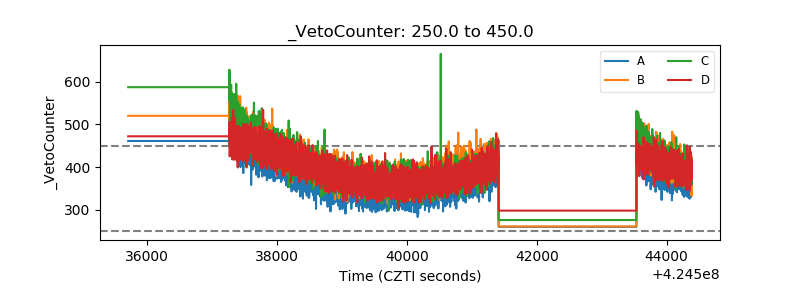 |