| Param | Original file | Final file |
|---|---|---|
| Filename | modeM0/AS1A12_077T12_9000005692_41709cztM0_level2.fits | modeM0/AS1A12_077T12_9000005692_41709cztM0_level2_quad_clean.evt |
| Size (bytes) | 188,205,120 | 42,341,760 |
| Size | 179.5 MB | 40.4 MB |
| Events in quadrant A | 1,617,078 | 277,236 |
| Events in quadrant B | 1,381,415 | 283,941 |
| Events in quadrant C | 1,633,092 | 260,078 |
| Events in quadrant D | 2,096,153 | 244,034 |
| Mode M9 | |||
|---|---|---|---|
| Quadrant | BADHDUFLAG | Total packets | Discarded packets |
| A | 0 | 19 | 0 |
| B | 0 | 19 | 0 |
| C | 0 | 19 | 0 |
| D | 0 | 19 | 0 |
| Mode M0 | |||
|---|---|---|---|
| Quadrant | BADHDUFLAG | Total packets | Discarded packets |
| A | 0 | 6656 | 40 |
| B | 0 | 6251 | 33 |
| C | 0 | 6807 | 35 |
| D | 0 | 8388 | 36 |
| Mode SS | |||
|---|---|---|---|
| Quadrant | BADHDUFLAG | Total packets | Discarded packets |
| A | 0 | 64 | 2 |
| B | 0 | 64 | 0 |
| C | 0 | 63 | 1 |
| D | 0 | 64 | 2 |
| Quadrant | Total seconds | Saturated seconds | Saturation percentage |
|---|---|---|---|
| A | 3045 | 8 | 0.262726% |
| B | 3045 | 10 | 0.328407% |
| C | 3044 | 96 | 3.153745% |
| D | 3045 | 144 | 4.729064% |
Noise dominated data is calculated using 1-second bins in cleaned event files. If a bin has >2000 counts, and if more than 50% of those come from <1% of pixels, then it is considered to be noise-dominated and hence unusable.
| Quadrant | # 1 sec bins | Bins with >0 counts | Bins with >2000 counts | High rate bins dominated by noise | Noise dominated (total time) | Noise dominated (detector-on time) | Marked lightcurve |
|---|---|---|---|---|---|---|---|
| A | 4990 | 3048 | 2 | 2 | 0.04% | 0.07% |  |
| B | 4990 | 3048 | 7 | 7 | 0.14% | 0.23% | 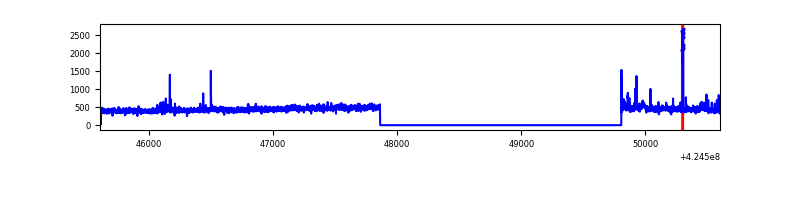 |
| C | 4994 | 3049 | 95 | 95 | 1.90% | 3.12% | 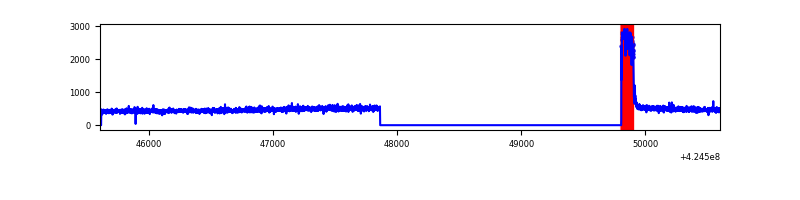 |
| D | 4994 | 3048 | 151 | 151 | 3.02% | 4.95% | 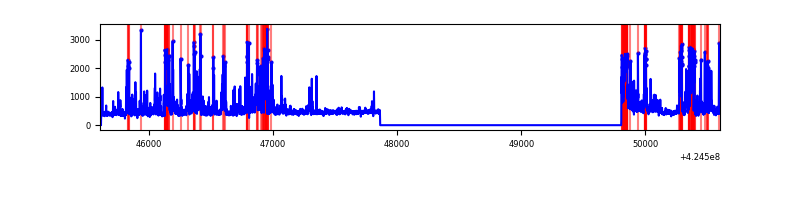 |
Top three noisy pixels from each quadrant. If the there are fewer than three noisy pixels in the level2.evt file, extra rows are filled as -1
| Pixel properties | Quadrant properties | ||||||
|---|---|---|---|---|---|---|---|
| Quadrant | DetID | PixID | Counts | Sigma | Mean | Median | Sigma |
| A | 10 | 83 | 286896 | 4005.4 | 339 | 332 | 71.5 |
| A | 15 | 223 | 8997 | 121.11 | 339 | 332 | 71.5 |
| A | 2 | 79 | 7338 | 97.93 | 339 | 332 | 71.5 |
| B | 4 | 141 | 28114 | 418.4 | 337 | 328 | 66.4 |
| B | 5 | 255 | 11527 | 168.63 | 337 | 328 | 66.4 |
| B | 12 | 111 | 8513 | 123.25 | 337 | 328 | 66.4 |
| C | 0 | 10 | 245081 | 3158.74 | 324 | 325 | 77.5 |
| C | 15 | 214 | 122488 | 1576.6 | 324 | 325 | 77.5 |
| C | 13 | 61 | 2156 | 23.63 | 324 | 325 | 77.5 |
| D | 2 | 249 | 546172 | 6779.11 | 324 | 314 | 80.5 |
| D | 13 | 249 | 234295 | 2905.85 | 324 | 314 | 80.5 |
| D | 12 | 6 | 47050 | 580.42 | 324 | 314 | 80.5 |
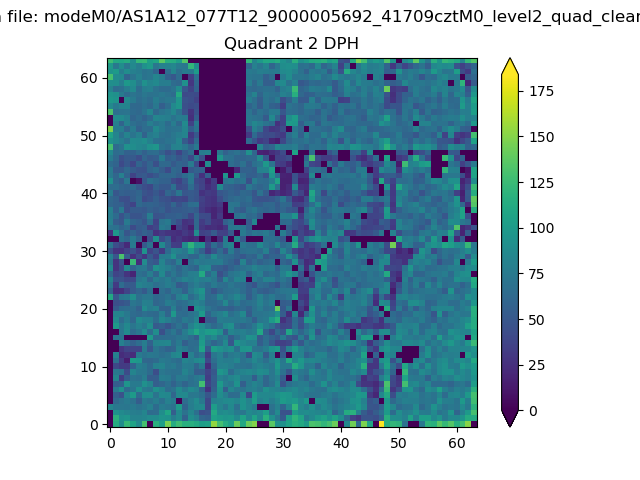
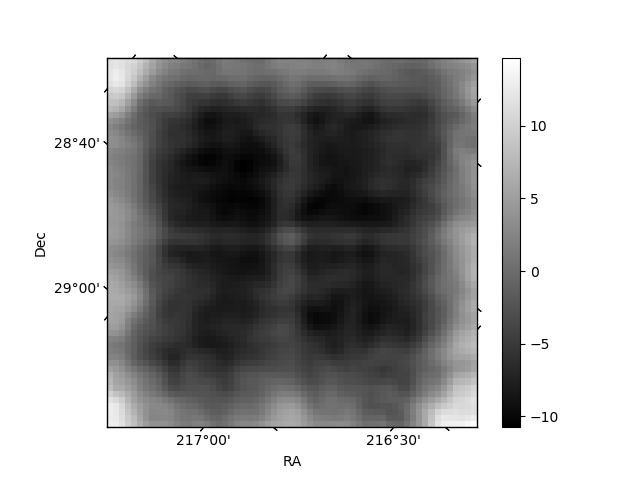
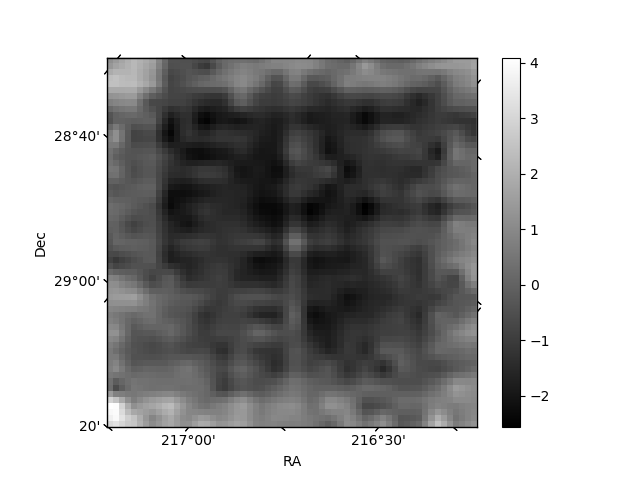
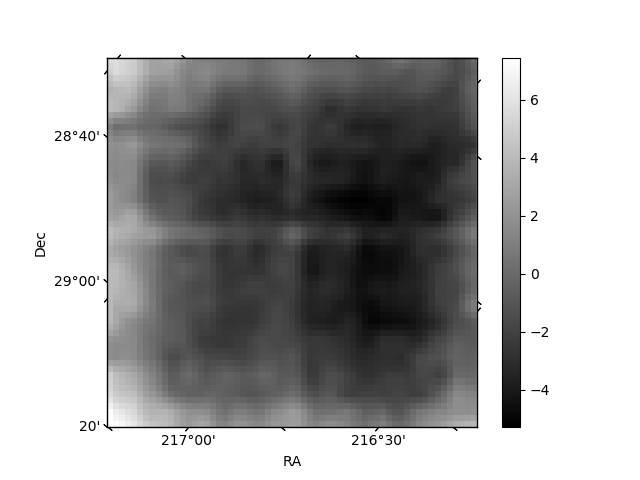
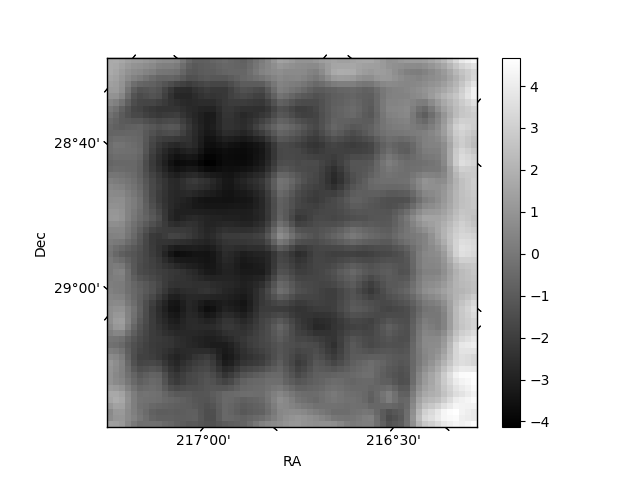
Histogram calculated using DETX and DETY for each event in the final _common_clean file
| Quadrant A | 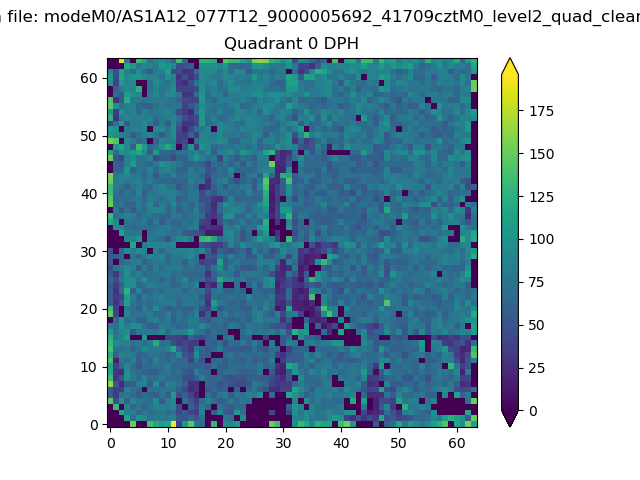 |
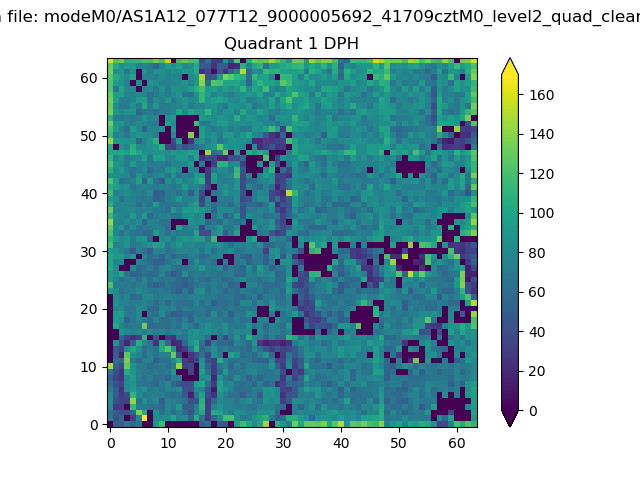 |
Quadrant B |
|---|---|---|---|
| Quadrant D | 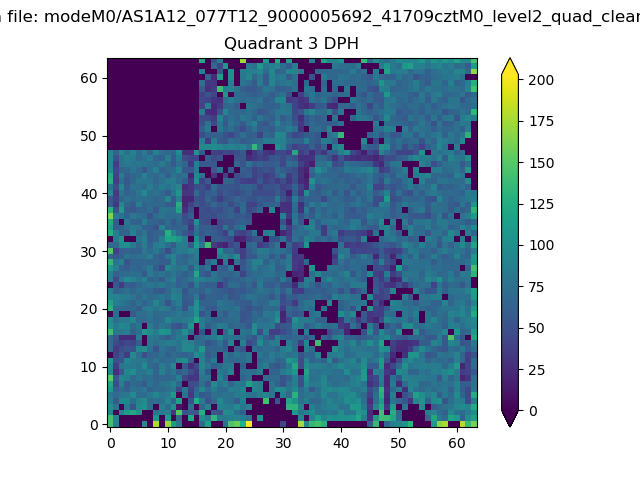 |
 |
Quadrant C |
| Plot type | Count rate plots | Images |
|---|---|---|
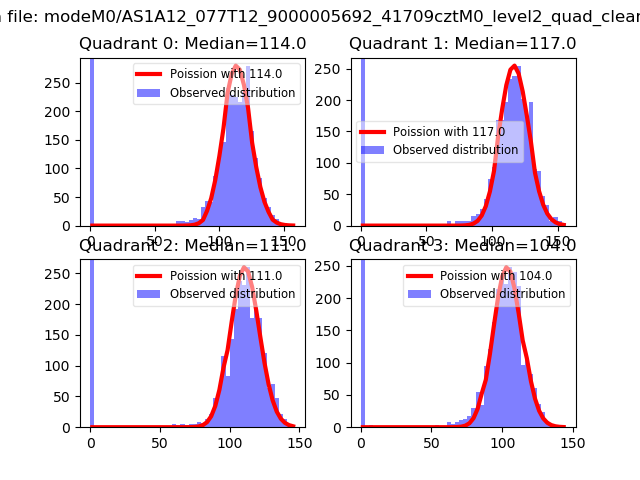
| Comparison with Poisson distribution Blue bars denote a histogram of data divided into 1 sec bins. Red curve is a Poisson curve with rate = median count rate of data. |
 |
 |
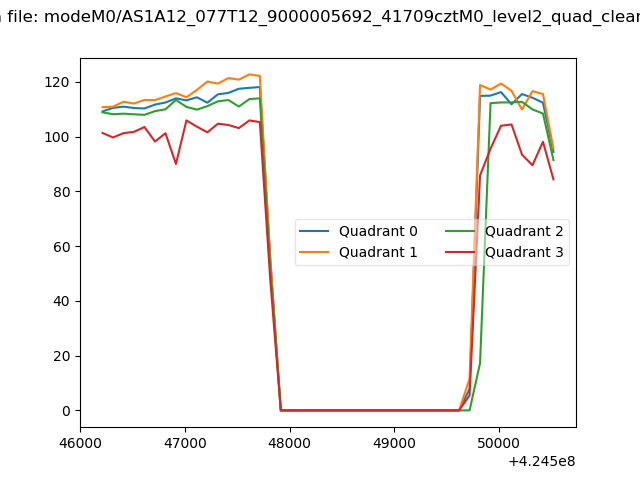
| Quadrant-wise count rates Data is divided into 100 sec bins |
 |
|
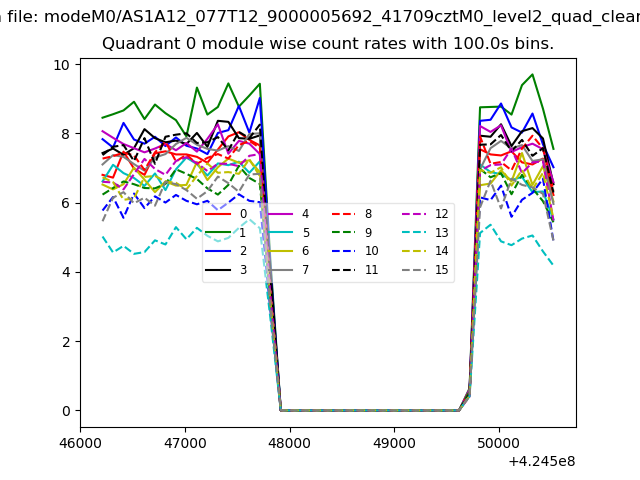
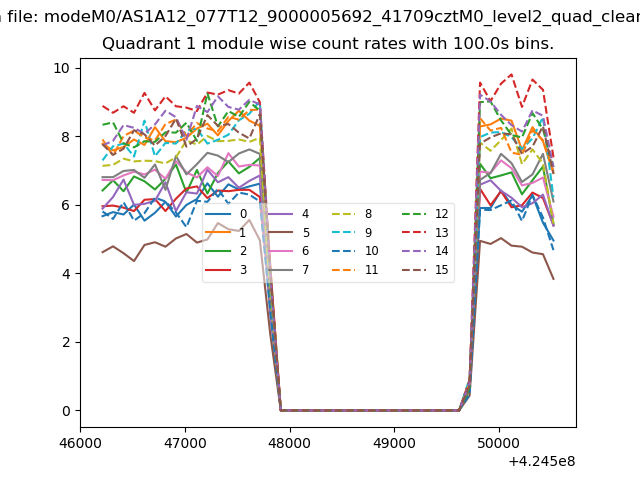
| Module-wise count rates for Quadrant A Data is divided into 100 sec bins |
 |
 |
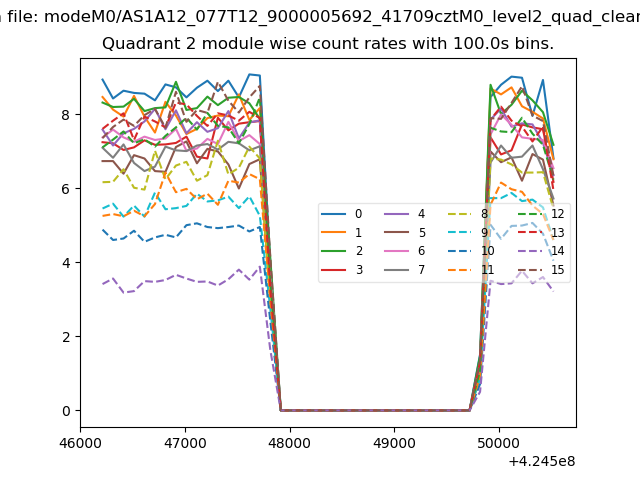
| Module-wise count rates for Quadrant B Data is divided into 100 sec bins |
 |
 |
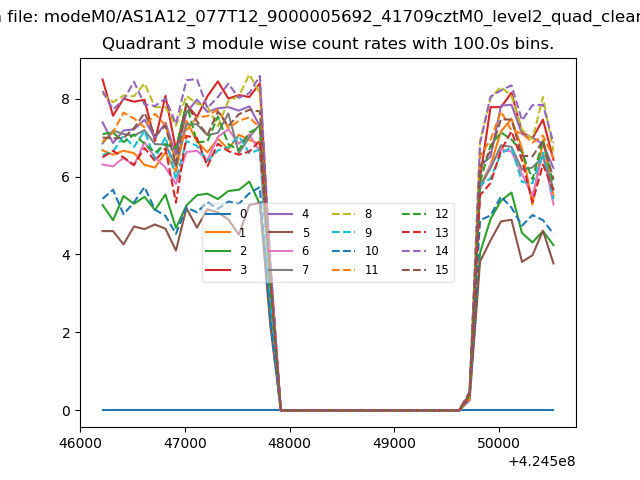
| Module-wise count rates for Quadrant C Data is divided into 100 sec bins |
 |
 |
| Module-wise count rates for Quadrant D Data is divided into 100 sec bins |
 |
 |
| Parameter | Plot |
|---|---|
| CZT HV Monitor | 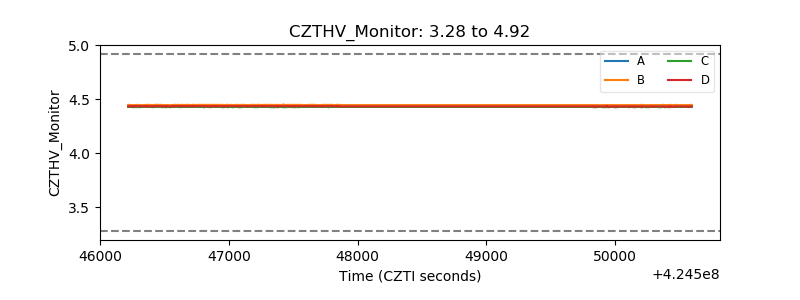 |
| D_VDD | 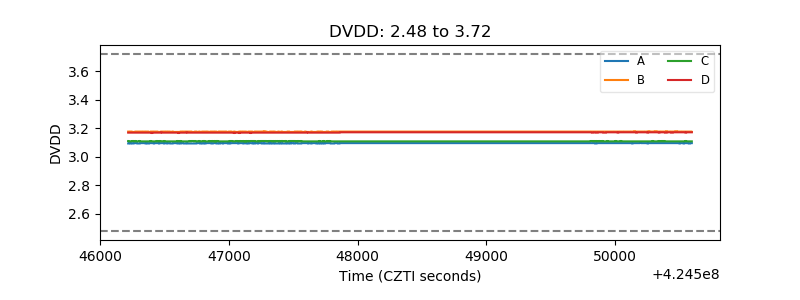 |
| Temperature 1 | 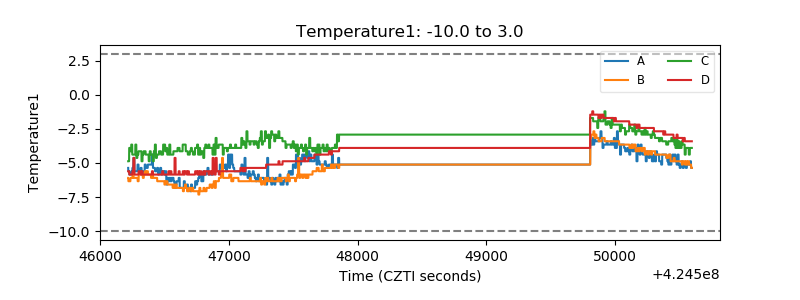 |
| Veto HV Monitor | 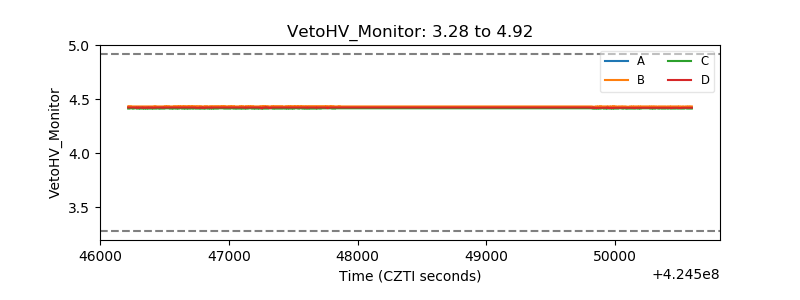 |
| Veto LLD | 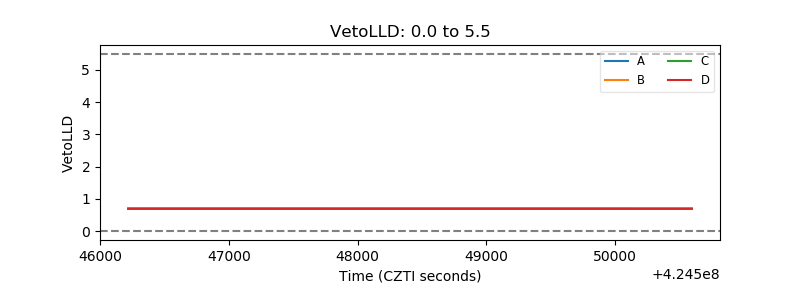 |
| Alpha Counter | 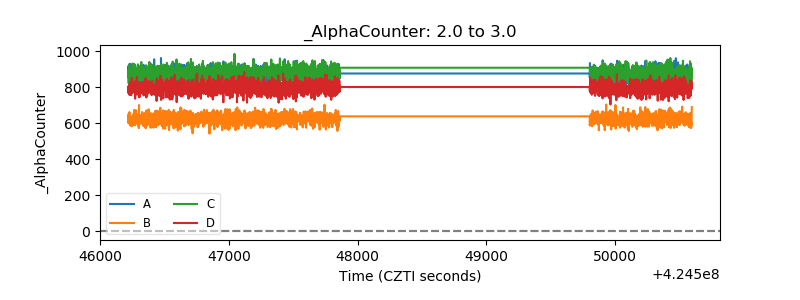 |
| _CPM_Rate | 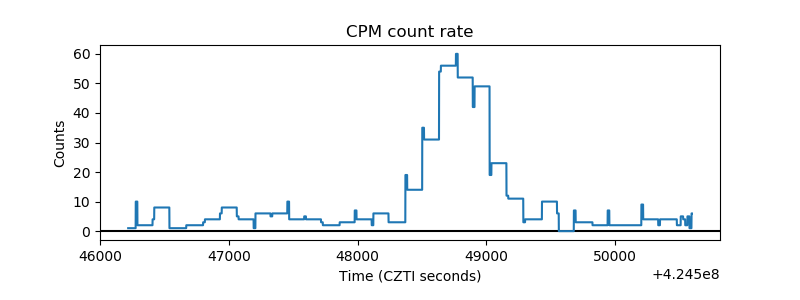 |
| CZT Counter | 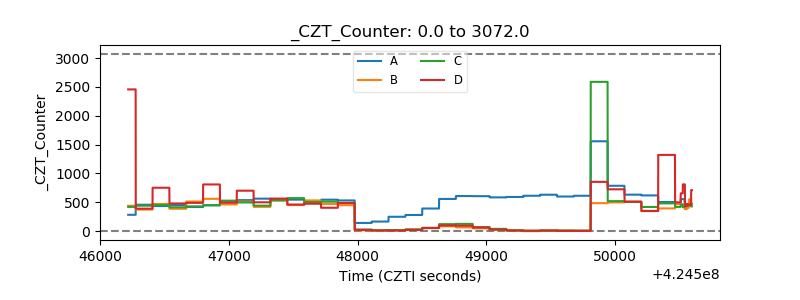 |
| +2.5 Volts monitor | 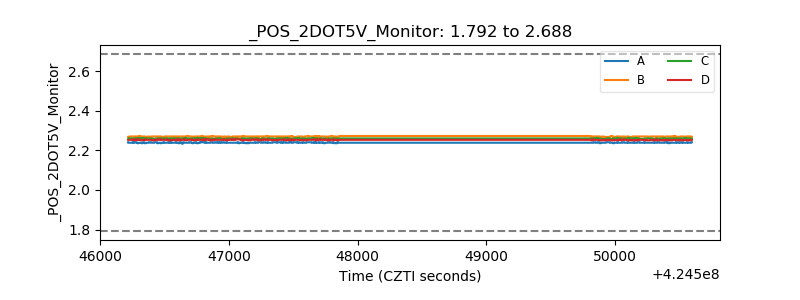 |
| +5 Volts monitor | 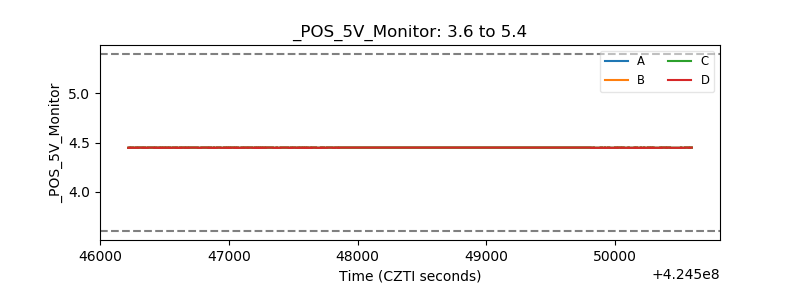 |
| _ROLL_ROT | 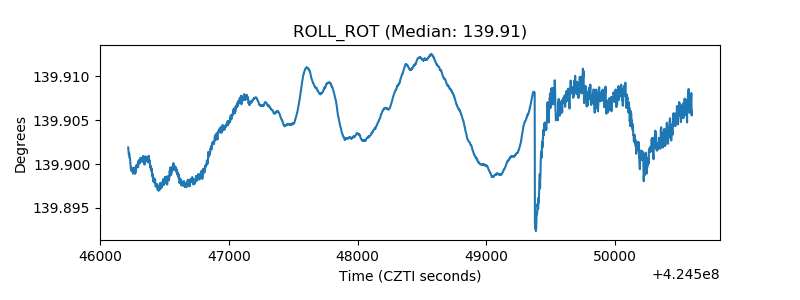 |
| _Roll_DEC | 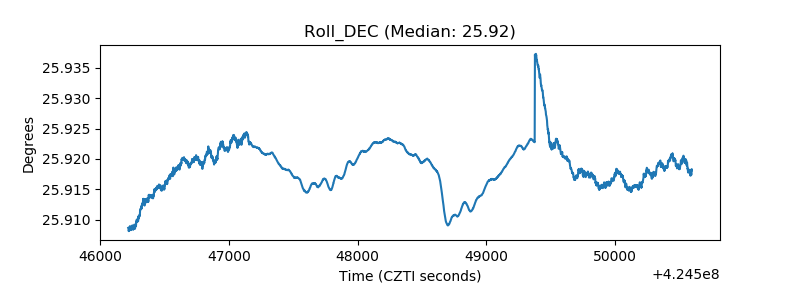 |
| _Roll_RA | 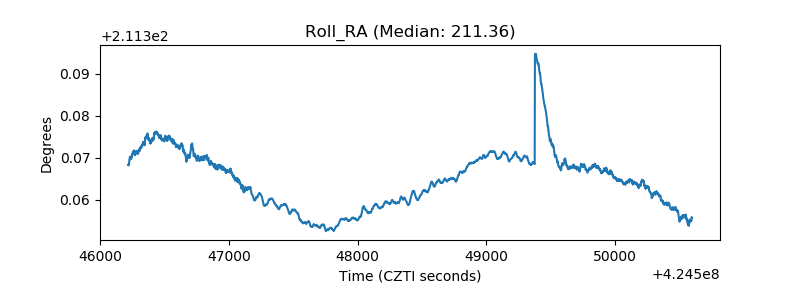 |
| Veto Counter | 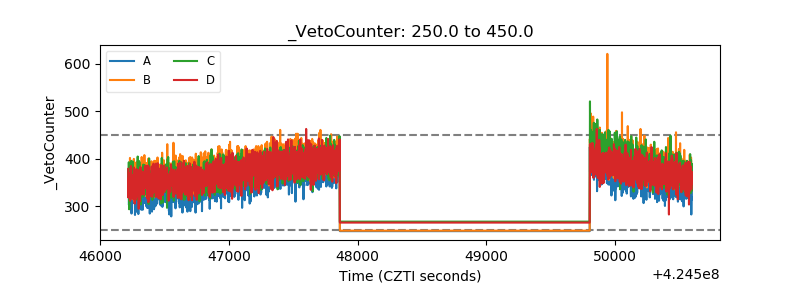 |