| Param | Original file | Final file |
|---|---|---|
| Filename | modeM0/AS1A12_077T12_9000005692_41710cztM0_level2.fits | modeM0/AS1A12_077T12_9000005692_41710cztM0_level2_quad_clean.evt |
| Size (bytes) | 332,976,960 | 90,547,200 |
| Size | 317.6 MB | 86.4 MB |
| Events in quadrant A | 2,901,180 | 612,430 |
| Events in quadrant B | 2,494,213 | 626,047 |
| Events in quadrant C | 2,962,358 | 577,044 |
| Events in quadrant D | 3,536,945 | 539,005 |
| Mode M9 | |||
|---|---|---|---|
| Quadrant | BADHDUFLAG | Total packets | Discarded packets |
| A | 0 | 30 | 0 |
| B | 0 | 31 | 0 |
| C | 0 | 31 | 0 |
| D | 0 | 31 | 0 |
| Mode M0 | |||
|---|---|---|---|
| Quadrant | BADHDUFLAG | Total packets | Discarded packets |
| A | 0 | 12066 | 2 |
| B | 0 | 11324 | 2 |
| C | 0 | 12385 | 2 |
| D | 0 | 14436 | 2 |
| Mode SS | |||
|---|---|---|---|
| Quadrant | BADHDUFLAG | Total packets | Discarded packets |
| A | 0 | 114 | 0 |
| B | 0 | 114 | 0 |
| C | 0 | 114 | 0 |
| D | 0 | 114 | 0 |
| Quadrant | Total seconds | Saturated seconds | Saturation percentage |
|---|---|---|---|
| A | 5529 | 12 | 0.217037% |
| B | 5529 | 16 | 0.289383% |
| C | 5529 | 187 | 3.382167% |
| D | 5529 | 222 | 4.015193% |
Noise dominated data is calculated using 1-second bins in cleaned event files. If a bin has >2000 counts, and if more than 50% of those come from <1% of pixels, then it is considered to be noise-dominated and hence unusable.
| Quadrant | # 1 sec bins | Bins with >0 counts | Bins with >2000 counts | High rate bins dominated by noise | Noise dominated (total time) | Noise dominated (detector-on time) | Marked lightcurve |
|---|---|---|---|---|---|---|---|
| A | 7142 | 5530 | 5 | 5 | 0.07% | 0.09% | 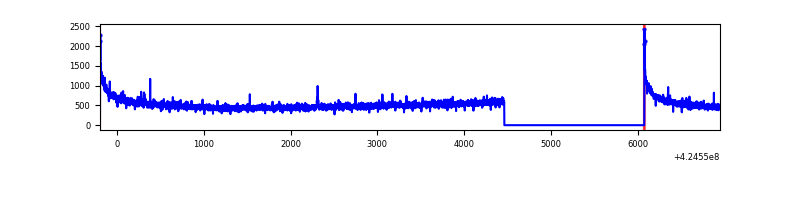 |
| B | 7142 | 5530 | 9 | 9 | 0.13% | 0.16% | 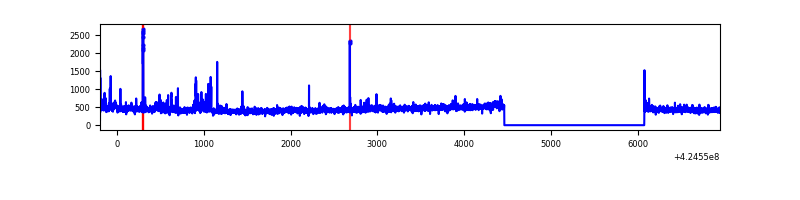 |
| C | 7142 | 5530 | 183 | 183 | 2.56% | 3.31% | 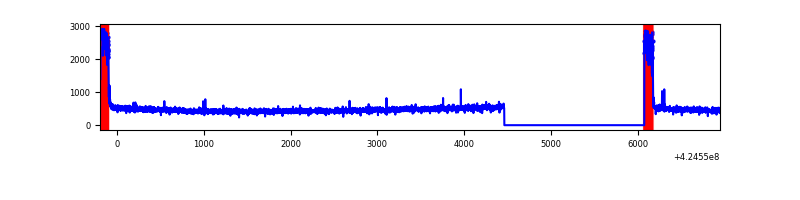 |
| D | 7142 | 5530 | 227 | 227 | 3.18% | 4.10% | 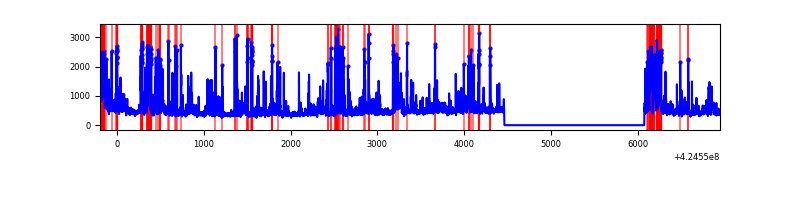 |
Top three noisy pixels from each quadrant. If the there are fewer than three noisy pixels in the level2.evt file, extra rows are filled as -1
| Pixel properties | Quadrant properties | ||||||
|---|---|---|---|---|---|---|---|
| Quadrant | DetID | PixID | Counts | Sigma | Mean | Median | Sigma |
| A | 10 | 83 | 534077 | 4273.43 | 603 | 590 | 124.8 |
| A | 15 | 223 | 15691 | 120.96 | 603 | 590 | 124.8 |
| A | 2 | 79 | 14556 | 111.87 | 603 | 590 | 124.8 |
| B | 5 | 255 | 50231 | 429.44 | 600 | 585 | 115.6 |
| B | 4 | 141 | 31439 | 266.89 | 600 | 585 | 115.6 |
| B | 0 | 245 | 30877 | 262.03 | 600 | 585 | 115.6 |
| C | 0 | 10 | 471404 | 3451.53 | 580 | 585 | 136.4 |
| C | 15 | 214 | 223589 | 1634.82 | 580 | 585 | 136.4 |
| C | 13 | 61 | 3852 | 23.95 | 580 | 585 | 136.4 |
| D | 2 | 249 | 686214 | 4790.23 | 579 | 561 | 143.1 |
| D | 13 | 249 | 364490 | 2542.54 | 579 | 561 | 143.1 |
| D | 12 | 6 | 88874 | 616.99 | 579 | 561 | 143.1 |
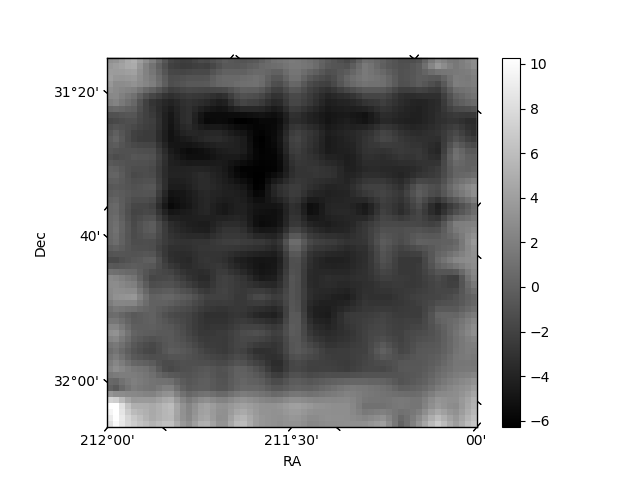
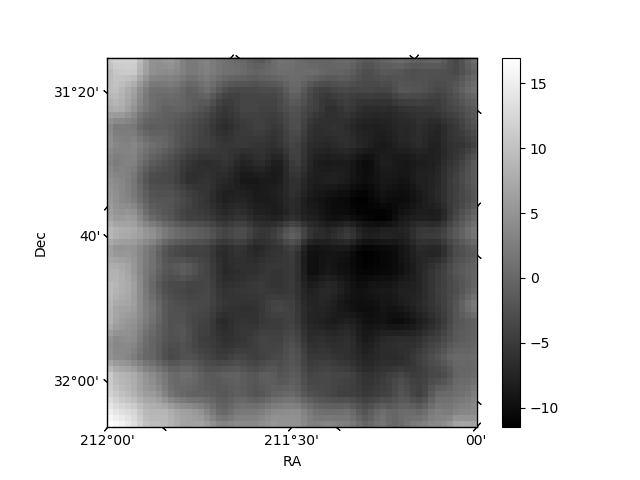
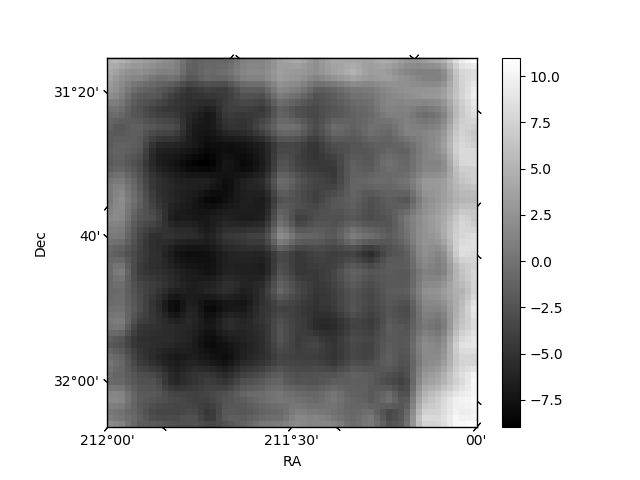
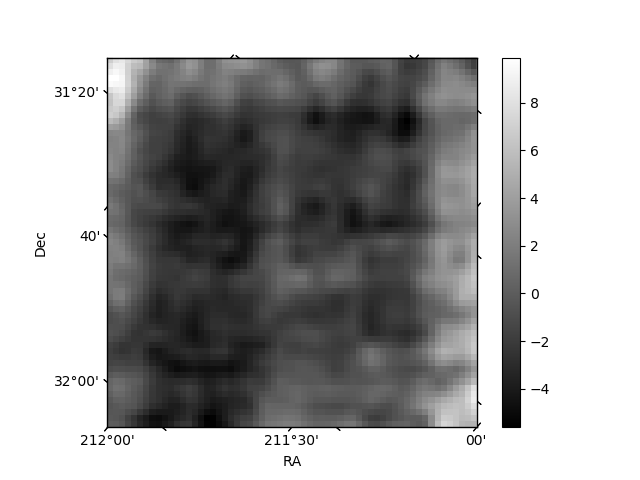
Histogram calculated using DETX and DETY for each event in the final _common_clean file
| Quadrant A | 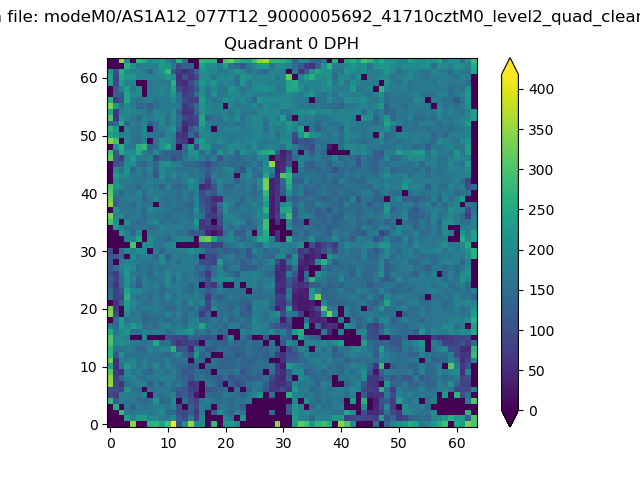 |
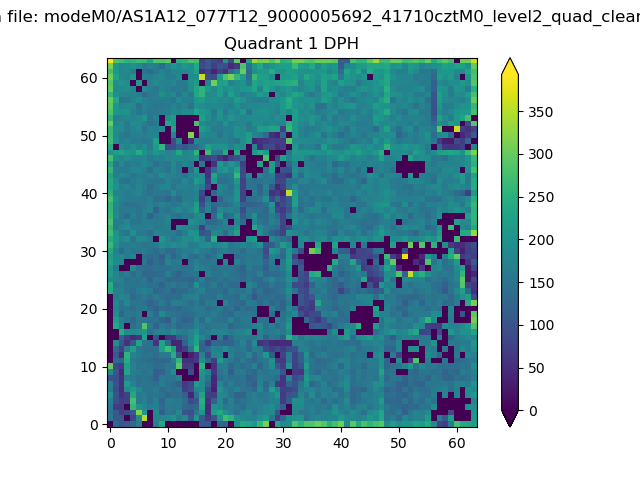 |
Quadrant B |
|---|---|---|---|
| Quadrant D | 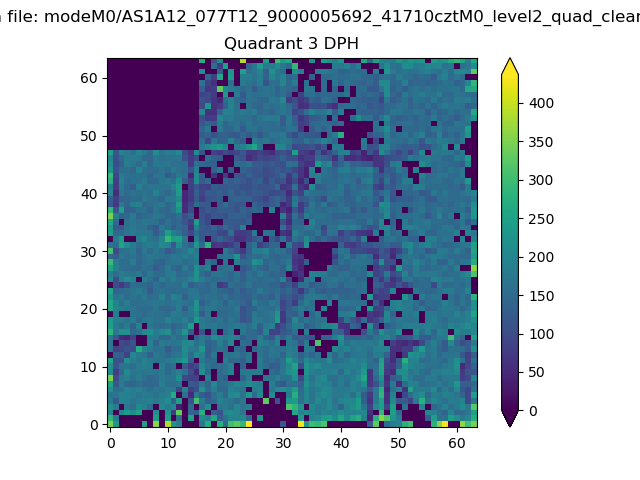 |
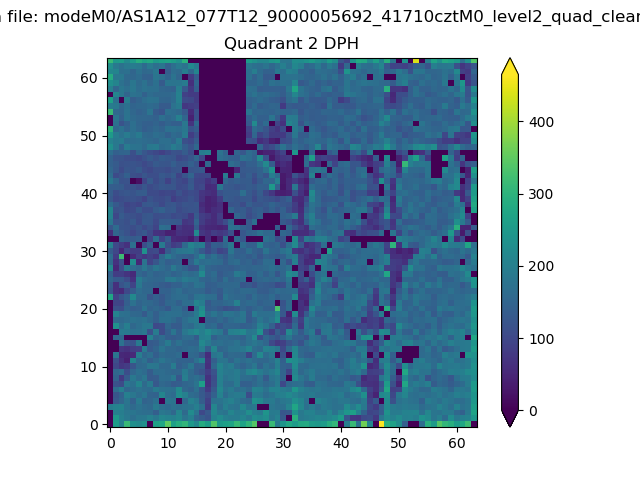 |
Quadrant C |
| Plot type | Count rate plots | Images |
|---|---|---|
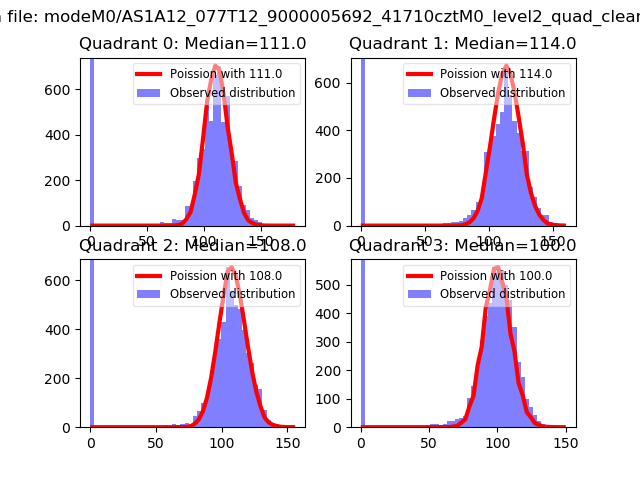
| Comparison with Poisson distribution Blue bars denote a histogram of data divided into 1 sec bins. Red curve is a Poisson curve with rate = median count rate of data. |
 |
 |
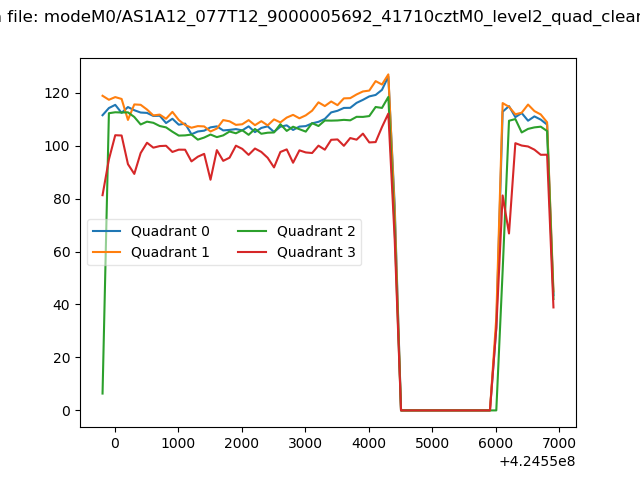
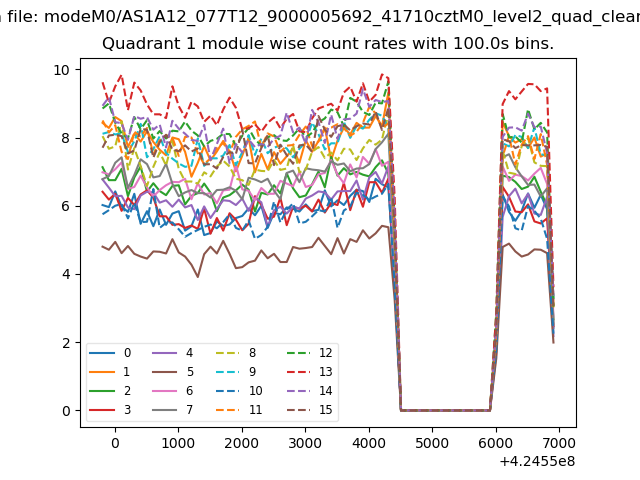
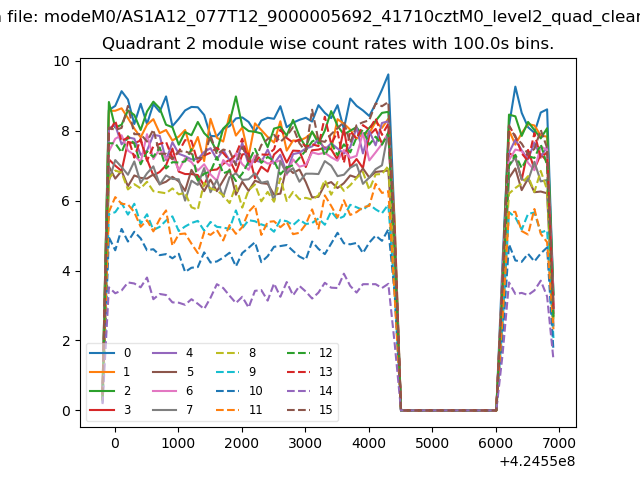
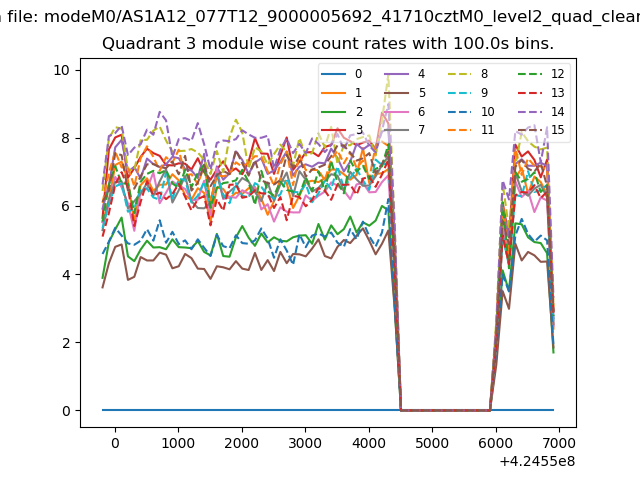
| Quadrant-wise count rates Data is divided into 100 sec bins |
 |
|
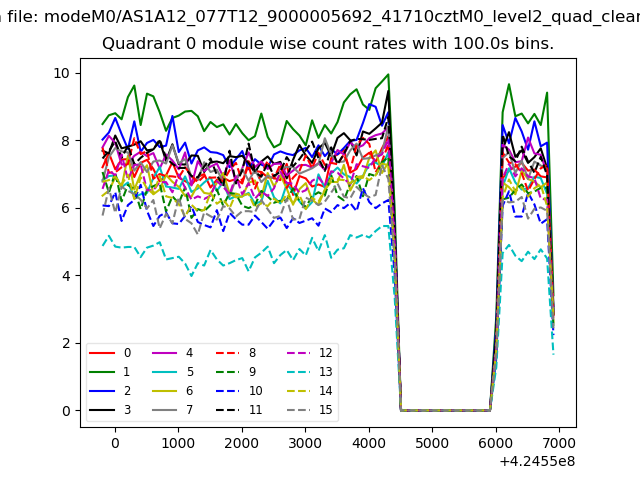
| Module-wise count rates for Quadrant A Data is divided into 100 sec bins |
 |
 |
| Module-wise count rates for Quadrant B Data is divided into 100 sec bins |
 |
 |
| Module-wise count rates for Quadrant C Data is divided into 100 sec bins |
 |
 |
| Module-wise count rates for Quadrant D Data is divided into 100 sec bins |
 |
 |
| Parameter | Plot |
|---|---|
| CZT HV Monitor | 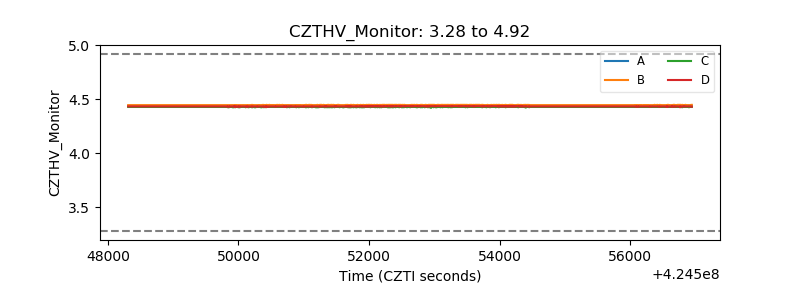 |
| D_VDD | 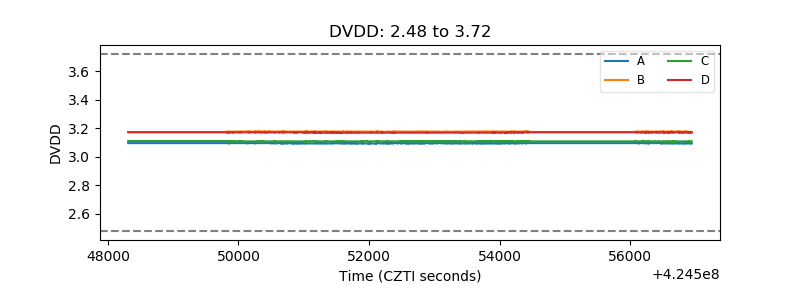 |
| Temperature 1 | 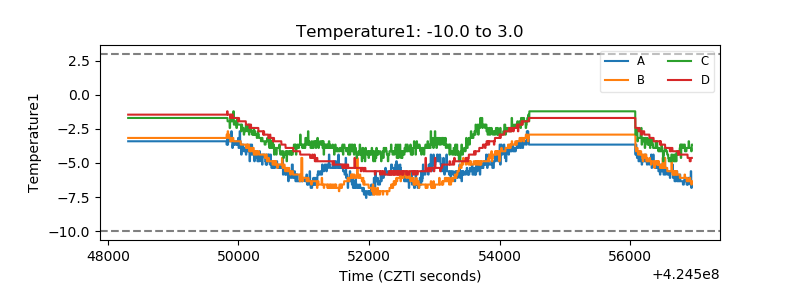 |
| Veto HV Monitor | 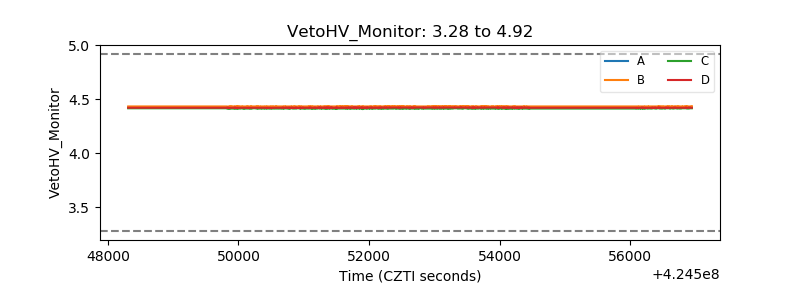 |
| Veto LLD | 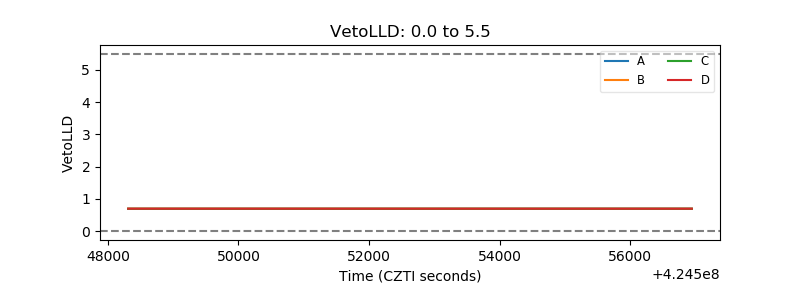 |
| Alpha Counter | 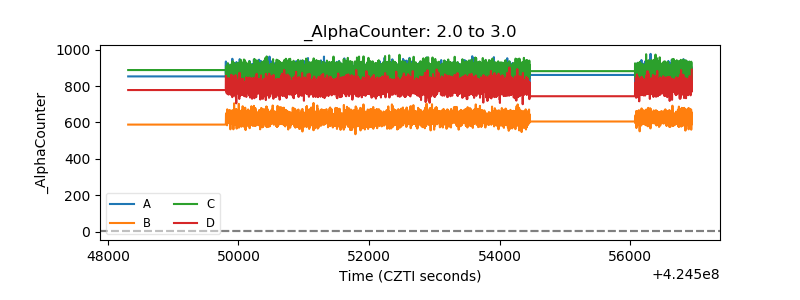 |
| _CPM_Rate | 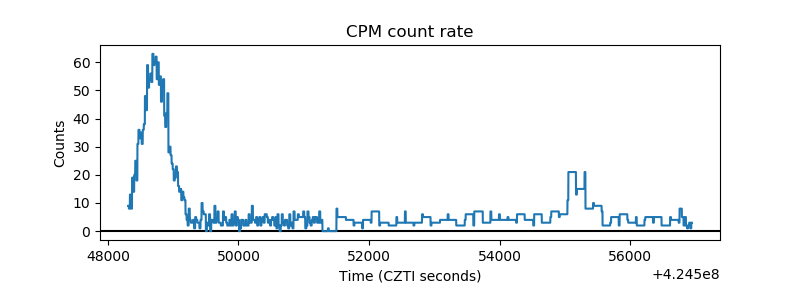 |
| CZT Counter | 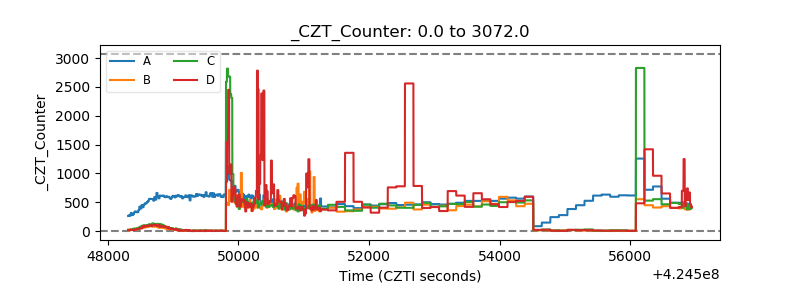 |
| +2.5 Volts monitor | 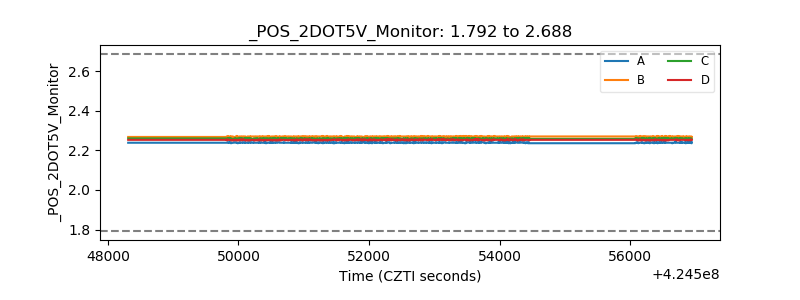 |
| +5 Volts monitor | 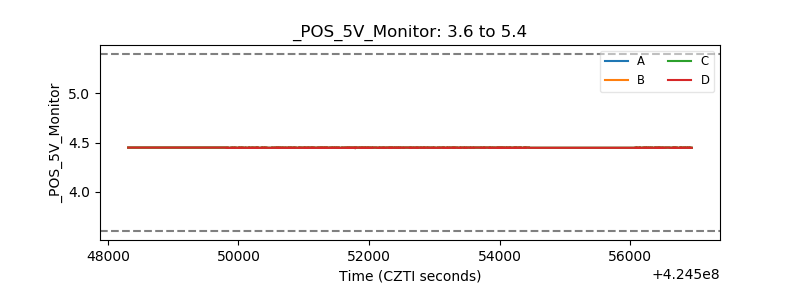 |
| _ROLL_ROT | 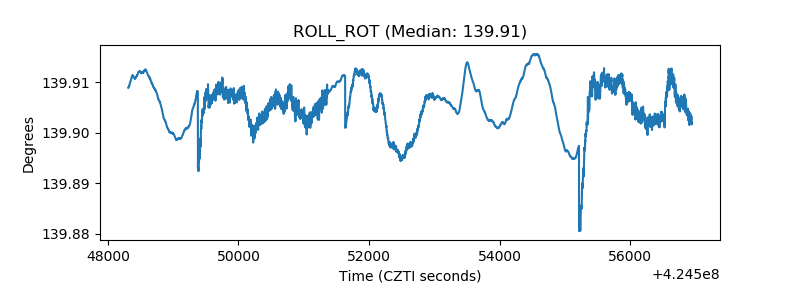 |
| _Roll_DEC | 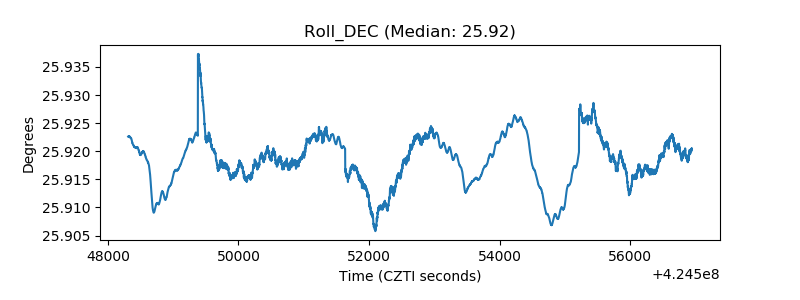 |
| _Roll_RA | 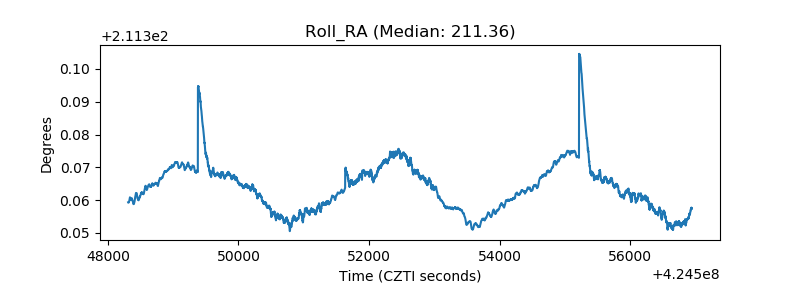 |
| Veto Counter | 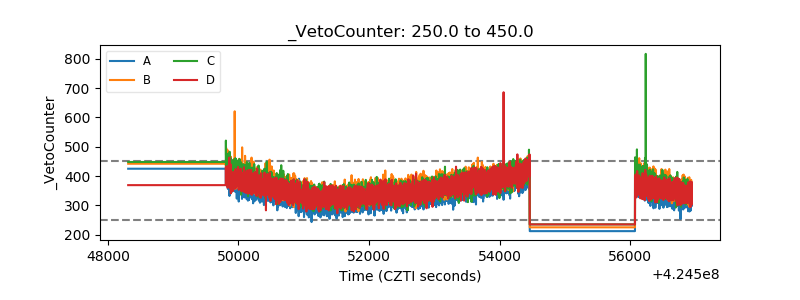 |