| Param | Original file | Final file |
|---|---|---|
| Filename | modeM0/AS1A12_077T12_9000005692_41715cztM0_level2.fits | modeM0/AS1A12_077T12_9000005692_41715cztM0_level2_quad_clean.evt |
| Size (bytes) | 1,294,061,760 | 328,383,360 |
| Size | 1.2 GB | 313.2 MB |
| Events in quadrant A | 10,869,499 | 2,241,176 |
| Events in quadrant B | 9,550,178 | 2,298,226 |
| Events in quadrant C | 10,928,648 | 2,096,292 |
| Events in quadrant D | 14,967,378 | 1,895,275 |
| Mode M9 | |||
|---|---|---|---|
| Quadrant | BADHDUFLAG | Total packets | Discarded packets |
| A | 0 | 69 | 0 |
| B | 0 | 69 | 0 |
| C | 0 | 69 | 0 |
| D | 0 | 69 | 0 |
| Mode M0 | |||
|---|---|---|---|
| Quadrant | BADHDUFLAG | Total packets | Discarded packets |
| A | 0 | 44307 | 6 |
| B | 0 | 42604 | 5 |
| C | 0 | 45176 | 5 |
| D | 0 | 58954 | 5 |
| Mode SS | |||
|---|---|---|---|
| Quadrant | BADHDUFLAG | Total packets | Discarded packets |
| A | 0 | 420 | 0 |
| B | 0 | 420 | 0 |
| C | 0 | 420 | 0 |
| D | 0 | 420 | 0 |
| Quadrant | Total seconds | Saturated seconds | Saturation percentage |
|---|---|---|---|
| A | 20496 | 62 | 0.302498% |
| B | 20497 | 52 | 0.253696% |
| C | 20497 | 490 | 2.390594% |
| D | 20497 | 1038 | 5.064156% |
Noise dominated data is calculated using 1-second bins in cleaned event files. If a bin has >2000 counts, and if more than 50% of those come from <1% of pixels, then it is considered to be noise-dominated and hence unusable.
| Quadrant | # 1 sec bins | Bins with >0 counts | Bins with >2000 counts | High rate bins dominated by noise | Noise dominated (total time) | Noise dominated (detector-on time) | Marked lightcurve |
|---|---|---|---|---|---|---|---|
| A | 27363 | 20501 | 30 | 30 | 0.11% | 0.15% | 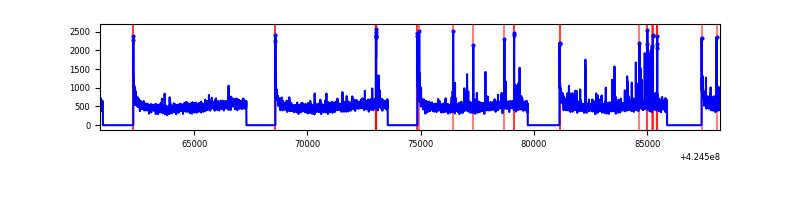 |
| B | 27364 | 20502 | 19 | 19 | 0.07% | 0.09% | 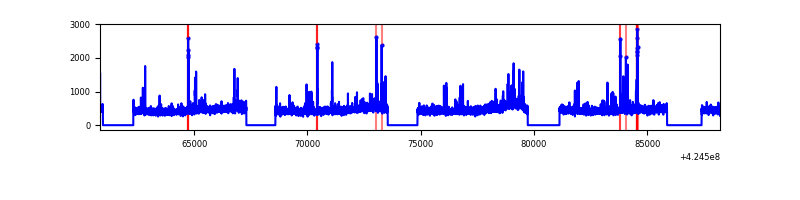 |
| C | 27364 | 20502 | 494 | 494 | 1.81% | 2.41% | 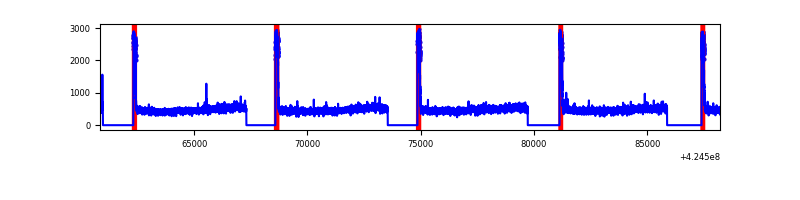 |
| D | 27364 | 20502 | 1013 | 1013 | 3.70% | 4.94% | 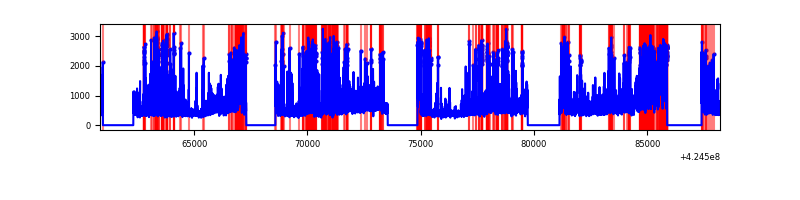 |
Top three noisy pixels from each quadrant. If the there are fewer than three noisy pixels in the level2.evt file, extra rows are filled as -1
| Pixel properties | Quadrant properties | ||||||
|---|---|---|---|---|---|---|---|
| Quadrant | DetID | PixID | Counts | Sigma | Mean | Median | Sigma |
| A | 10 | 83 | 1762033 | 3770.18 | 2294 | 2251 | 466.8 |
| A | 2 | 79 | 211851 | 449.05 | 2294 | 2251 | 466.8 |
| A | 13 | 254 | 28757 | 56.79 | 2294 | 2251 | 466.8 |
| B | 0 | 245 | 221626 | 495.54 | 2272 | 2205 | 442.8 |
| B | 7 | 202 | 114494 | 253.59 | 2272 | 2205 | 442.8 |
| B | 15 | 35 | 97762 | 215.81 | 2272 | 2205 | 442.8 |
| C | 0 | 10 | 1487472 | 2888.88 | 2206 | 2223 | 514.1 |
| C | 15 | 214 | 821216 | 1592.98 | 2206 | 2223 | 514.1 |
| C | 13 | 61 | 14687 | 24.24 | 2206 | 2223 | 514.1 |
| D | 13 | 249 | 1915184 | 3612.25 | 2184 | 2127 | 529.6 |
| D | 12 | 79 | 1627015 | 3068.12 | 2184 | 2127 | 529.6 |
| D | 1 | 47 | 1358034 | 2560.23 | 2184 | 2127 | 529.6 |
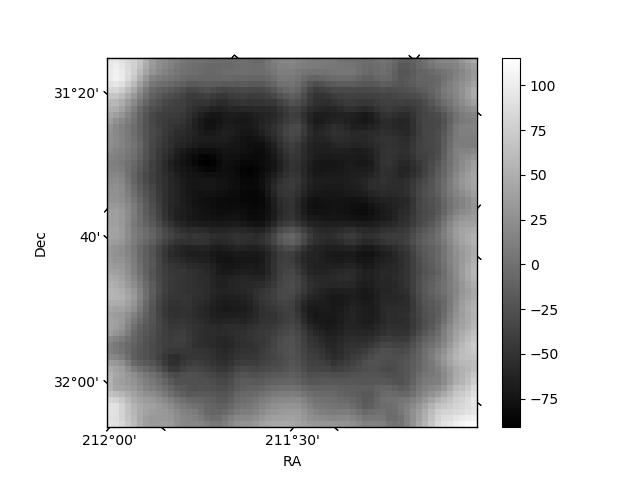
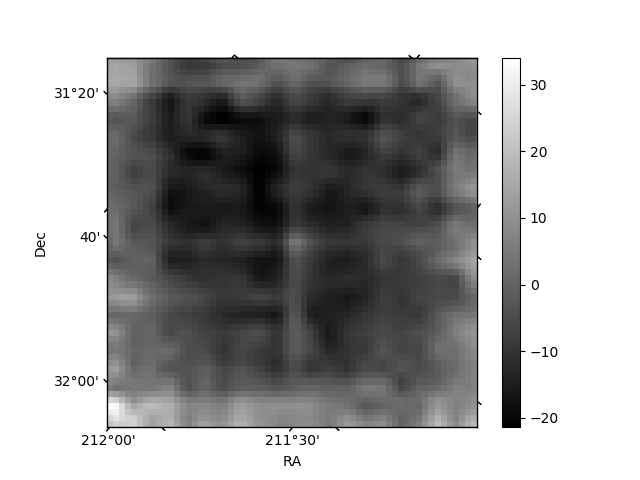
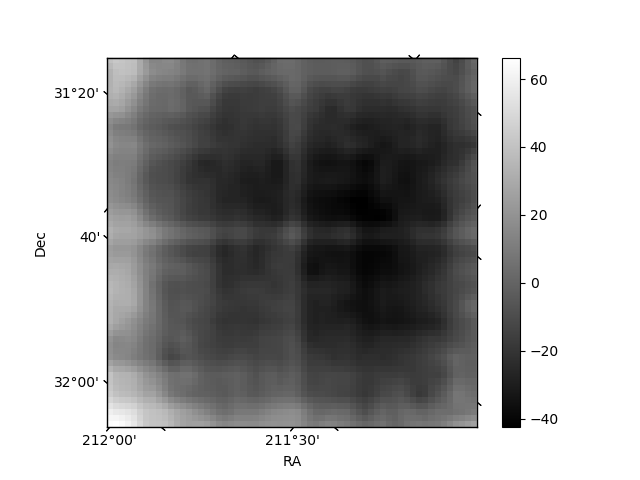
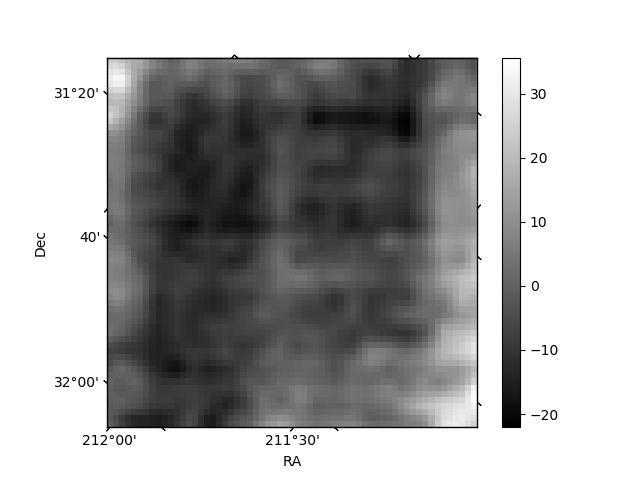
Histogram calculated using DETX and DETY for each event in the final _common_clean file
| Quadrant A | 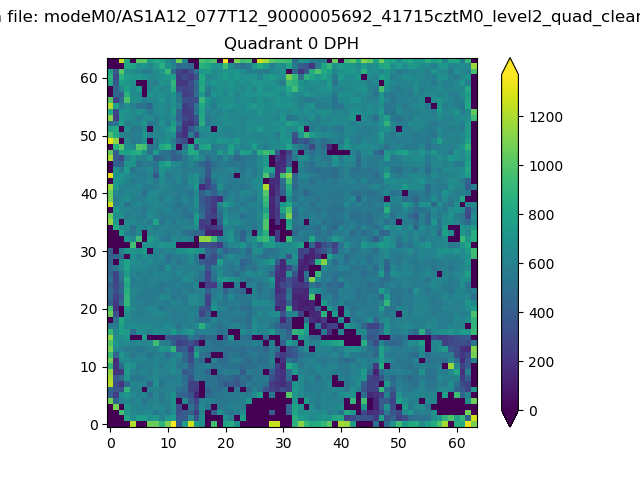 |
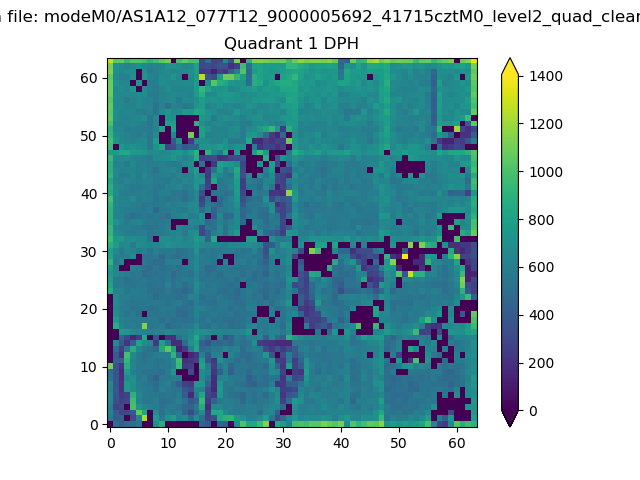 |
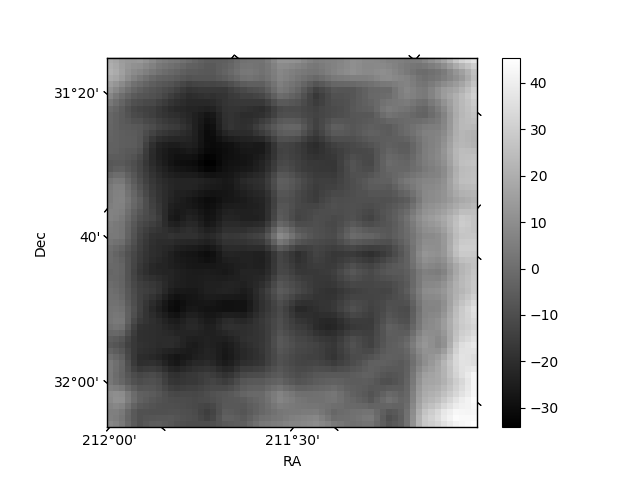
Quadrant B |
|---|---|---|---|
| Quadrant D | 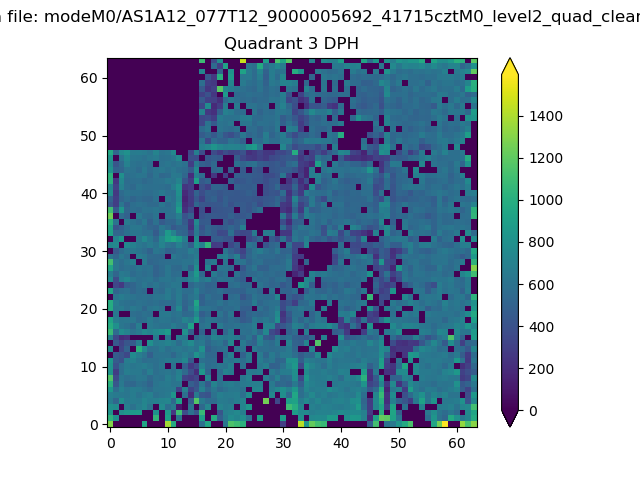 |
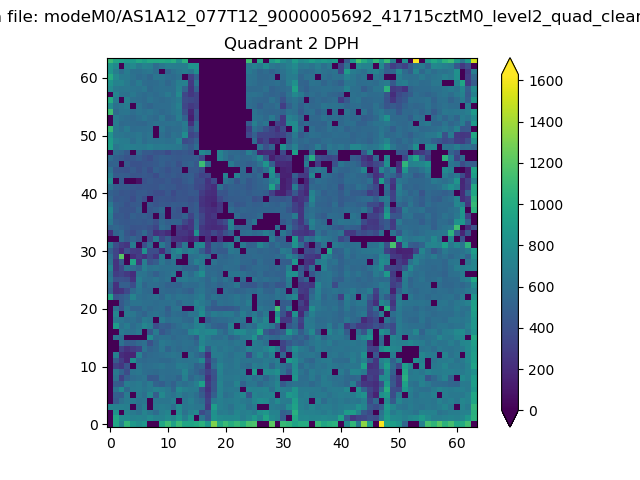 |
Quadrant C |
| Plot type | Count rate plots | Images |
|---|---|---|
| Comparison with Poisson distribution Blue bars denote a histogram of data divided into 1 sec bins. Red curve is a Poisson curve with rate = median count rate of data. |
 |
 |
| Quadrant-wise count rates Data is divided into 100 sec bins |
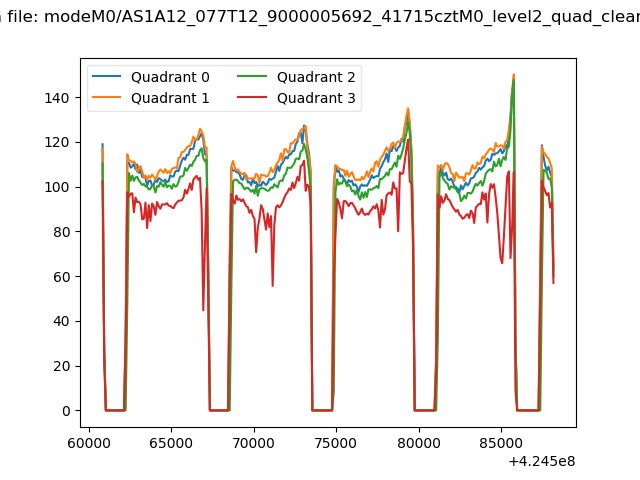 |
|
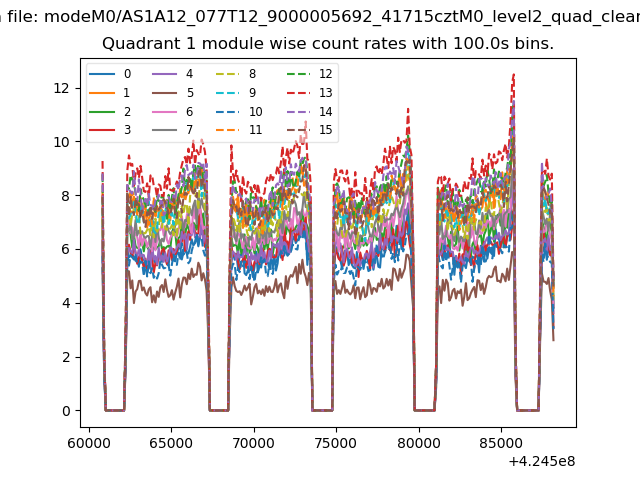
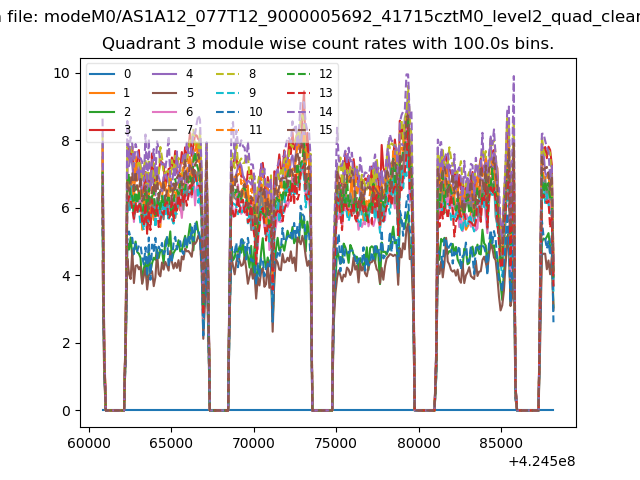
| Module-wise count rates for Quadrant A Data is divided into 100 sec bins |
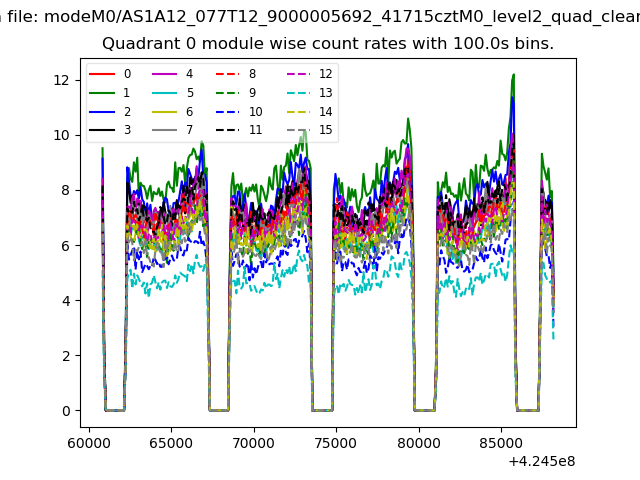 |
 |
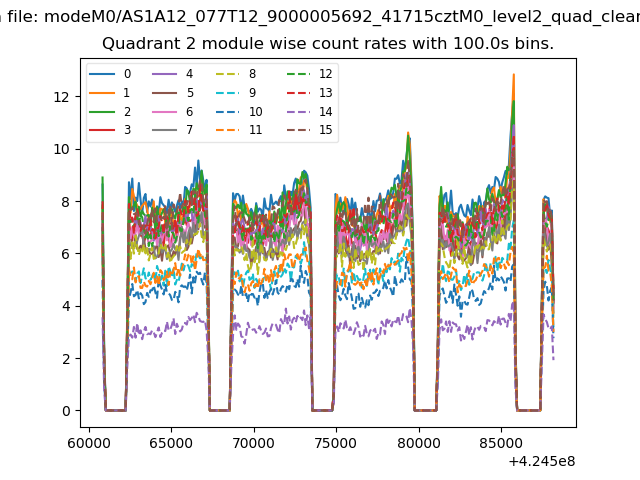
| Module-wise count rates for Quadrant B Data is divided into 100 sec bins |
 |
 |
| Module-wise count rates for Quadrant C Data is divided into 100 sec bins |
 |
 |
| Module-wise count rates for Quadrant D Data is divided into 100 sec bins |
 |
 |
| Parameter | Plot |
|---|---|
| CZT HV Monitor | 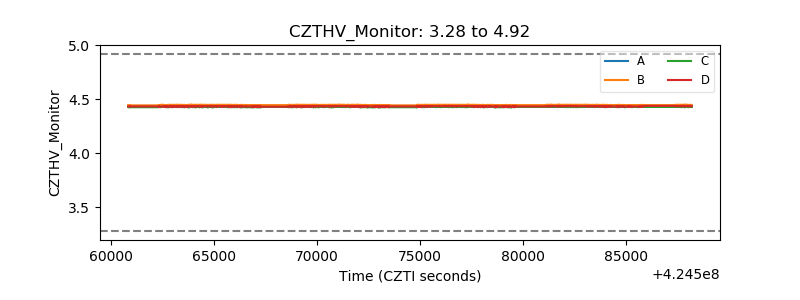 |
| D_VDD | 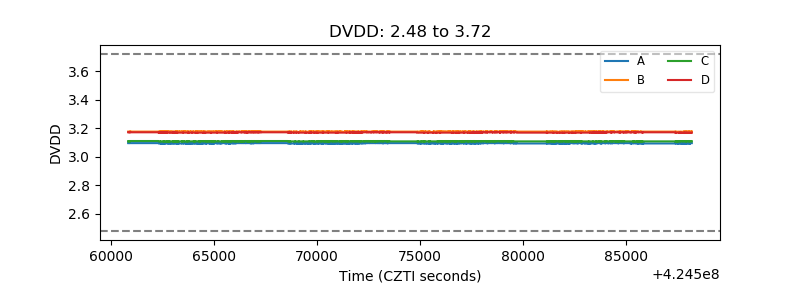 |
| Temperature 1 | 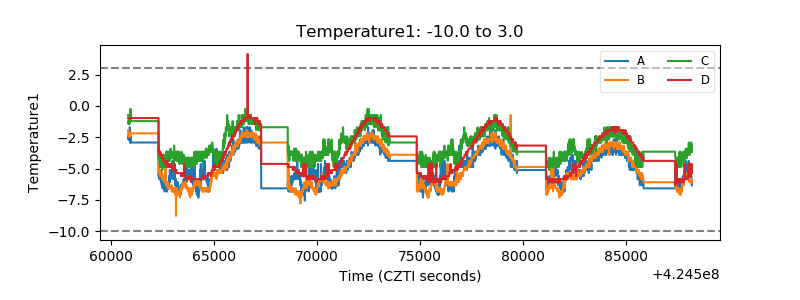 |
| Veto HV Monitor | 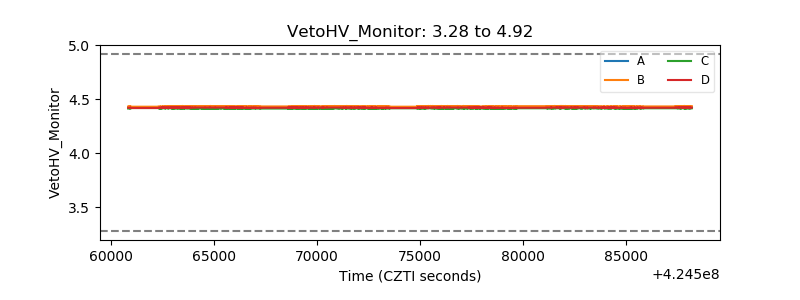 |
| Veto LLD | 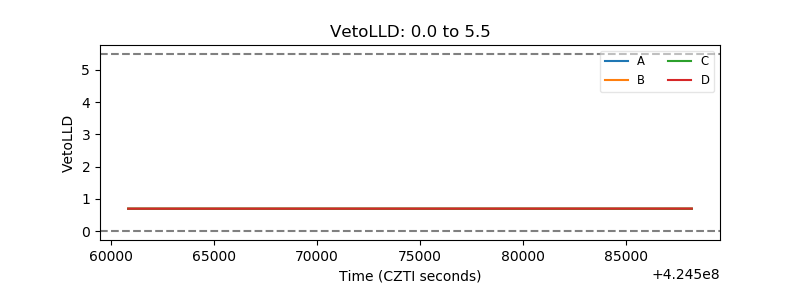 |
| Alpha Counter | 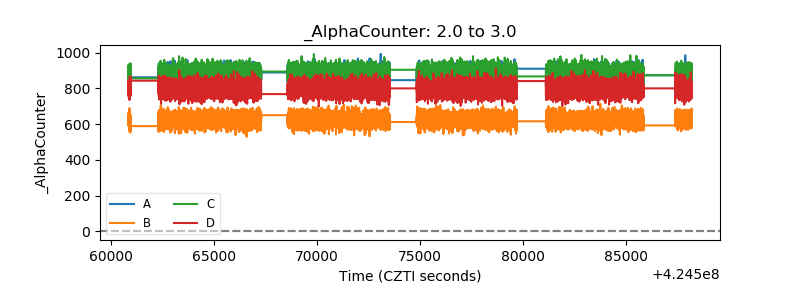 |
| _CPM_Rate | 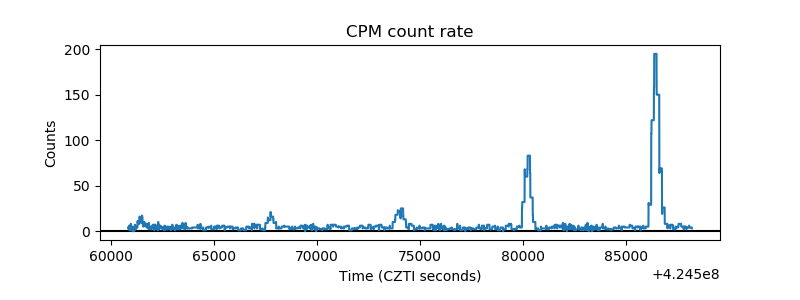 |
| CZT Counter | 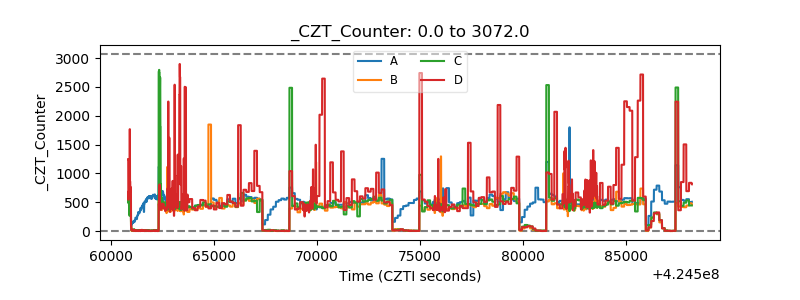 |
| +2.5 Volts monitor | 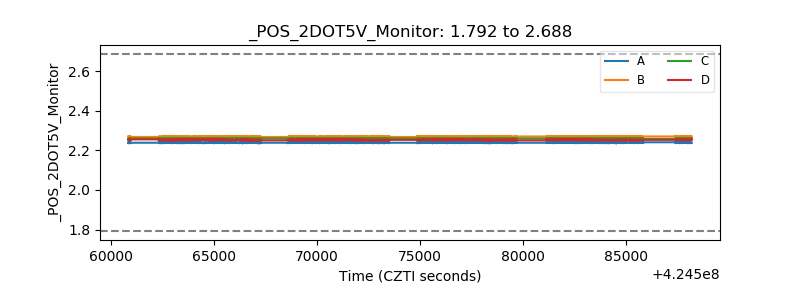 |
| +5 Volts monitor | 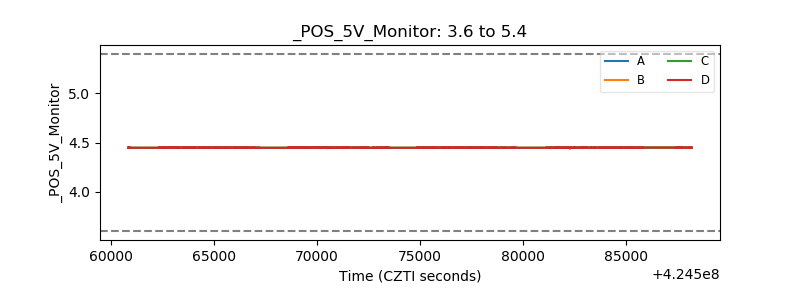 |
| _ROLL_ROT | 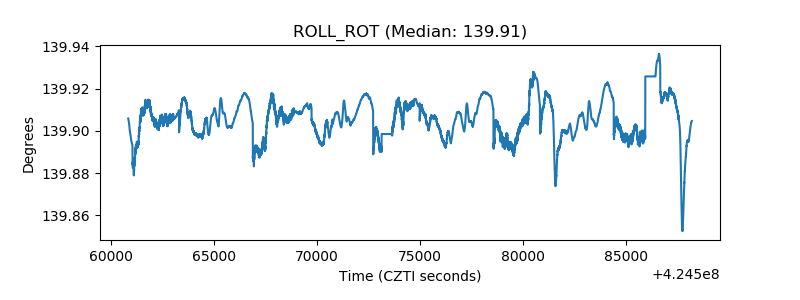 |
| _Roll_DEC |  |
| _Roll_RA | 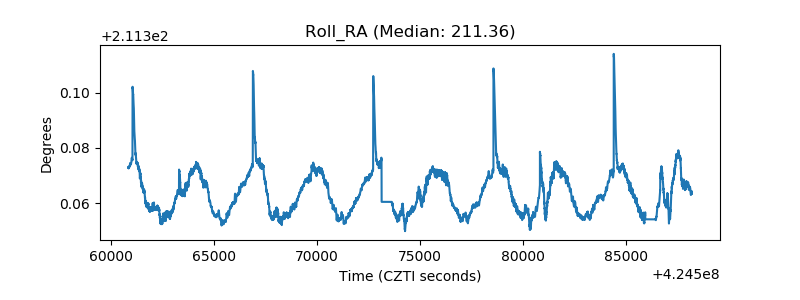 |
| Veto Counter | 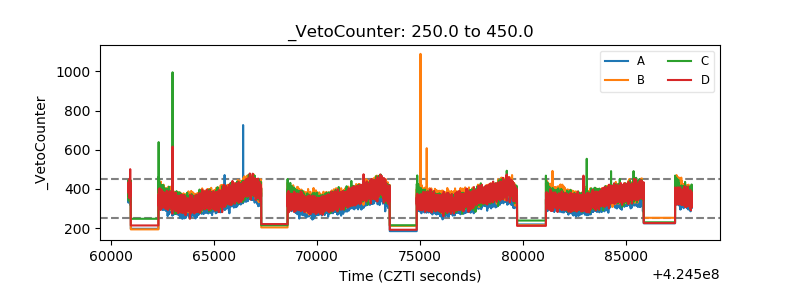 |