| Param | Original file | Final file |
|---|---|---|
| Filename | modeM0/AS1A12_077T12_9000005692_41716cztM0_level2.fits | modeM0/AS1A12_077T12_9000005692_41716cztM0_level2_quad_clean.evt |
| Size (bytes) | 386,838,720 | 89,962,560 |
| Size | 368.9 MB | 85.8 MB |
| Events in quadrant A | 2,983,755 | 612,798 |
| Events in quadrant B | 2,472,694 | 630,639 |
| Events in quadrant C | 3,151,880 | 570,051 |
| Events in quadrant D | 5,283,274 | 525,465 |
| Mode M9 | |||
|---|---|---|---|
| Quadrant | BADHDUFLAG | Total packets | Discarded packets |
| A | 0 | 29 | 0 |
| B | 0 | 30 | 0 |
| C | 0 | 30 | 0 |
| D | 0 | 30 | 0 |
| Mode M0 | |||
|---|---|---|---|
| Quadrant | BADHDUFLAG | Total packets | Discarded packets |
| A | 0 | 12003 | 2 |
| B | 0 | 11093 | 2 |
| C | 0 | 12648 | 2 |
| D | 0 | 19581 | 2 |
| Mode SS | |||
|---|---|---|---|
| Quadrant | BADHDUFLAG | Total packets | Discarded packets |
| A | 0 | 112 | 0 |
| B | 0 | 112 | 0 |
| C | 0 | 112 | 0 |
| D | 0 | 112 | 0 |
| Quadrant | Total seconds | Saturated seconds | Saturation percentage |
|---|---|---|---|
| A | 5502 | 15 | 0.272628% |
| B | 5502 | 7 | 0.127226% |
| C | 5501 | 227 | 4.126522% |
| D | 5501 | 383 | 6.962370% |
Noise dominated data is calculated using 1-second bins in cleaned event files. If a bin has >2000 counts, and if more than 50% of those come from <1% of pixels, then it is considered to be noise-dominated and hence unusable.
| Quadrant | # 1 sec bins | Bins with >0 counts | Bins with >2000 counts | High rate bins dominated by noise | Noise dominated (total time) | Noise dominated (detector-on time) | Marked lightcurve |
|---|---|---|---|---|---|---|---|
| A | 7175 | 5503 | 6 | 6 | 0.08% | 0.11% | 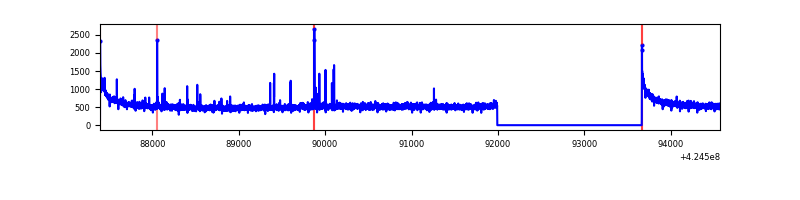 |
| B | 7175 | 5503 | 2 | 2 | 0.03% | 0.04% | 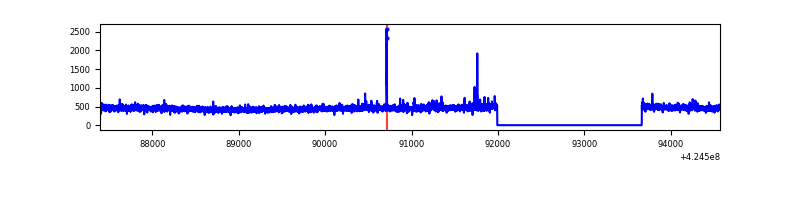 |
| C | 7174 | 5502 | 218 | 218 | 3.04% | 3.96% | 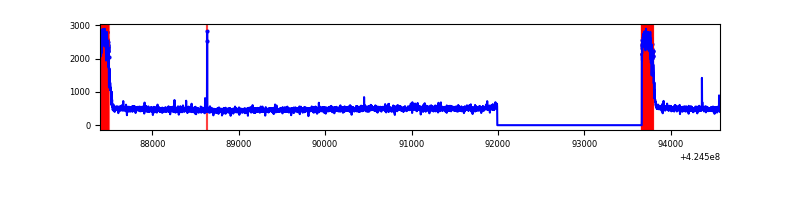 |
| D | 7174 | 5502 | 412 | 412 | 5.74% | 7.49% | 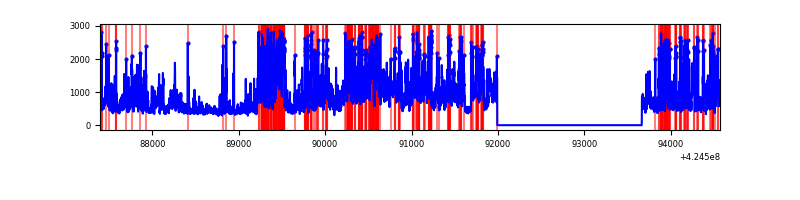 |
Top three noisy pixels from each quadrant. If the there are fewer than three noisy pixels in the level2.evt file, extra rows are filled as -1
| Pixel properties | Quadrant properties | ||||||
|---|---|---|---|---|---|---|---|
| Quadrant | DetID | PixID | Counts | Sigma | Mean | Median | Sigma |
| A | 10 | 83 | 533722 | 4154.69 | 622 | 609 | 128.3 |
| A | 2 | 79 | 38761 | 297.33 | 622 | 609 | 128.3 |
| A | 13 | 254 | 8109 | 58.45 | 622 | 609 | 128.3 |
| B | 0 | 245 | 23092 | 185.46 | 616 | 598 | 121.3 |
| B | 12 | 111 | 15675 | 124.3 | 616 | 598 | 121.3 |
| B | 15 | 35 | 14587 | 115.33 | 616 | 598 | 121.3 |
| C | 0 | 10 | 611070 | 4385.85 | 588 | 591 | 139.2 |
| C | 15 | 214 | 224429 | 1608.11 | 588 | 591 | 139.2 |
| C | 0 | 207 | 8924 | 59.87 | 588 | 591 | 139.2 |
| D | 12 | 79 | 1666440 | 11559.8 | 590 | 573 | 144.1 |
| D | 2 | 249 | 392109 | 2716.95 | 590 | 573 | 144.1 |
| D | 13 | 249 | 331409 | 2295.74 | 590 | 573 | 144.1 |
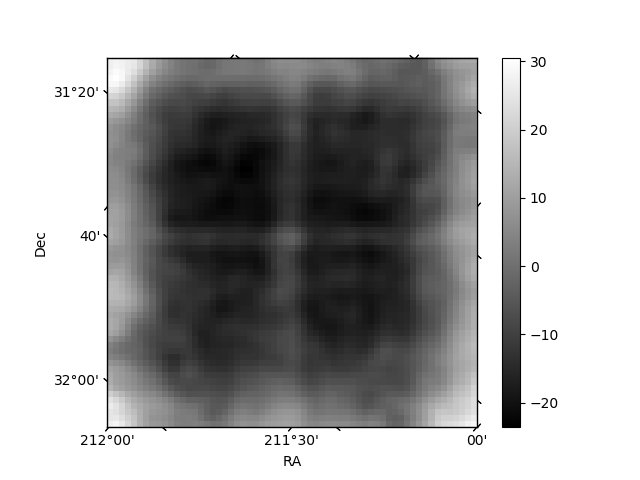
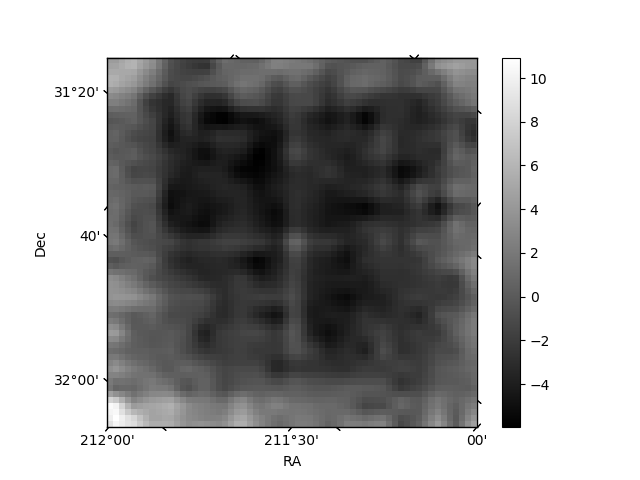
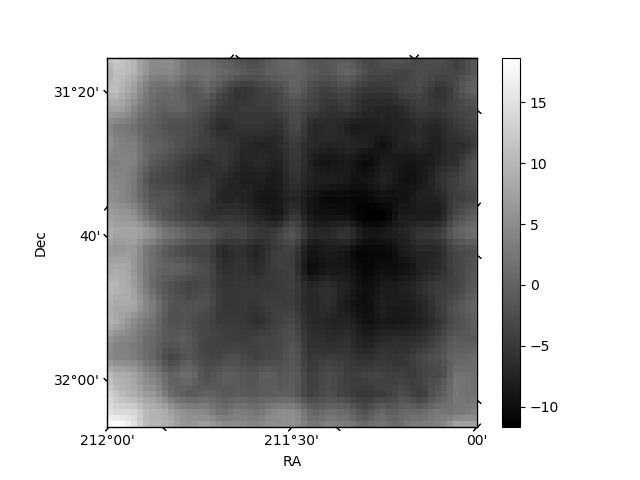
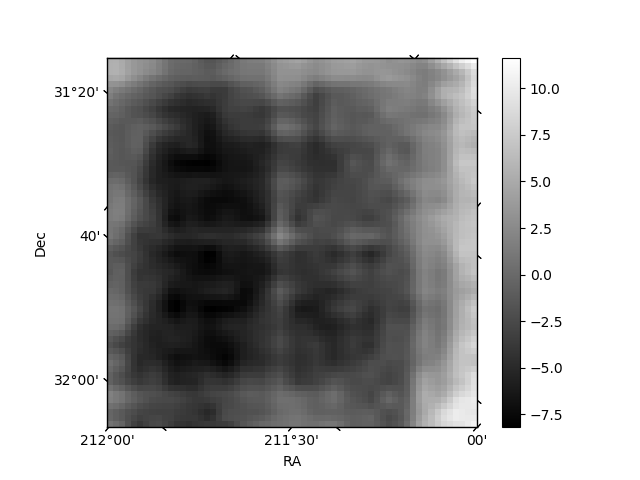
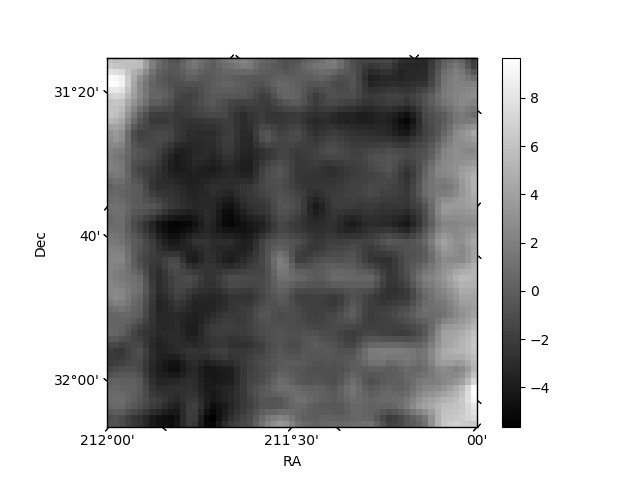
Histogram calculated using DETX and DETY for each event in the final _common_clean file
| Quadrant A | 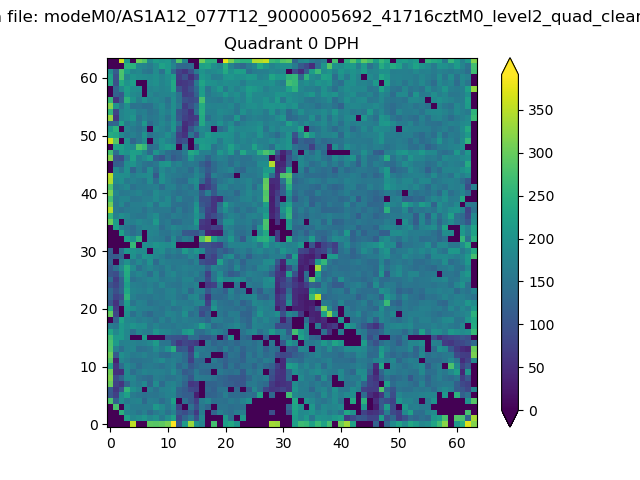 |
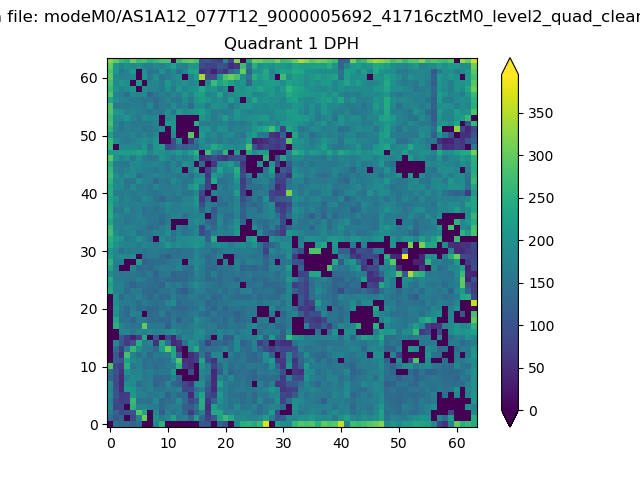 |
Quadrant B |
|---|---|---|---|
| Quadrant D | 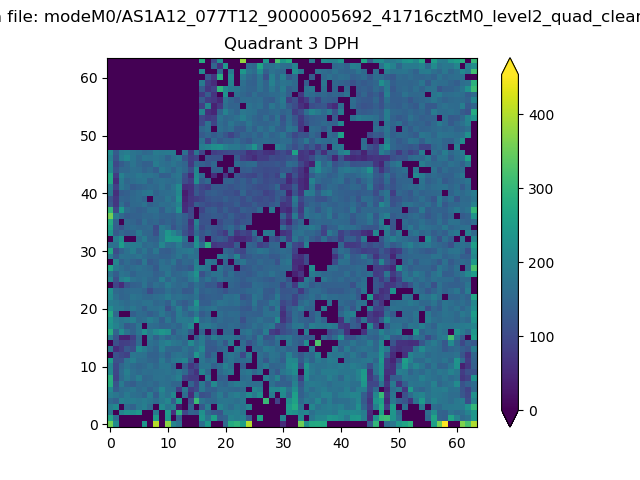 |
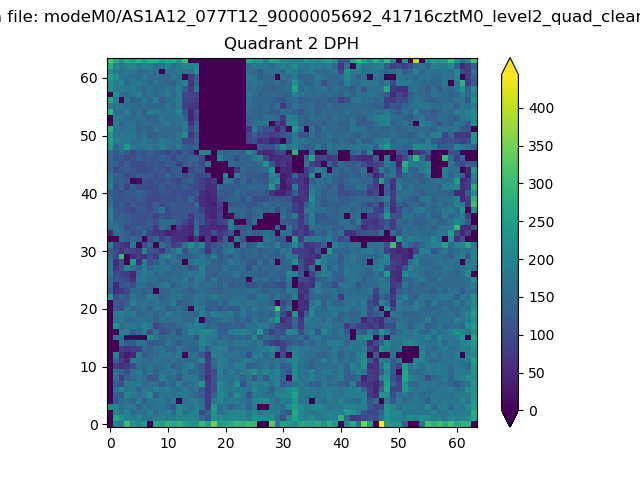 |
Quadrant C |
| Plot type | Count rate plots | Images |
|---|---|---|
| Comparison with Poisson distribution Blue bars denote a histogram of data divided into 1 sec bins. Red curve is a Poisson curve with rate = median count rate of data. |
 |
 |
| Quadrant-wise count rates Data is divided into 100 sec bins |
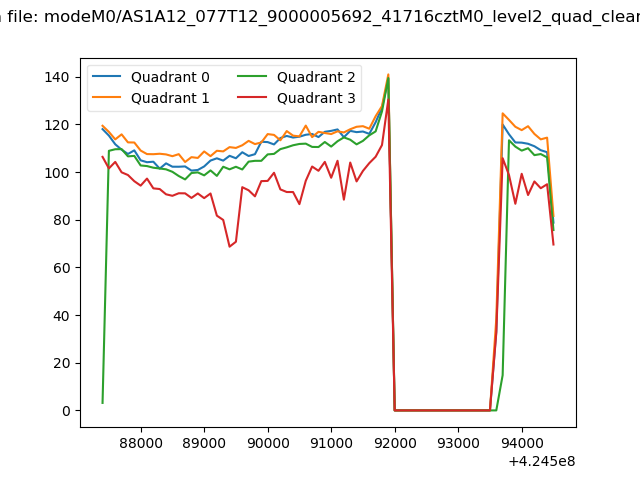 |
|
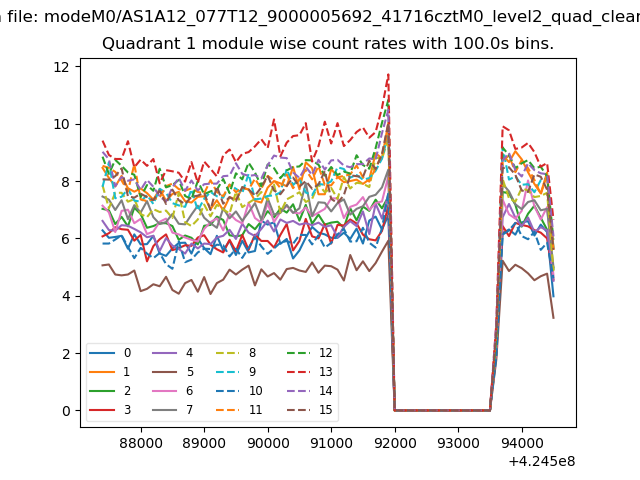
| Module-wise count rates for Quadrant A Data is divided into 100 sec bins |
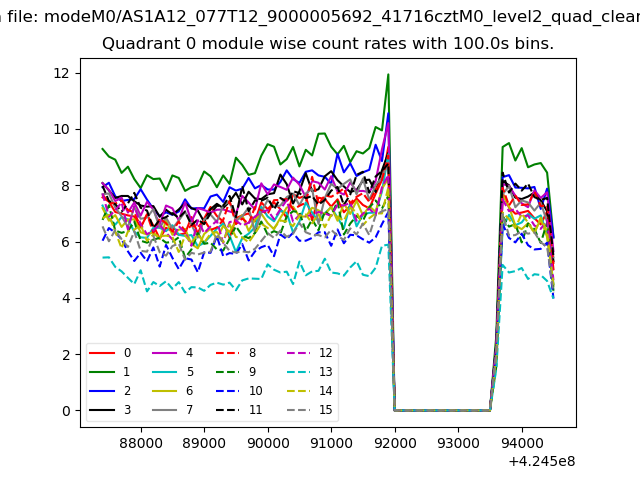 |
 |
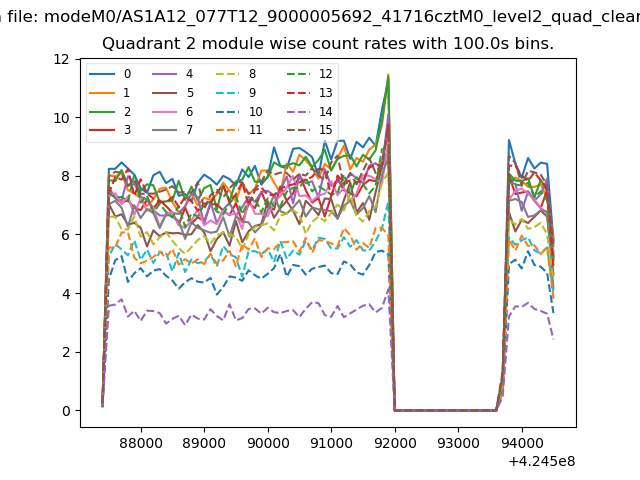
| Module-wise count rates for Quadrant B Data is divided into 100 sec bins |
 |
 |
| Module-wise count rates for Quadrant C Data is divided into 100 sec bins |
 |
 |
| Module-wise count rates for Quadrant D Data is divided into 100 sec bins |
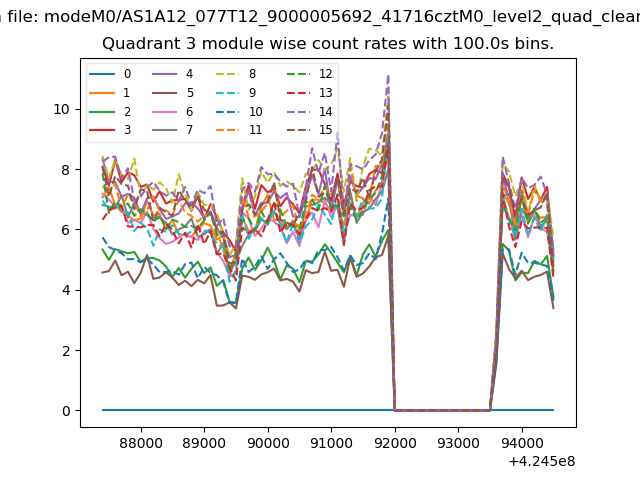 |
 |
| Parameter | Plot |
|---|---|
| CZT HV Monitor | 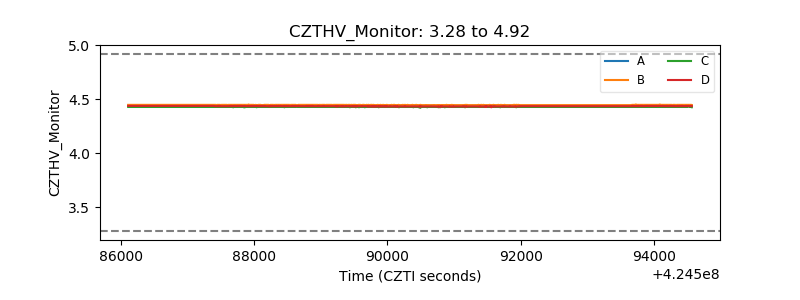 |
| D_VDD | 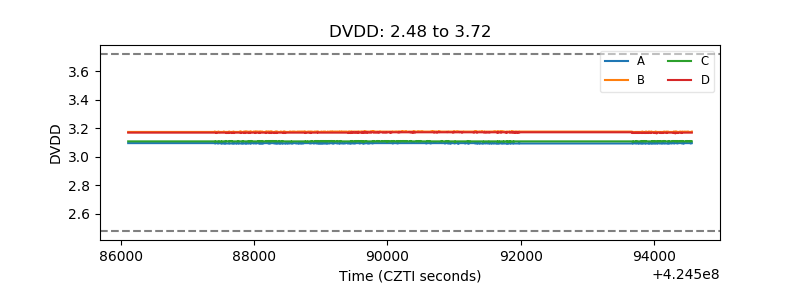 |
| Temperature 1 | 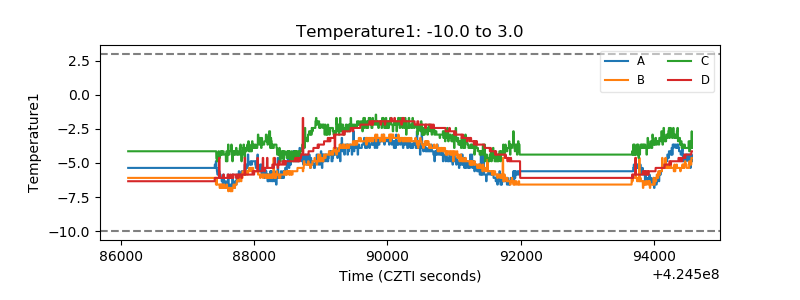 |
| Veto HV Monitor |  |
| Veto LLD | 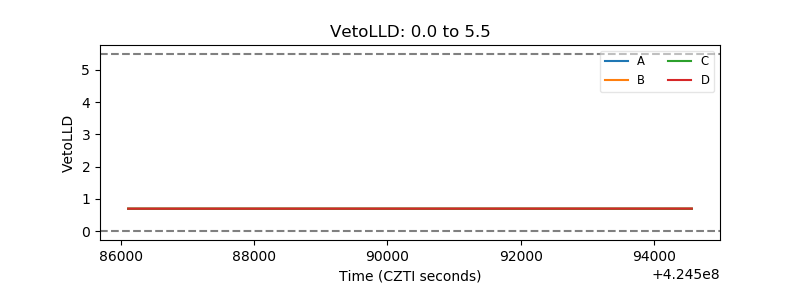 |
| Alpha Counter | 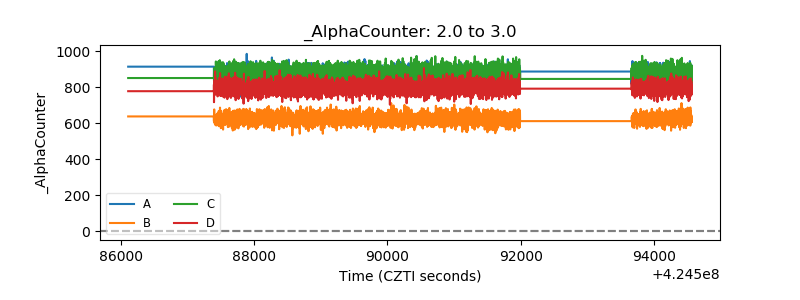 |
| _CPM_Rate | 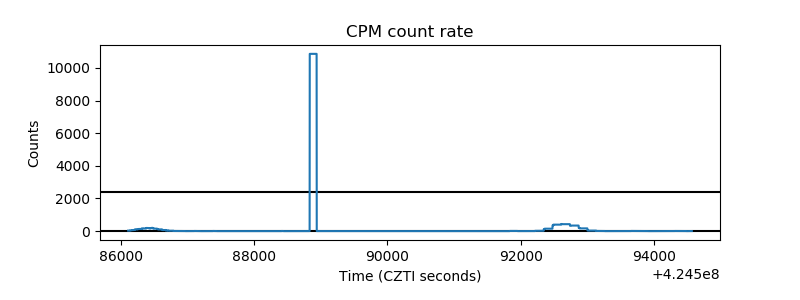 |
| CZT Counter | 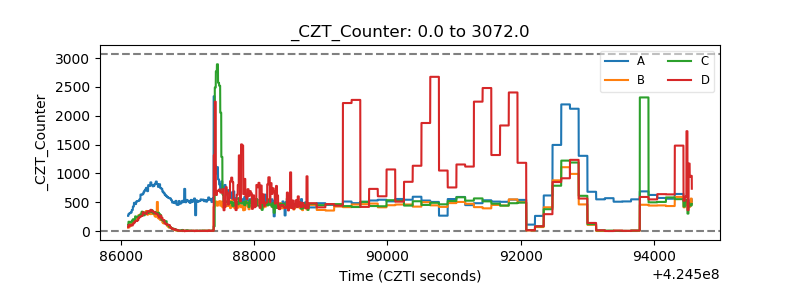 |
| +2.5 Volts monitor | 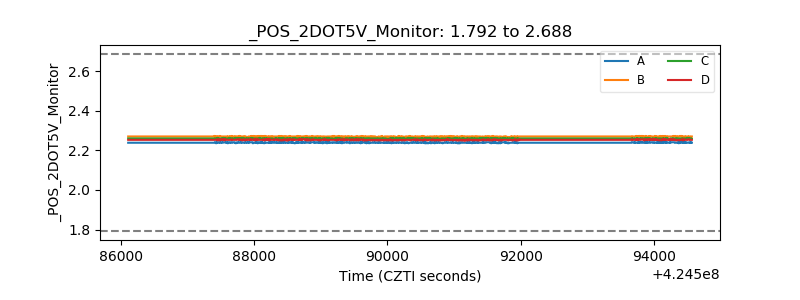 |
| +5 Volts monitor | 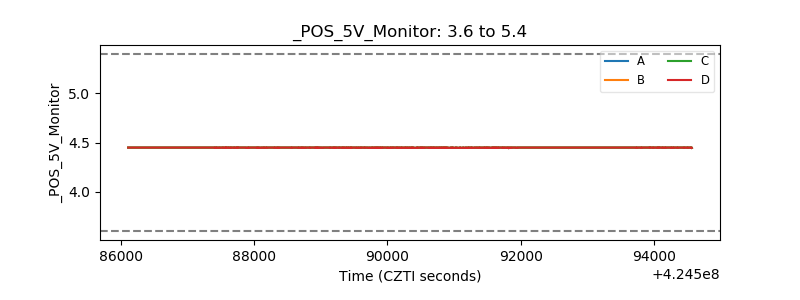 |
| _ROLL_ROT | 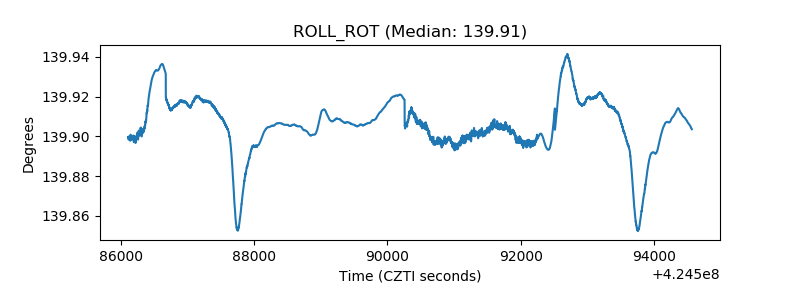 |
| _Roll_DEC | 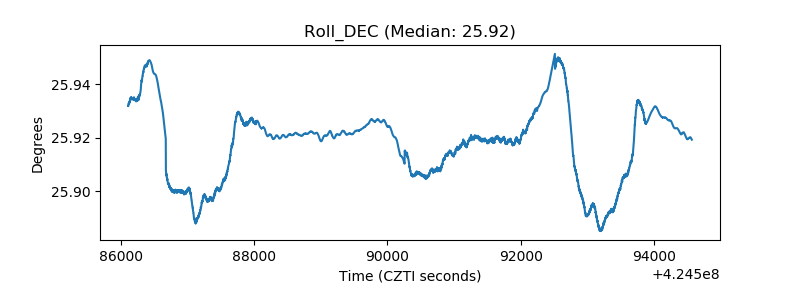 |
| _Roll_RA | 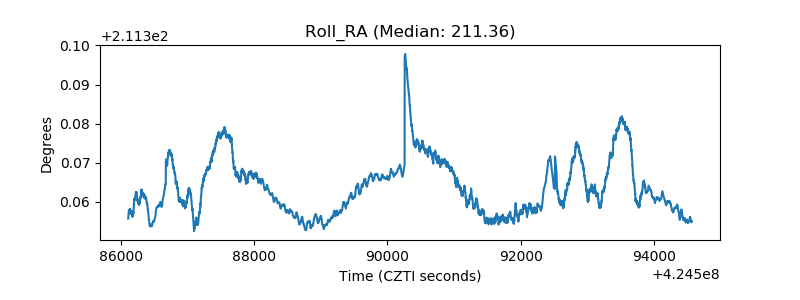 |
| Veto Counter | 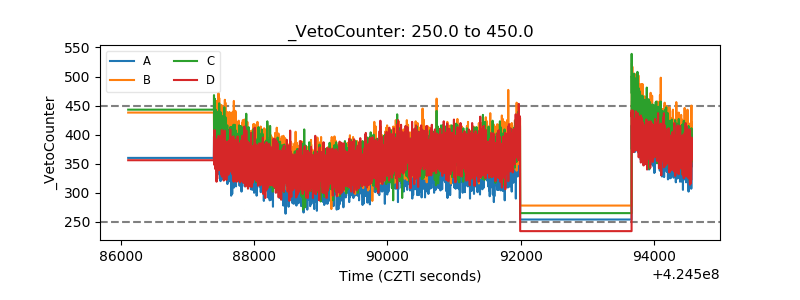 |