| Param | Original file | Final file |
|---|---|---|
| Filename | modeM0/AS1A12_077T12_9000005692_41718cztM0_level2.fits | modeM0/AS1A12_077T12_9000005692_41718cztM0_level2_quad_clean.evt |
| Size (bytes) | 356,875,200 | 88,211,520 |
| Size | 340.3 MB | 84.1 MB |
| Events in quadrant A | 2,880,905 | 604,898 |
| Events in quadrant B | 2,395,147 | 623,544 |
| Events in quadrant C | 3,101,904 | 556,813 |
| Events in quadrant D | 4,419,761 | 514,357 |
| Mode M9 | |||
|---|---|---|---|
| Quadrant | BADHDUFLAG | Total packets | Discarded packets |
| A | 0 | 25 | 0 |
| B | 0 | 26 | 0 |
| C | 0 | 26 | 0 |
| D | 0 | 26 | 0 |
| Mode M0 | |||
|---|---|---|---|
| Quadrant | BADHDUFLAG | Total packets | Discarded packets |
| A | 0 | 11620 | 2 |
| B | 0 | 10649 | 2 |
| C | 0 | 12348 | 2 |
| D | 0 | 16798 | 2 |
| Mode SS | |||
|---|---|---|---|
| Quadrant | BADHDUFLAG | Total packets | Discarded packets |
| A | 0 | 110 | 0 |
| B | 0 | 110 | 0 |
| C | 0 | 110 | 0 |
| D | 0 | 110 | 0 |
| Quadrant | Total seconds | Saturated seconds | Saturation percentage |
|---|---|---|---|
| A | 5298 | 15 | 0.283126% |
| B | 5298 | 8 | 0.151000% |
| C | 5298 | 246 | 4.643262% |
| D | 5298 | 308 | 5.813515% |
Noise dominated data is calculated using 1-second bins in cleaned event files. If a bin has >2000 counts, and if more than 50% of those come from <1% of pixels, then it is considered to be noise-dominated and hence unusable.
| Quadrant | # 1 sec bins | Bins with >0 counts | Bins with >2000 counts | High rate bins dominated by noise | Noise dominated (total time) | Noise dominated (detector-on time) | Marked lightcurve |
|---|---|---|---|---|---|---|---|
| A | 7091 | 5299 | 3 | 3 | 0.04% | 0.06% | 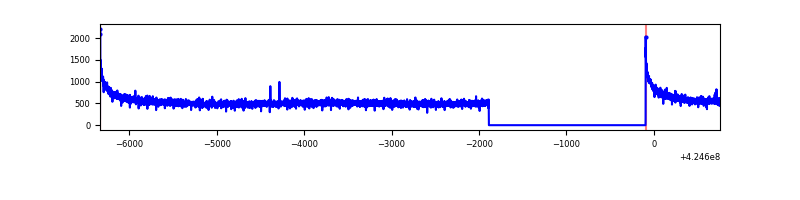 |
| B | 7091 | 5299 | 1 | 1 | 0.01% | 0.02% | 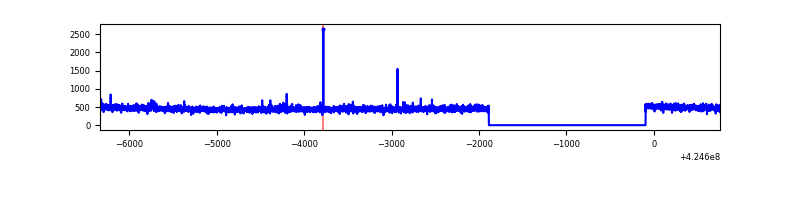 |
| C | 7091 | 5299 | 233 | 233 | 3.29% | 4.40% | 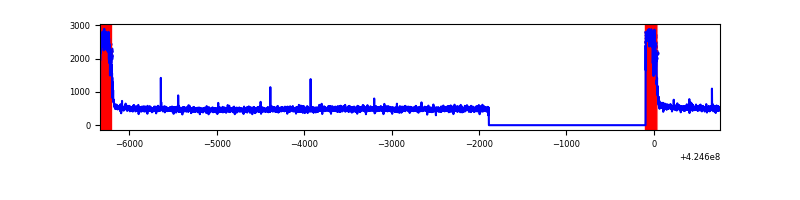 |
| D | 7091 | 5299 | 253 | 253 | 3.57% | 4.77% | 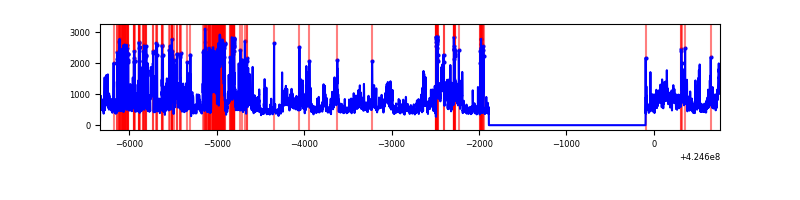 |
Top three noisy pixels from each quadrant. If the there are fewer than three noisy pixels in the level2.evt file, extra rows are filled as -1
| Pixel properties | Quadrant properties | ||||||
|---|---|---|---|---|---|---|---|
| Quadrant | DetID | PixID | Counts | Sigma | Mean | Median | Sigma |
| A | 10 | 83 | 523669 | 4166.02 | 609 | 597 | 125.6 |
| A | 3 | 137 | 6824 | 49.6 | 609 | 597 | 125.6 |
| A | 13 | 254 | 6216 | 44.75 | 609 | 597 | 125.6 |
| B | 12 | 111 | 14966 | 122.66 | 602 | 586 | 117.2 |
| B | 11 | 111 | 14011 | 114.52 | 602 | 586 | 117.2 |
| B | 14 | 111 | 13857 | 113.2 | 602 | 586 | 117.2 |
| C | 0 | 10 | 650735 | 4840.94 | 571 | 573 | 134.3 |
| C | 15 | 214 | 215376 | 1599.37 | 571 | 573 | 134.3 |
| C | 14 | 67 | 8302 | 57.55 | 571 | 573 | 134.3 |
| D | 12 | 79 | 1170129 | 8378.17 | 573 | 557 | 139.6 |
| D | 13 | 249 | 560309 | 4009.75 | 573 | 557 | 139.6 |
| D | 2 | 249 | 428030 | 3062.18 | 573 | 557 | 139.6 |
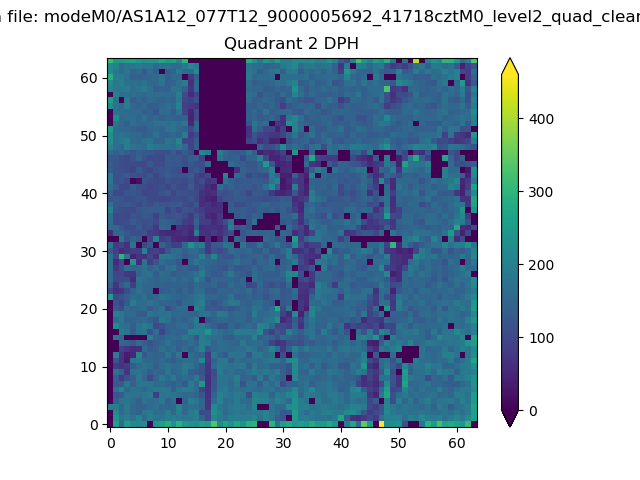
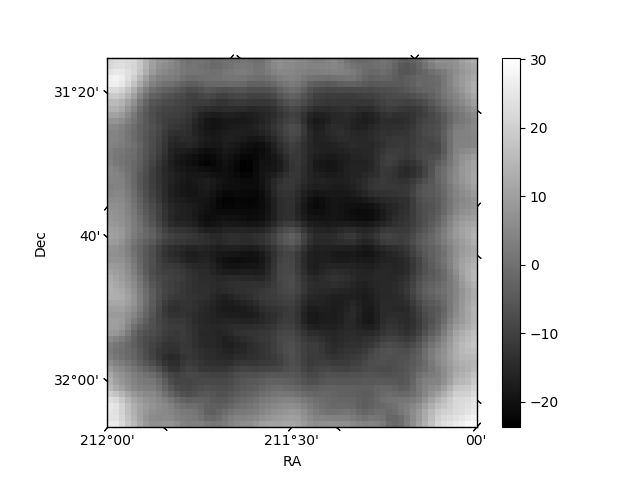
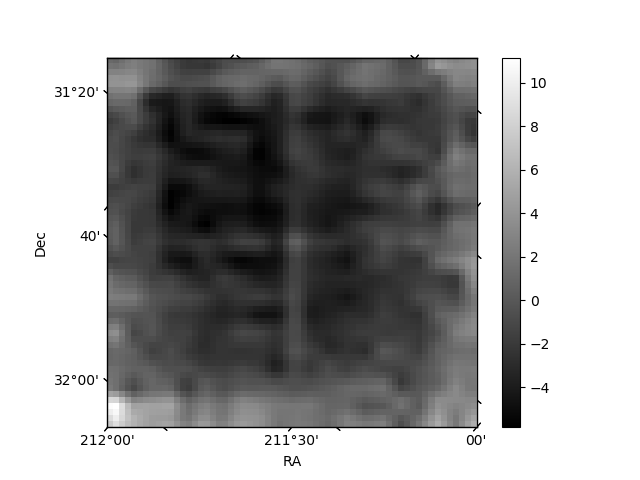
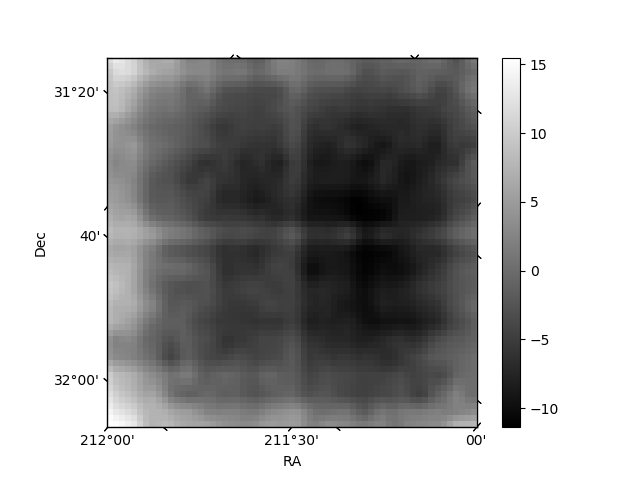
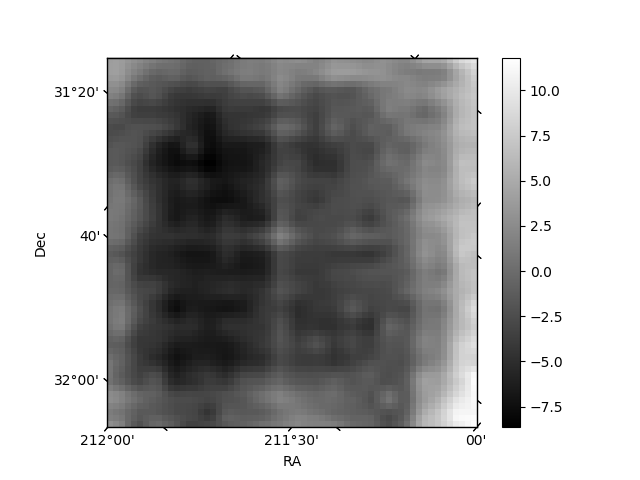
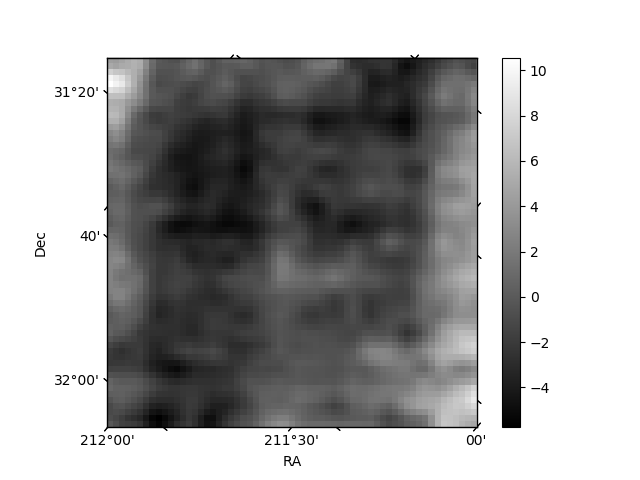
Histogram calculated using DETX and DETY for each event in the final _common_clean file
| Quadrant A | 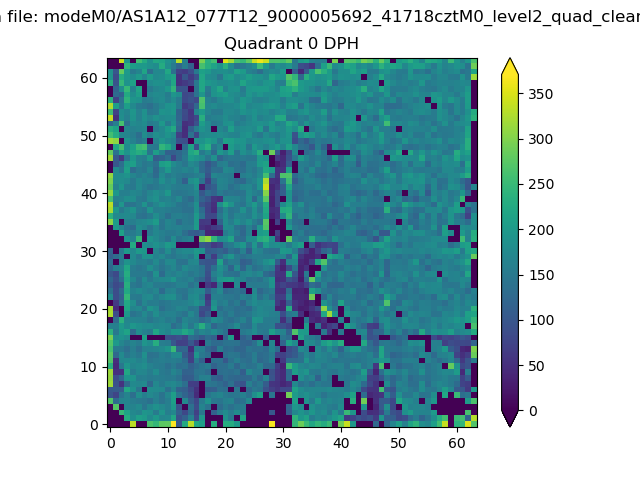 |
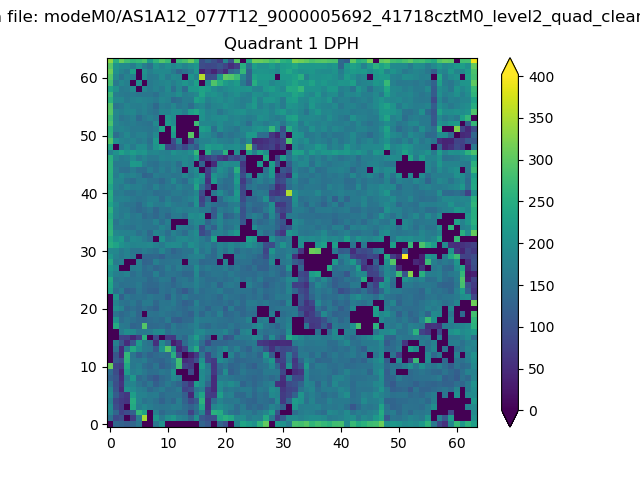 |
Quadrant B |
|---|---|---|---|
| Quadrant D | 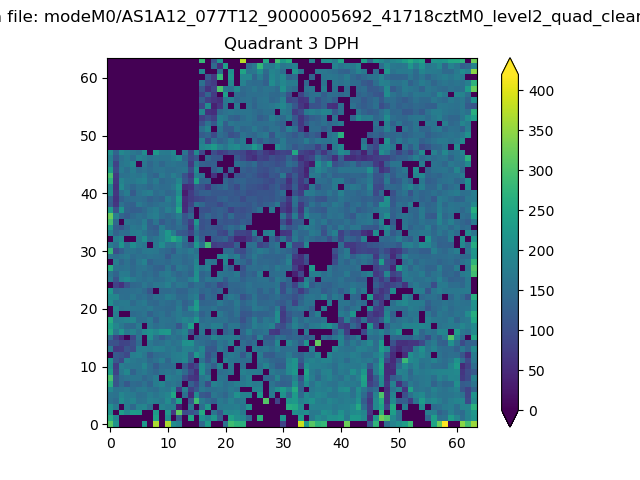 |
 |
Quadrant C |
| Plot type | Count rate plots | Images |
|---|---|---|
| Comparison with Poisson distribution Blue bars denote a histogram of data divided into 1 sec bins. Red curve is a Poisson curve with rate = median count rate of data. |
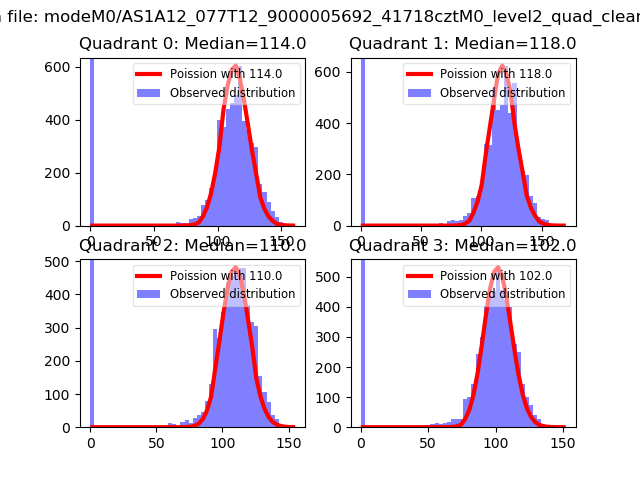 |
 |
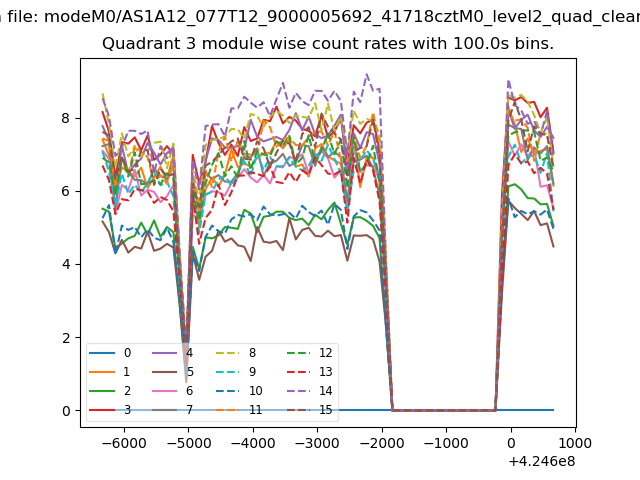
| Quadrant-wise count rates Data is divided into 100 sec bins |
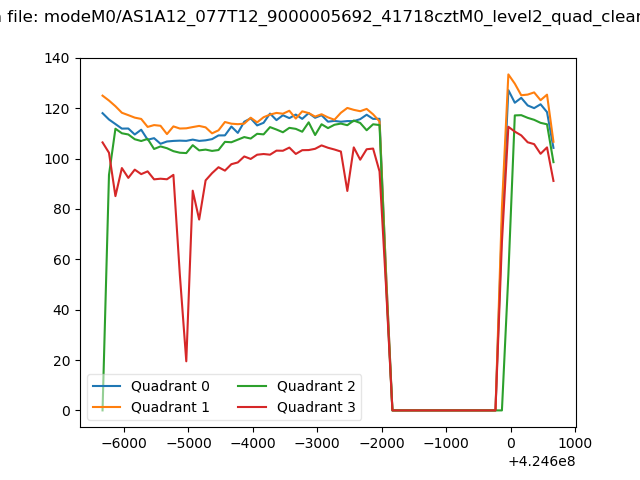 |
|
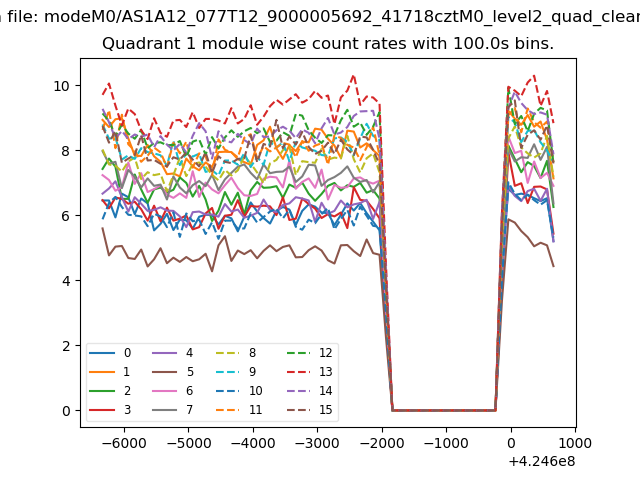
| Module-wise count rates for Quadrant A Data is divided into 100 sec bins |
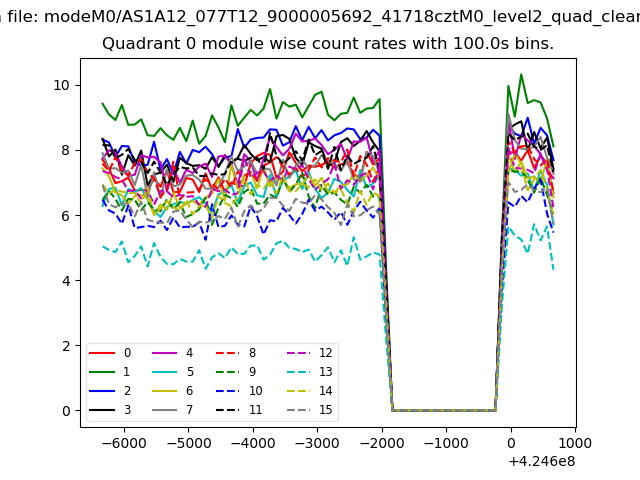 |
 |
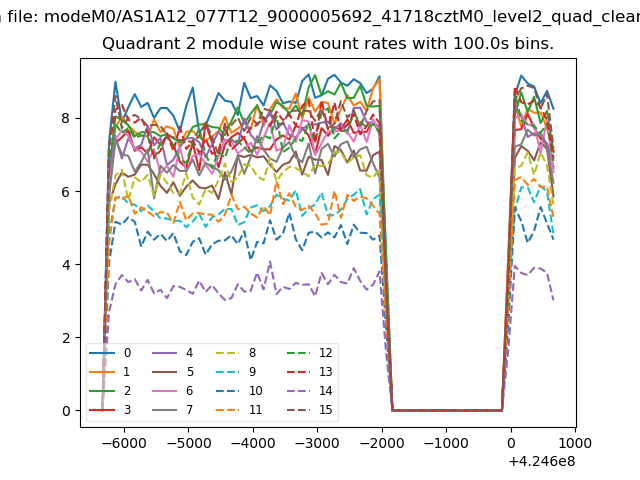
| Module-wise count rates for Quadrant B Data is divided into 100 sec bins |
 |
 |
| Module-wise count rates for Quadrant C Data is divided into 100 sec bins |
 |
 |
| Module-wise count rates for Quadrant D Data is divided into 100 sec bins |
 |
 |
| Parameter | Plot |
|---|---|
| CZT HV Monitor | 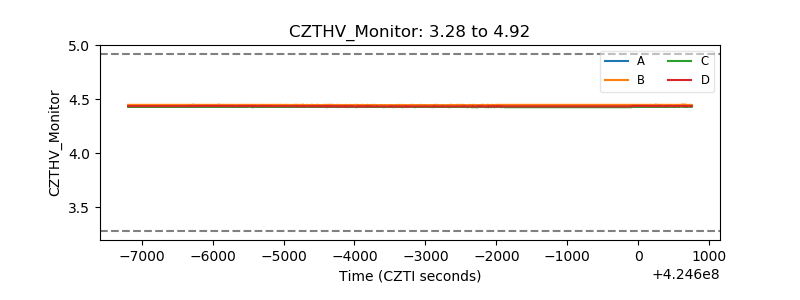 |
| D_VDD | 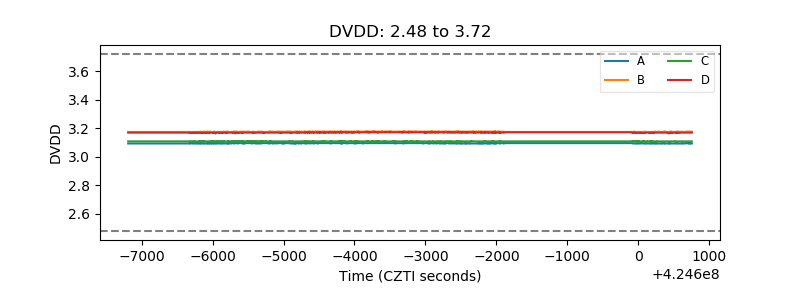 |
| Temperature 1 | 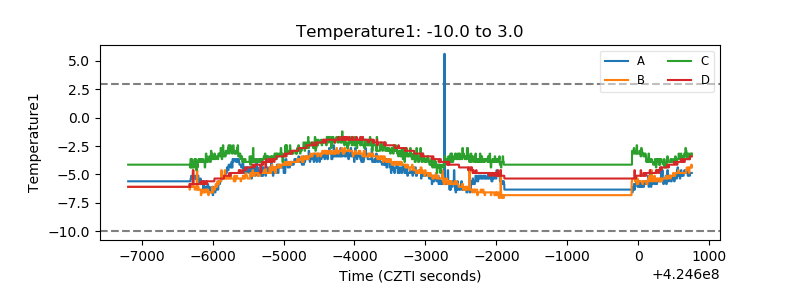 |
| Veto HV Monitor | 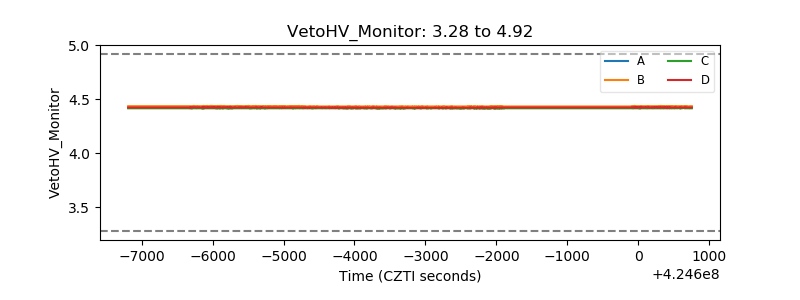 |
| Veto LLD | 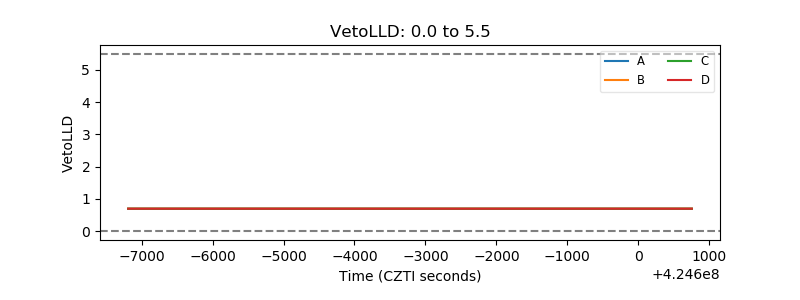 |
| Alpha Counter | 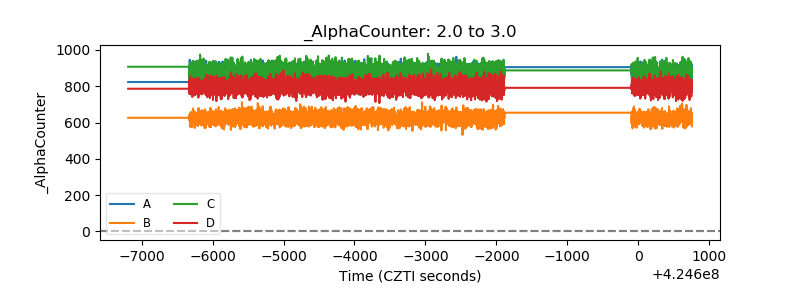 |
| _CPM_Rate | 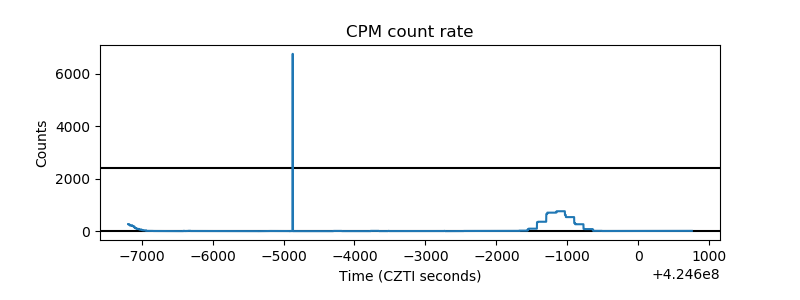 |
| CZT Counter | 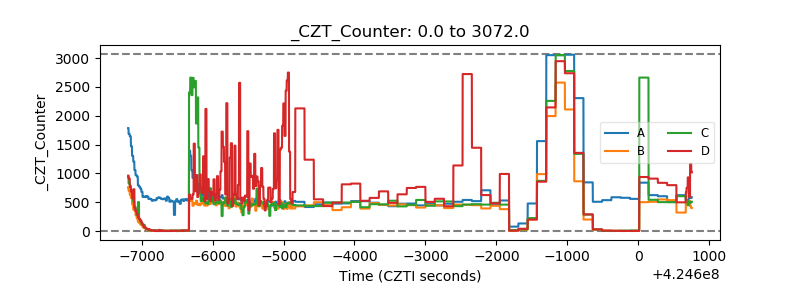 |
| +2.5 Volts monitor | 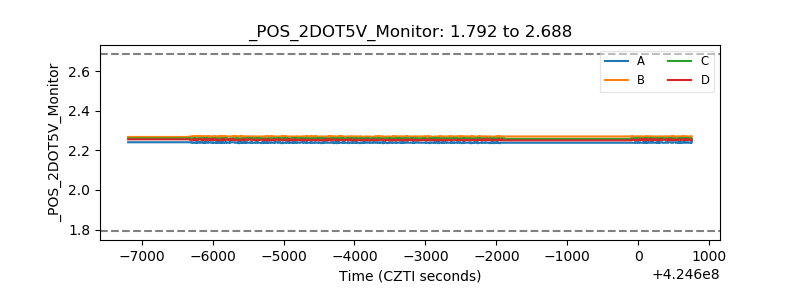 |
| +5 Volts monitor | 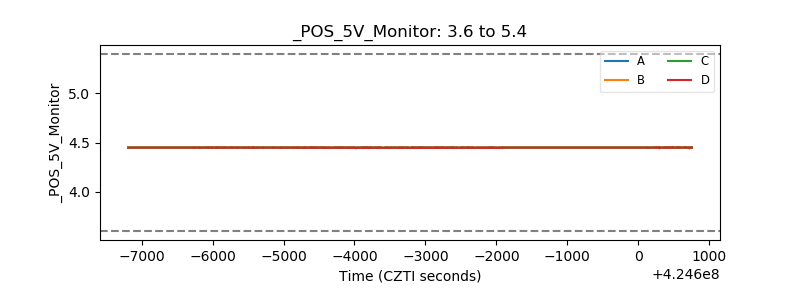 |
| _ROLL_ROT | 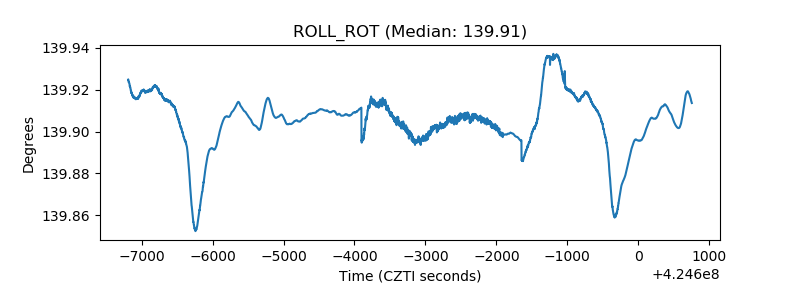 |
| _Roll_DEC | 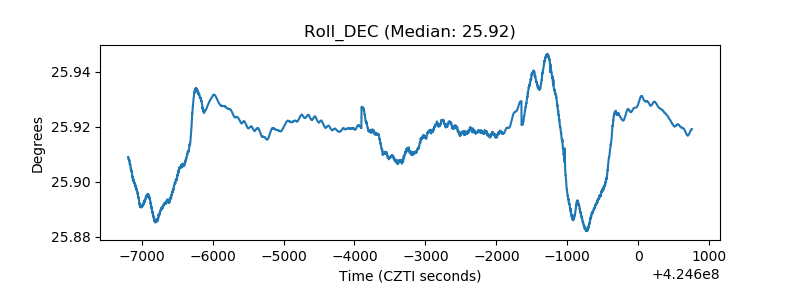 |
| _Roll_RA | 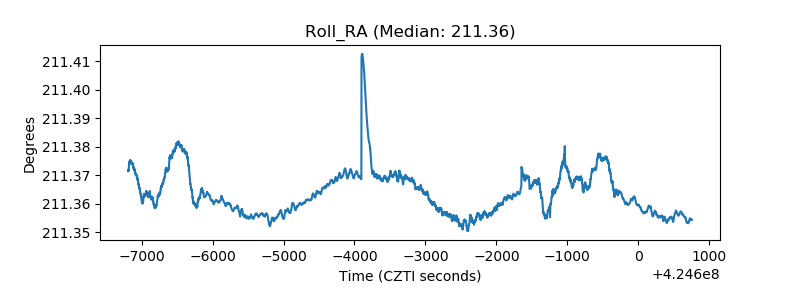 |
| Veto Counter | 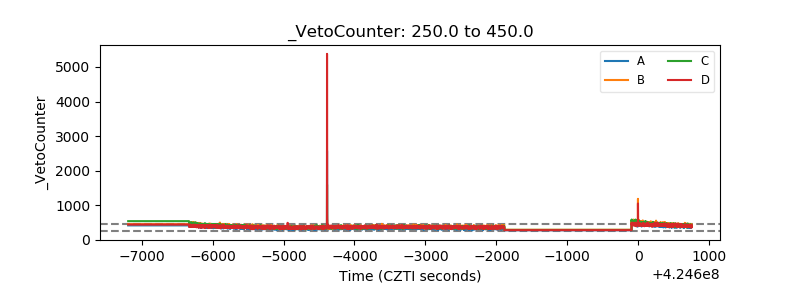 |