| Param | Original file | Final file |
|---|---|---|
| Filename | modeM0/AS1A12_077T12_9000005692_41719cztM0_level2.fits | modeM0/AS1A12_077T12_9000005692_41719cztM0_level2_quad_clean.evt |
| Size (bytes) | 404,677,440 | 101,456,640 |
| Size | 385.9 MB | 96.8 MB |
| Events in quadrant A | 3,294,314 | 700,455 |
| Events in quadrant B | 2,709,128 | 720,695 |
| Events in quadrant C | 3,407,523 | 644,783 |
| Events in quadrant D | 5,112,663 | 595,748 |
| Mode M9 | |||
|---|---|---|---|
| Quadrant | BADHDUFLAG | Total packets | Discarded packets |
| A | 0 | 36 | 0 |
| B | 0 | 36 | 0 |
| C | 0 | 36 | 0 |
| D | 0 | 36 | 0 |
| Mode M0 | |||
|---|---|---|---|
| Quadrant | BADHDUFLAG | Total packets | Discarded packets |
| A | 0 | 13218 | 2 |
| B | 0 | 11790 | 2 |
| C | 0 | 13505 | 2 |
| D | 0 | 19235 | 2 |
| Mode SS | |||
|---|---|---|---|
| Quadrant | BADHDUFLAG | Total packets | Discarded packets |
| A | 0 | 124 | 0 |
| B | 0 | 124 | 0 |
| C | 0 | 124 | 0 |
| D | 0 | 124 | 0 |
| Quadrant | Total seconds | Saturated seconds | Saturation percentage |
|---|---|---|---|
| A | 5866 | 24 | 0.409137% |
| B | 5866 | 9 | 0.153427% |
| C | 5865 | 243 | 4.143223% |
| D | 5865 | 379 | 6.462063% |
Noise dominated data is calculated using 1-second bins in cleaned event files. If a bin has >2000 counts, and if more than 50% of those come from <1% of pixels, then it is considered to be noise-dominated and hence unusable.
| Quadrant | # 1 sec bins | Bins with >0 counts | Bins with >2000 counts | High rate bins dominated by noise | Noise dominated (total time) | Noise dominated (detector-on time) | Marked lightcurve |
|---|---|---|---|---|---|---|---|
| A | 9573 | 5868 | 5 | 5 | 0.05% | 0.09% | 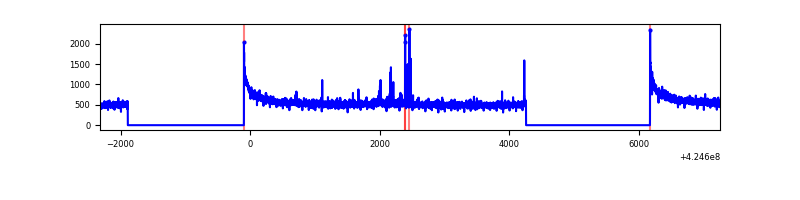 |
| B | 9573 | 5868 | 0 | 0 | 0.00% | 0.00% | 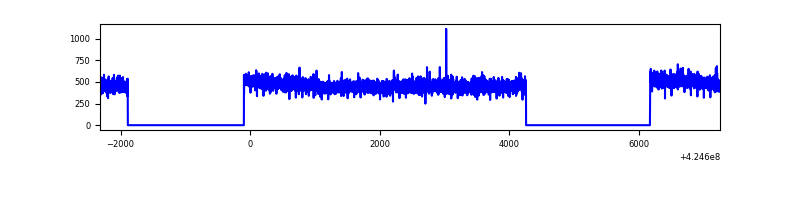 |
| C | 9572 | 5867 | 233 | 233 | 2.43% | 3.97% | 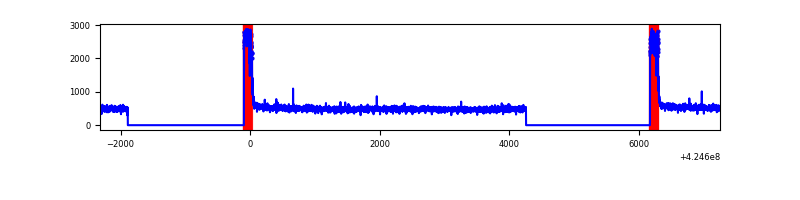 |
| D | 9572 | 5867 | 388 | 388 | 4.05% | 6.61% | 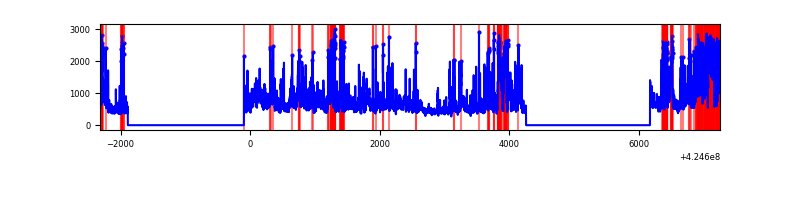 |
Top three noisy pixels from each quadrant. If the there are fewer than three noisy pixels in the level2.evt file, extra rows are filled as -1
| Pixel properties | Quadrant properties | ||||||
|---|---|---|---|---|---|---|---|
| Quadrant | DetID | PixID | Counts | Sigma | Mean | Median | Sigma |
| A | 10 | 83 | 551737 | 3890.06 | 693 | 682 | 141.7 |
| A | 15 | 223 | 60177 | 419.99 | 693 | 682 | 141.7 |
| A | 3 | 137 | 7598 | 48.82 | 693 | 682 | 141.7 |
| B | 12 | 111 | 16850 | 122.14 | 682 | 663 | 132.5 |
| B | 11 | 111 | 15801 | 114.23 | 682 | 663 | 132.5 |
| B | 14 | 111 | 15561 | 112.42 | 682 | 663 | 132.5 |
| C | 0 | 10 | 624238 | 4104.92 | 650 | 656 | 151.9 |
| C | 15 | 214 | 236729 | 1554.02 | 650 | 656 | 151.9 |
| C | 14 | 67 | 10840 | 67.04 | 650 | 656 | 151.9 |
| D | 12 | 79 | 1569396 | 9866.37 | 656 | 639 | 159.0 |
| D | 13 | 249 | 576108 | 3619.29 | 656 | 639 | 159.0 |
| D | 2 | 249 | 312047 | 1958.54 | 656 | 639 | 159.0 |
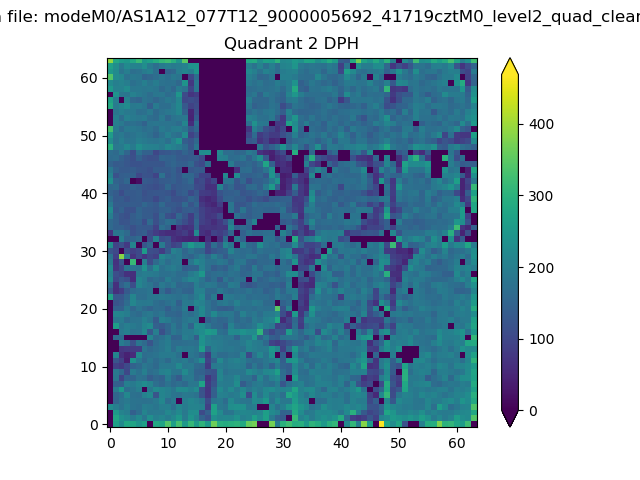
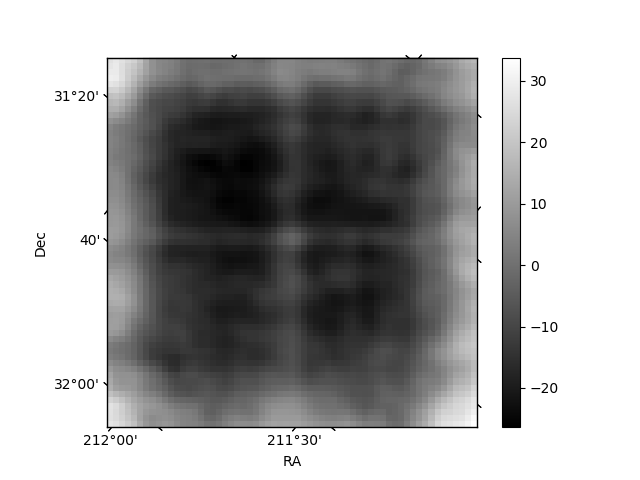
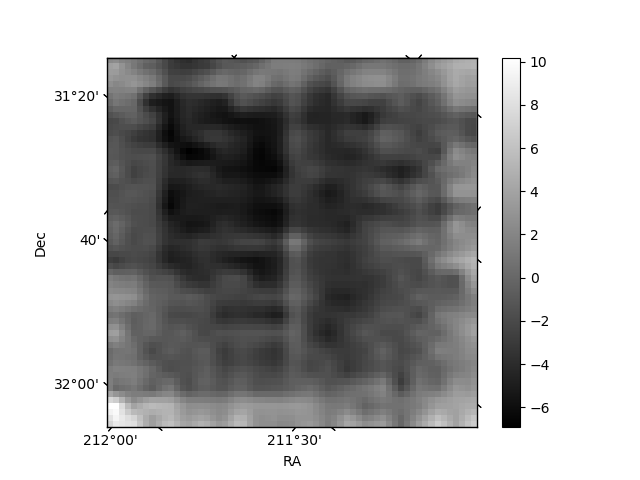
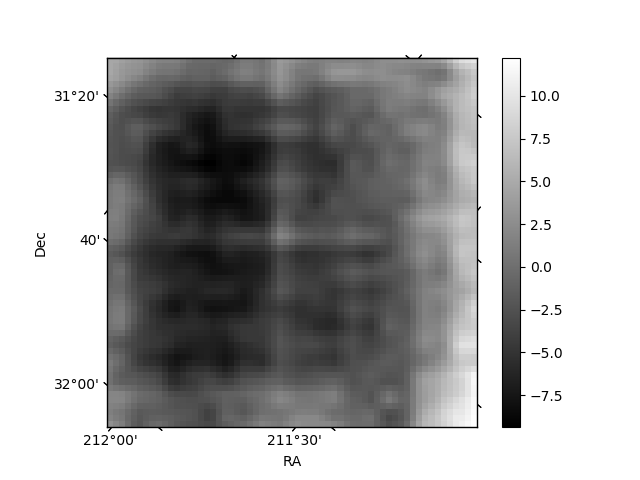
Histogram calculated using DETX and DETY for each event in the final _common_clean file
| Quadrant A | 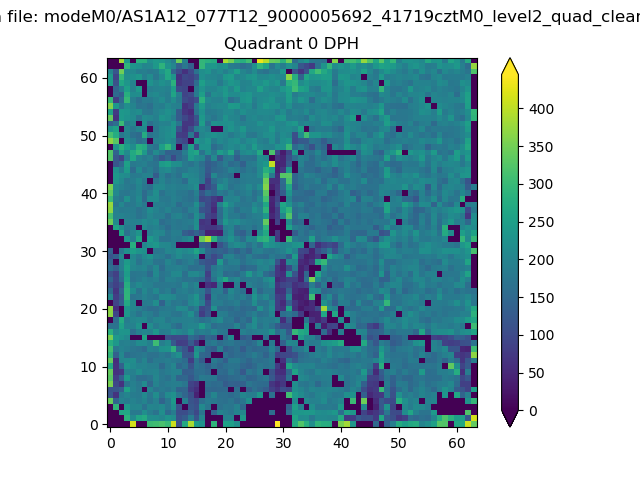 |
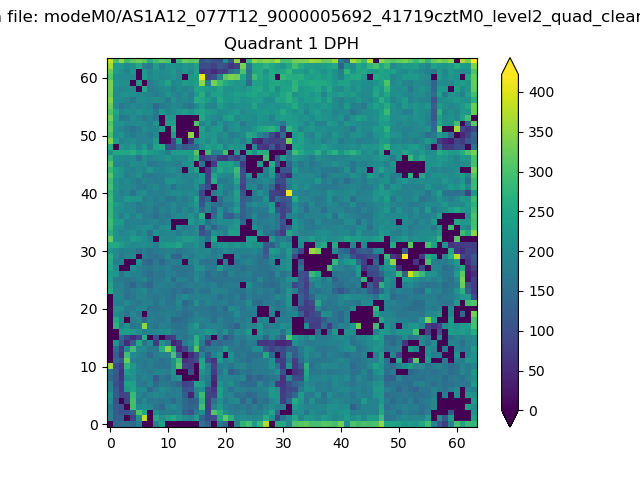 |
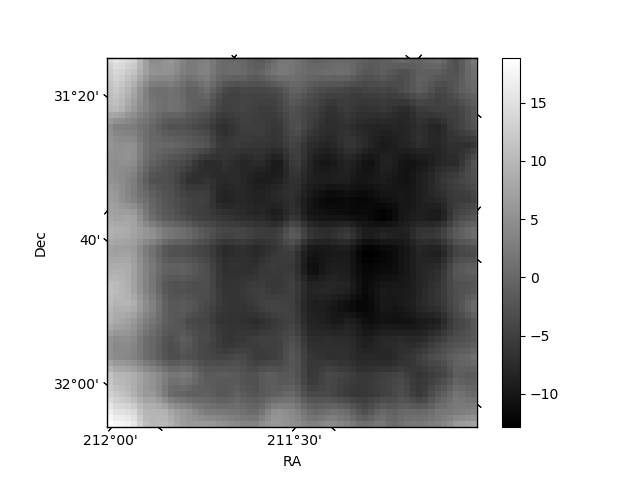
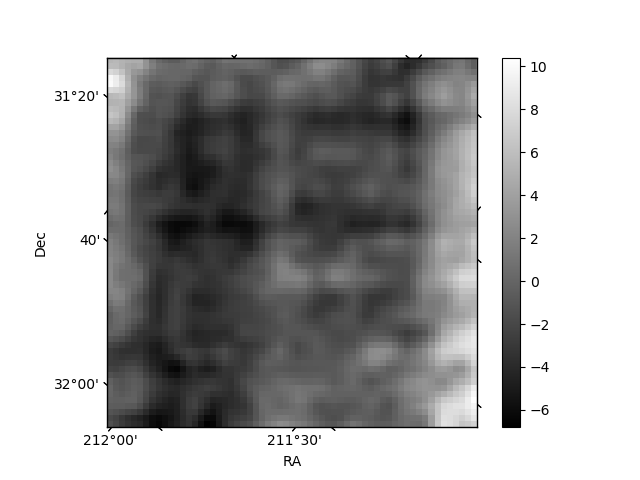
Quadrant B |
|---|---|---|---|
| Quadrant D | 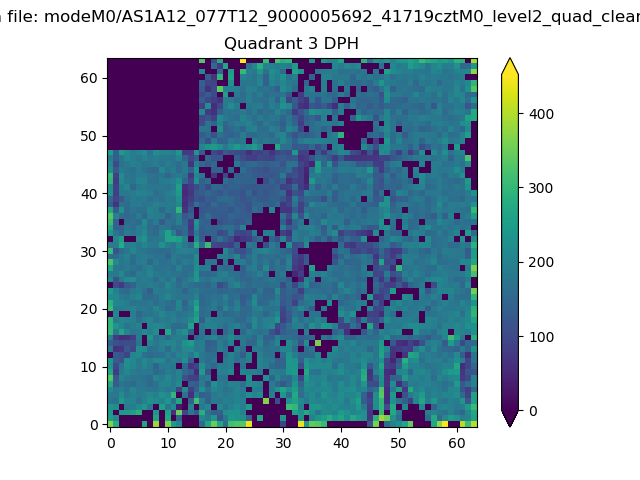 |
 |
Quadrant C |
| Plot type | Count rate plots | Images |
|---|---|---|
| Comparison with Poisson distribution Blue bars denote a histogram of data divided into 1 sec bins. Red curve is a Poisson curve with rate = median count rate of data. |
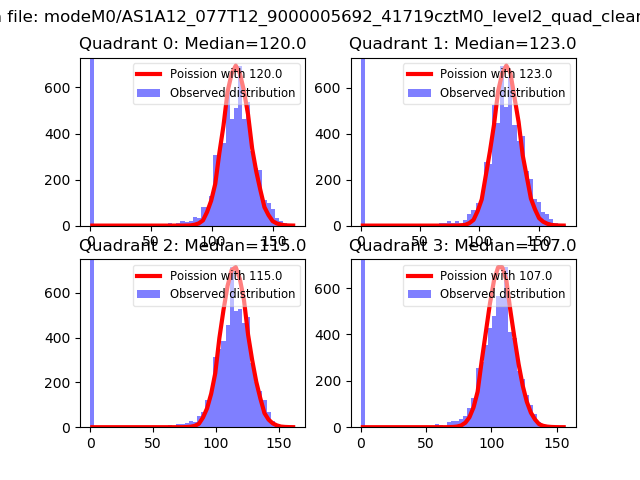 |
 |
| Quadrant-wise count rates Data is divided into 100 sec bins |
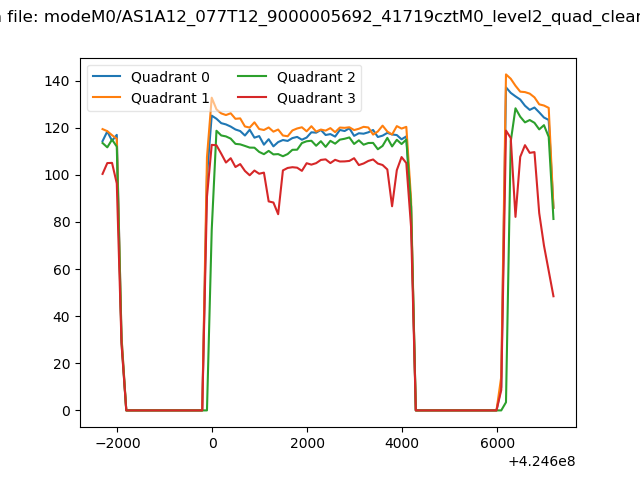 |
|
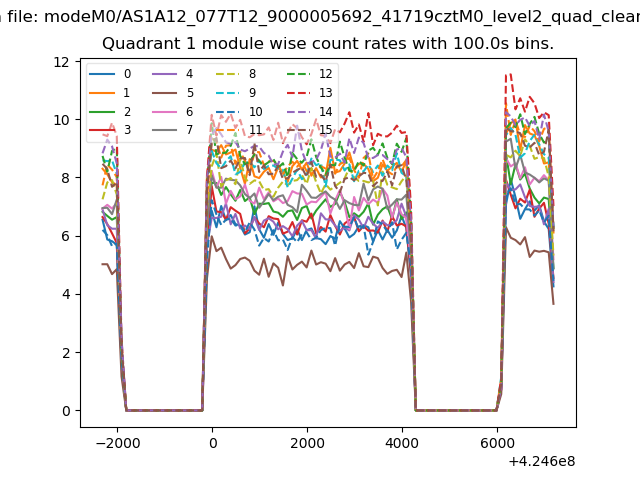
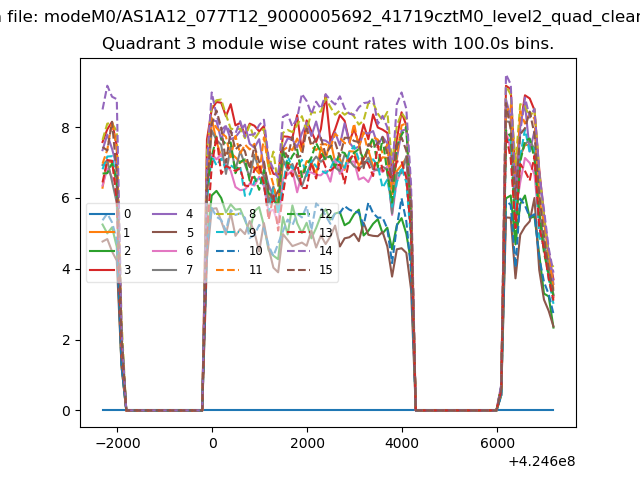
| Module-wise count rates for Quadrant A Data is divided into 100 sec bins |
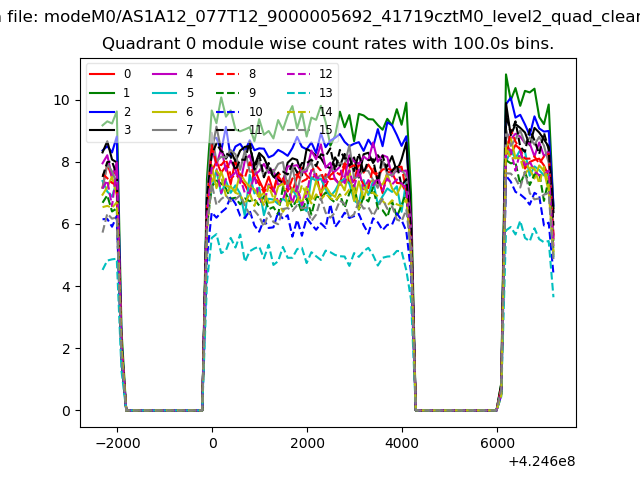 |
 |
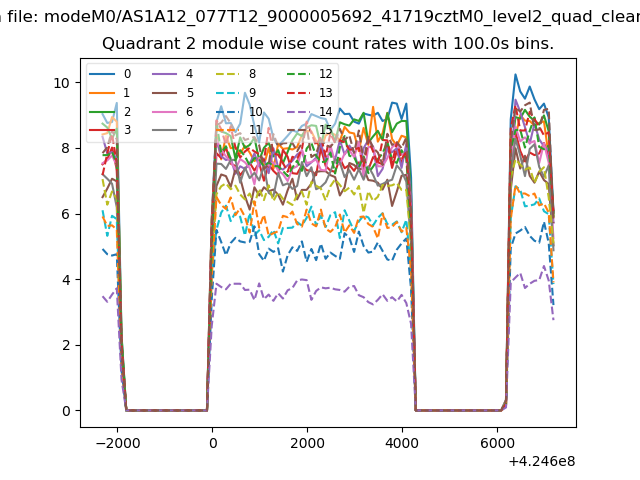
| Module-wise count rates for Quadrant B Data is divided into 100 sec bins |
 |
 |
| Module-wise count rates for Quadrant C Data is divided into 100 sec bins |
 |
 |
| Module-wise count rates for Quadrant D Data is divided into 100 sec bins |
 |
 |
| Parameter | Plot |
|---|---|
| CZT HV Monitor | 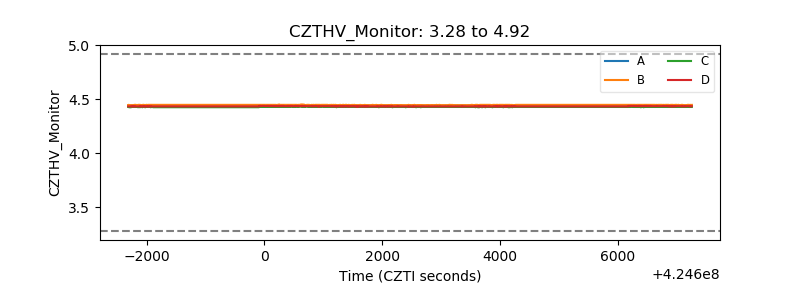 |
| D_VDD | 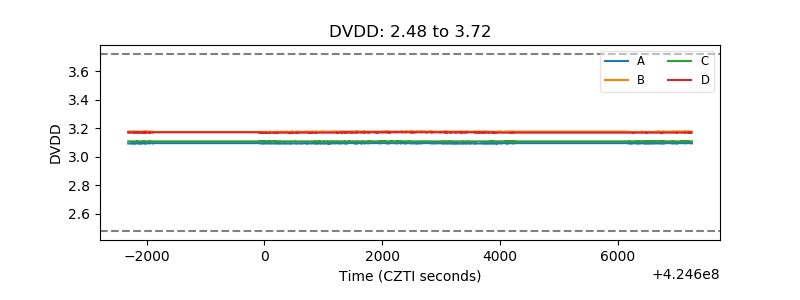 |
| Temperature 1 | 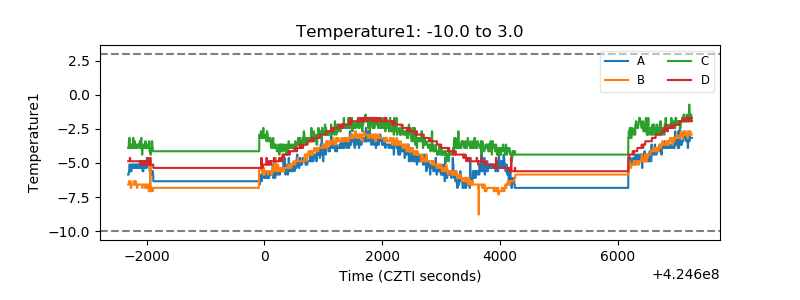 |
| Veto HV Monitor | 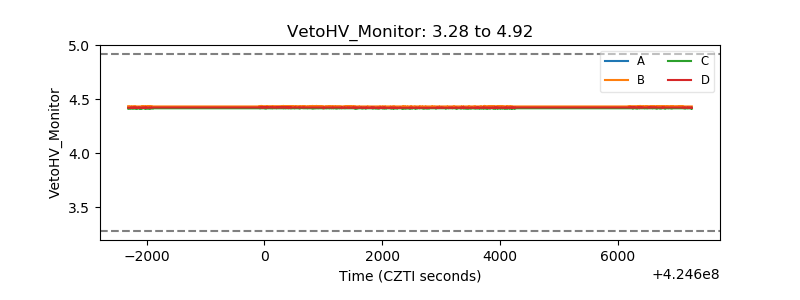 |
| Veto LLD | 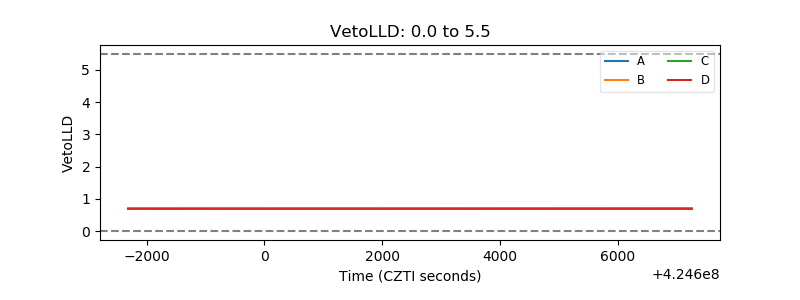 |
| Alpha Counter | 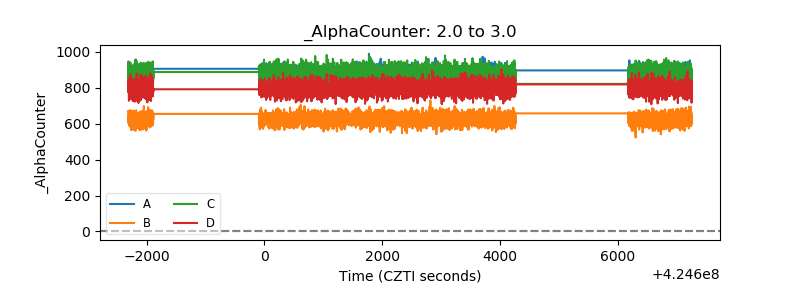 |
| _CPM_Rate | 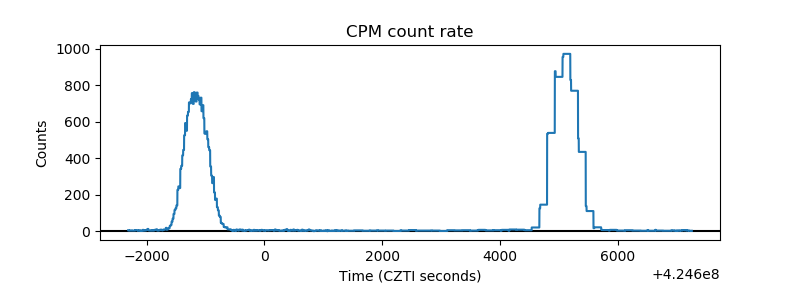 |
| CZT Counter | 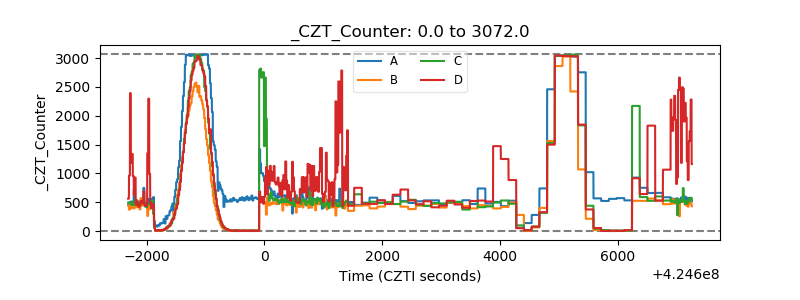 |
| +2.5 Volts monitor | 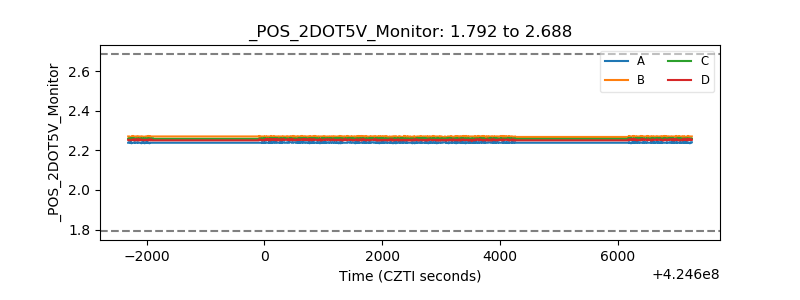 |
| +5 Volts monitor | 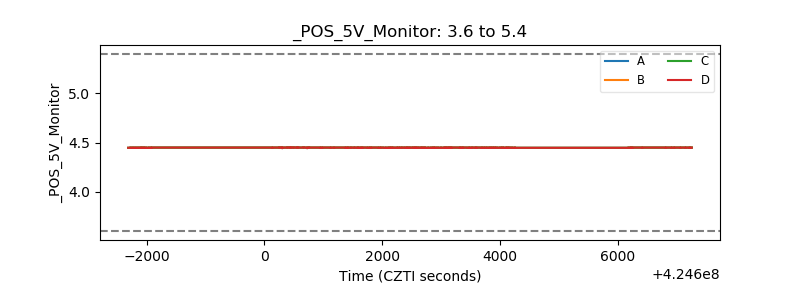 |
| _ROLL_ROT | 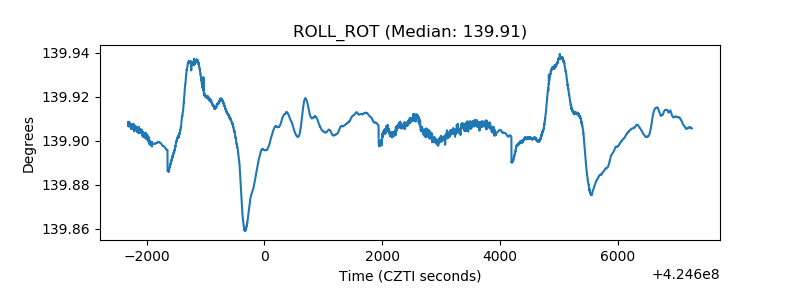 |
| _Roll_DEC | 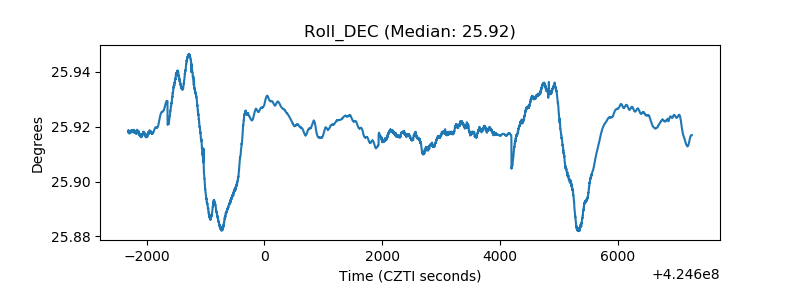 |
| _Roll_RA | 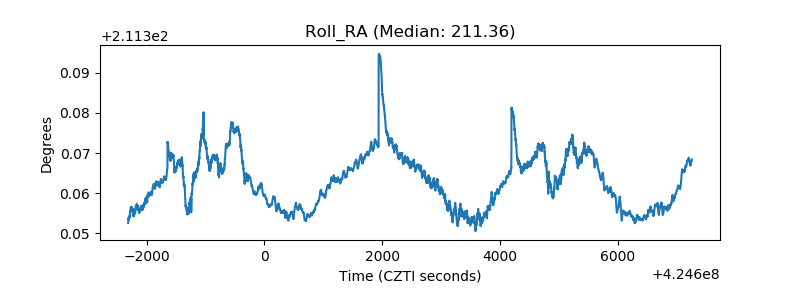 |
| Veto Counter | 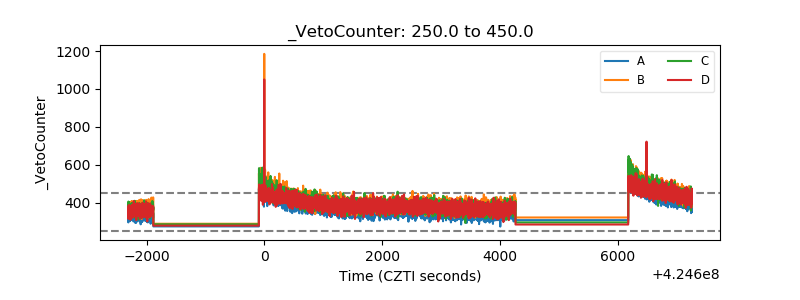 |