| Param | Original file | Final file |
|---|---|---|
| Filename | modeM0/AS1A12_077T12_9000005692_41720cztM0_level2.fits | modeM0/AS1A12_077T12_9000005692_41720cztM0_level2_quad_clean.evt |
| Size (bytes) | 447,687,360 | 88,485,120 |
| Size | 426.9 MB | 84.4 MB |
| Events in quadrant A | 3,058,346 | 640,984 |
| Events in quadrant B | 2,454,860 | 656,719 |
| Events in quadrant C | 2,914,866 | 596,706 |
| Events in quadrant D | 7,740,701 | 421,886 |
| Mode M9 | |||
|---|---|---|---|
| Quadrant | BADHDUFLAG | Total packets | Discarded packets |
| A | 0 | 20 | 0 |
| B | 0 | 20 | 0 |
| C | 0 | 20 | 0 |
| D | 0 | 20 | 0 |
| Mode M0 | |||
|---|---|---|---|
| Quadrant | BADHDUFLAG | Total packets | Discarded packets |
| A | 0 | 12170 | 1 |
| B | 0 | 10501 | 1 |
| C | 0 | 11559 | 1 |
| D | 0 | 26500 | 1 |
| Mode SS | |||
|---|---|---|---|
| Quadrant | BADHDUFLAG | Total packets | Discarded packets |
| A | 0 | 106 | 0 |
| B | 0 | 106 | 0 |
| C | 0 | 106 | 0 |
| D | 0 | 106 | 0 |
| Quadrant | Total seconds | Saturated seconds | Saturation percentage |
|---|---|---|---|
| A | 5182 | 45 | 0.868391% |
| B | 5183 | 9 | 0.173645% |
| C | 5183 | 138 | 2.662551% |
| D | 5183 | 1629 | 31.429674% |
Noise dominated data is calculated using 1-second bins in cleaned event files. If a bin has >2000 counts, and if more than 50% of those come from <1% of pixels, then it is considered to be noise-dominated and hence unusable.
| Quadrant | # 1 sec bins | Bins with >0 counts | Bins with >2000 counts | High rate bins dominated by noise | Noise dominated (total time) | Noise dominated (detector-on time) | Marked lightcurve |
|---|---|---|---|---|---|---|---|
| A | 7215 | 5183 | 32 | 32 | 0.44% | 0.62% | 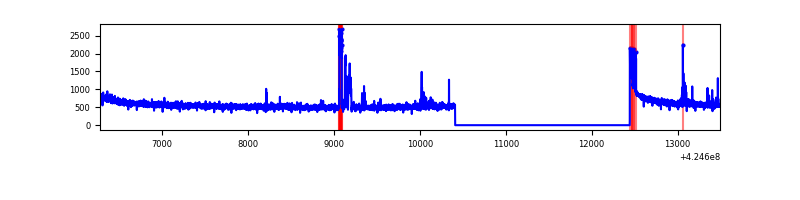 |
| B | 7216 | 5184 | 0 | 0 | 0.00% | 0.00% | 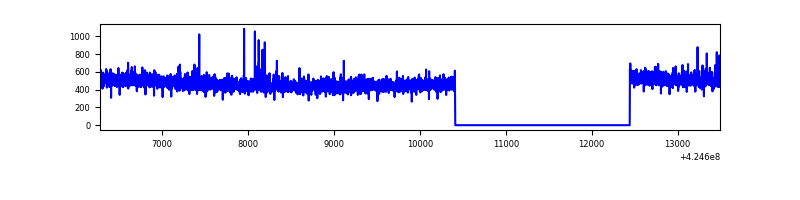 |
| C | 7216 | 5184 | 132 | 132 | 1.83% | 2.55% | 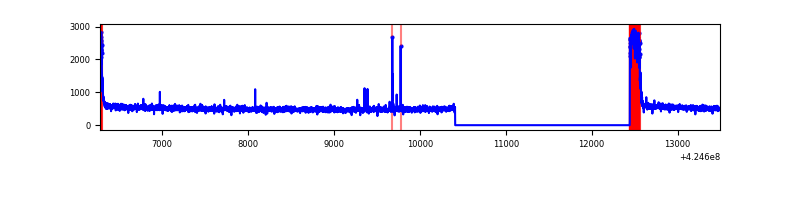 |
| D | 7216 | 5184 | 1745 | 1745 | 24.18% | 33.66% | 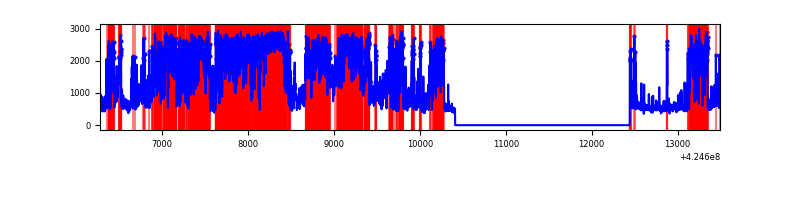 |
Top three noisy pixels from each quadrant. If the there are fewer than three noisy pixels in the level2.evt file, extra rows are filled as -1
| Pixel properties | Quadrant properties | ||||||
|---|---|---|---|---|---|---|---|
| Quadrant | DetID | PixID | Counts | Sigma | Mean | Median | Sigma |
| A | 10 | 83 | 473792 | 3703.79 | 623 | 612 | 127.8 |
| A | 15 | 223 | 123993 | 965.76 | 623 | 612 | 127.8 |
| A | 7 | 3 | 39360 | 303.3 | 623 | 612 | 127.8 |
| B | 15 | 35 | 30485 | 253.94 | 612 | 597 | 117.7 |
| B | 12 | 111 | 14585 | 118.85 | 612 | 597 | 117.7 |
| B | 11 | 111 | 13919 | 113.19 | 612 | 597 | 117.7 |
| C | 0 | 10 | 382843 | 2752.47 | 590 | 594 | 138.9 |
| C | 15 | 214 | 209487 | 1504.18 | 590 | 594 | 138.9 |
| C | 15 | 159 | 15190 | 105.1 | 590 | 594 | 138.9 |
| D | 12 | 79 | 4046738 | 31213.59 | 536 | 522 | 129.6 |
| D | 13 | 249 | 885583 | 6827.6 | 536 | 522 | 129.6 |
| D | 2 | 249 | 669486 | 5160.57 | 536 | 522 | 129.6 |
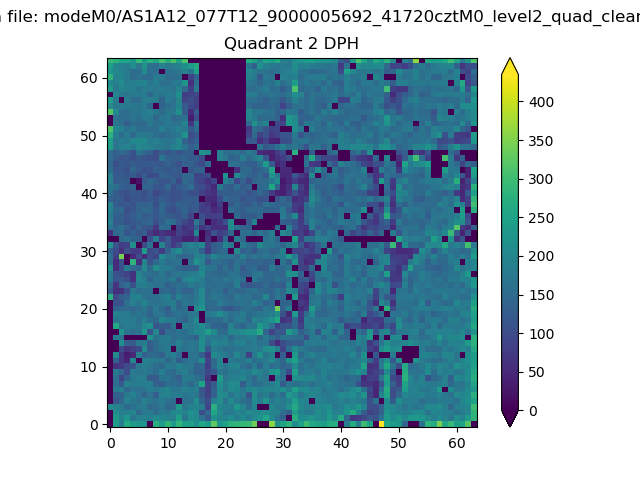
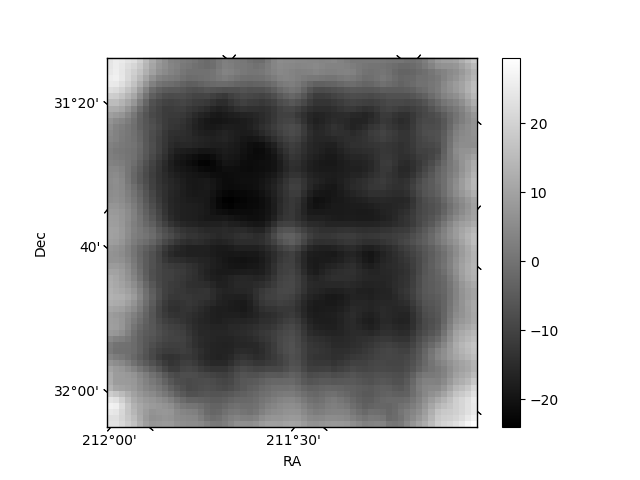
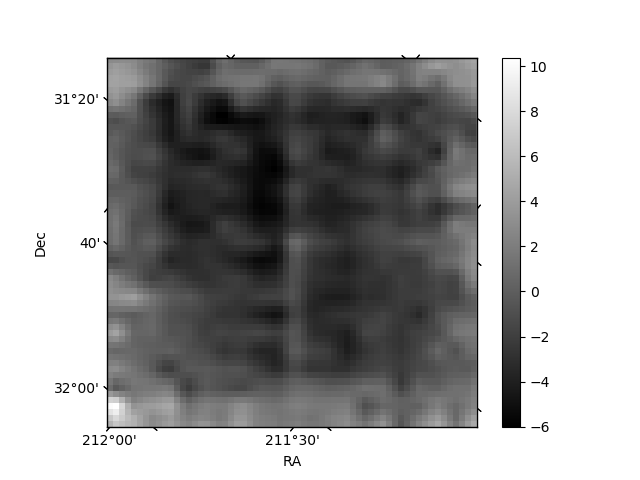
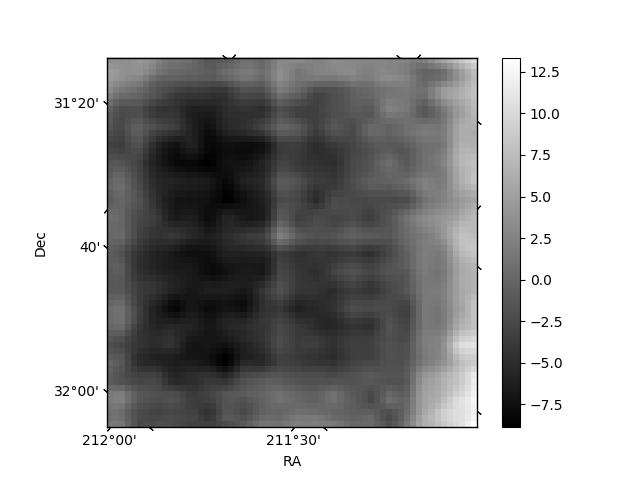
Histogram calculated using DETX and DETY for each event in the final _common_clean file
| Quadrant A | 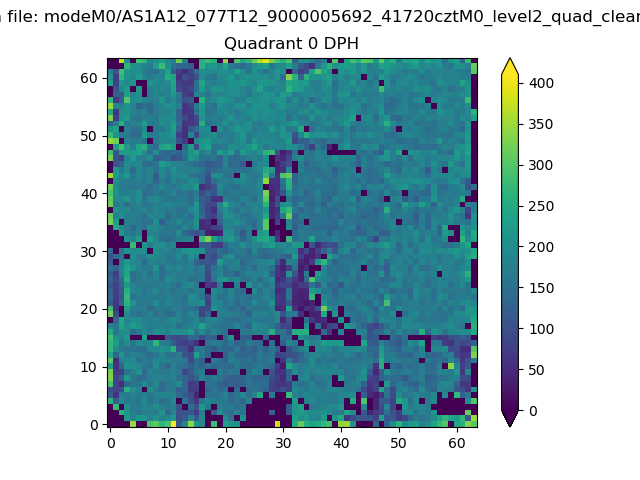 |
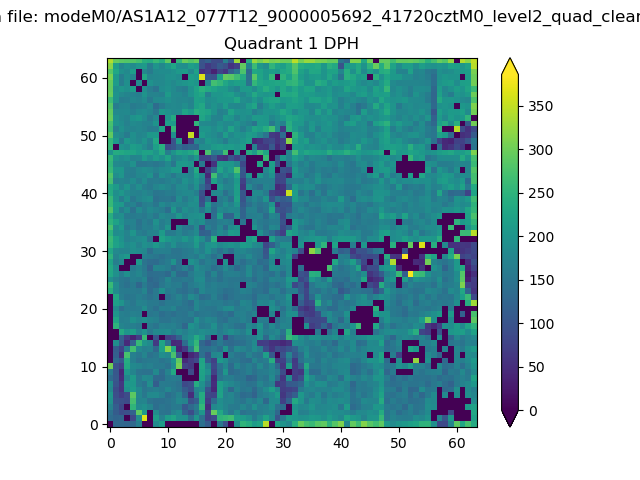 |
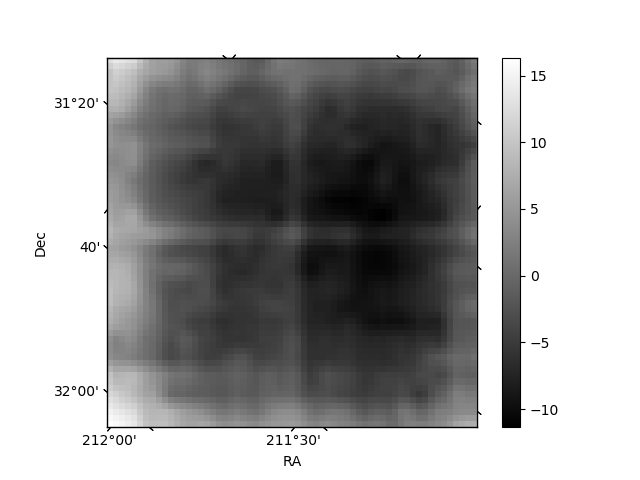
Quadrant B |
|---|---|---|---|
| Quadrant D | 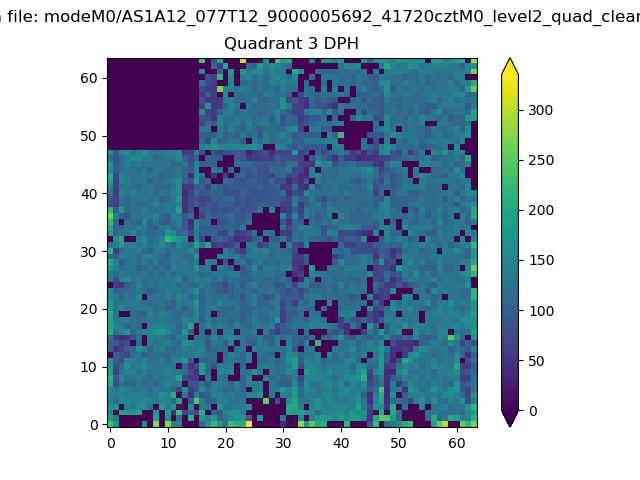 |
 |
Quadrant C |
| Plot type | Count rate plots | Images |
|---|---|---|
| Comparison with Poisson distribution Blue bars denote a histogram of data divided into 1 sec bins. Red curve is a Poisson curve with rate = median count rate of data. |
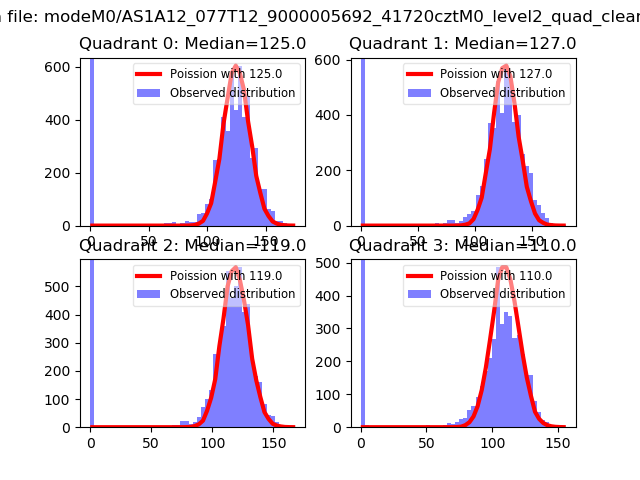 |
 |
| Quadrant-wise count rates Data is divided into 100 sec bins |
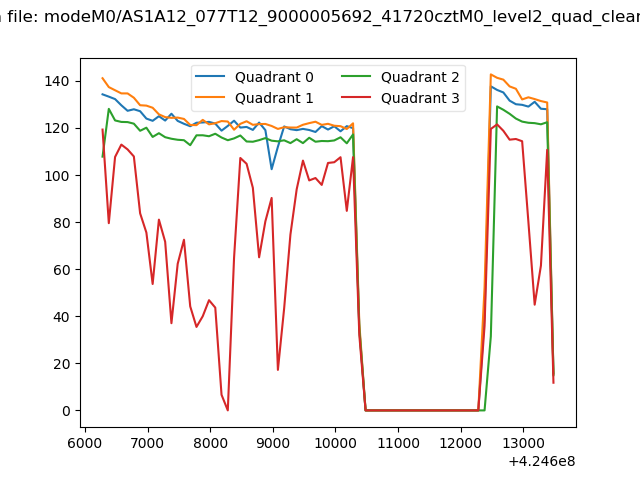 |
|
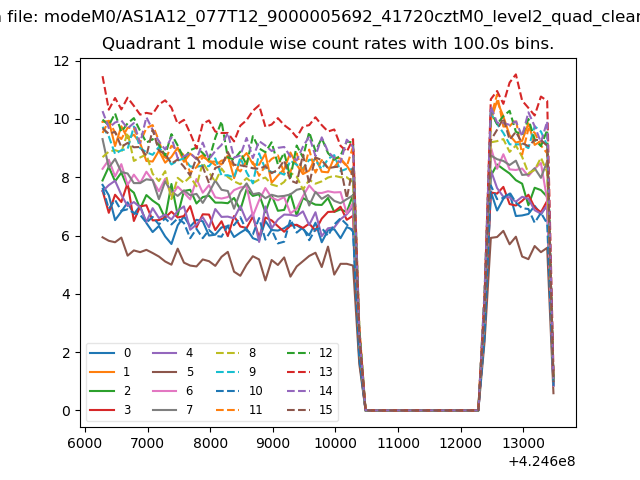
| Module-wise count rates for Quadrant A Data is divided into 100 sec bins |
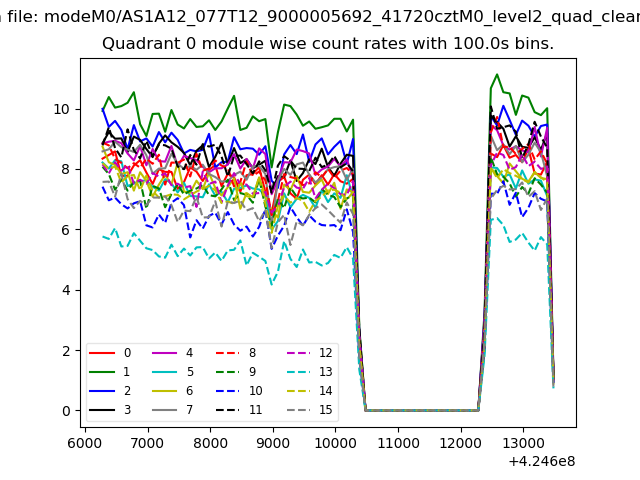 |
 |
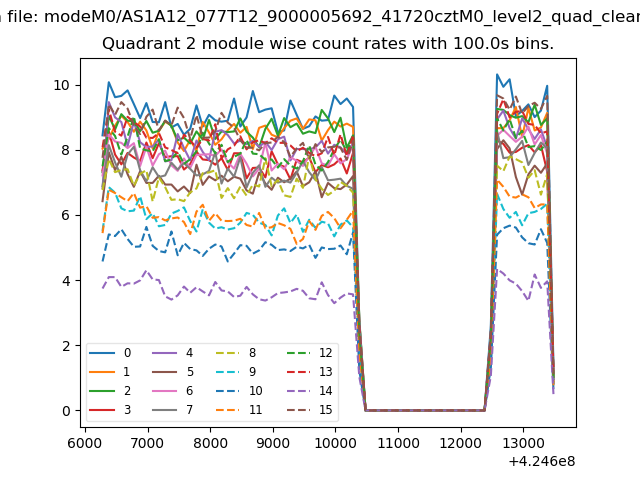
| Module-wise count rates for Quadrant B Data is divided into 100 sec bins |
 |
 |
| Module-wise count rates for Quadrant C Data is divided into 100 sec bins |
 |
 |
| Module-wise count rates for Quadrant D Data is divided into 100 sec bins |
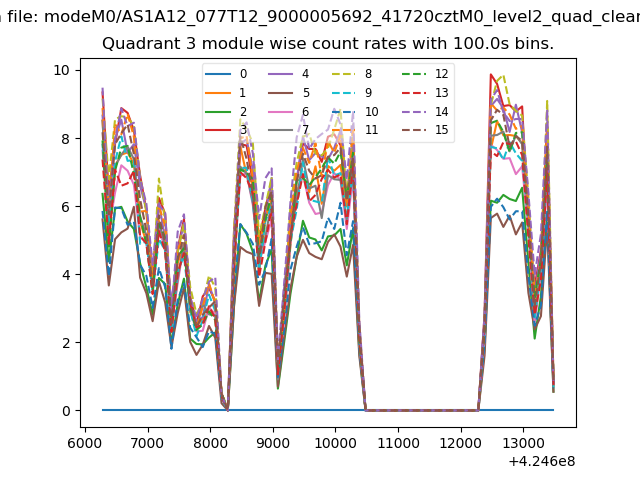 |
 |
| Parameter | Plot |
|---|---|
| CZT HV Monitor | 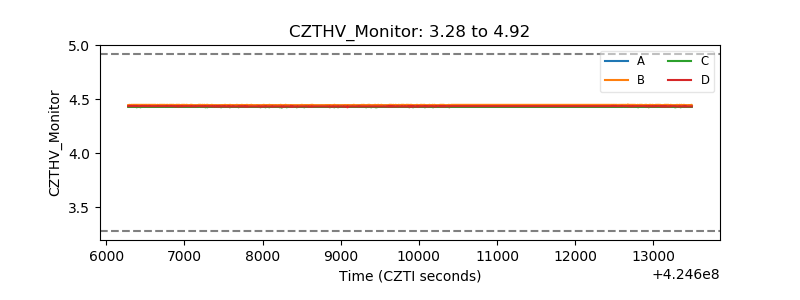 |
| D_VDD | 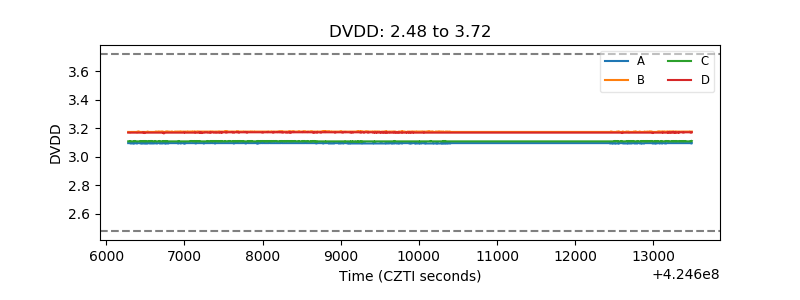 |
| Temperature 1 | 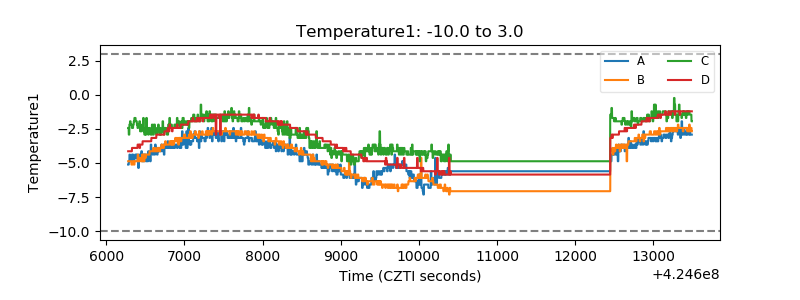 |
| Veto HV Monitor | 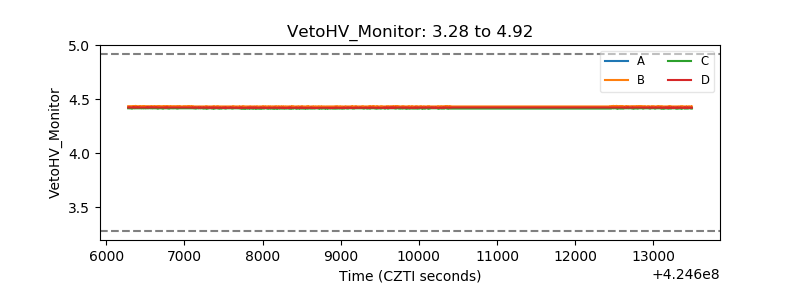 |
| Veto LLD | 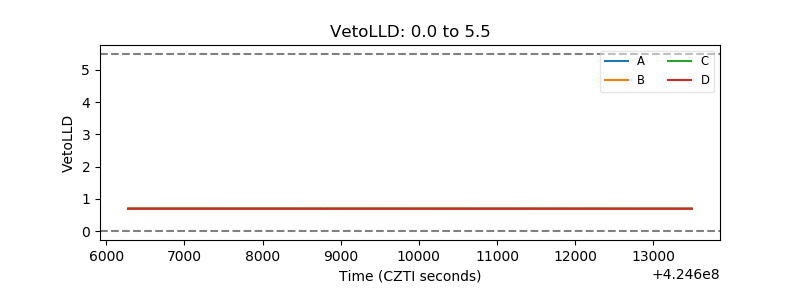 |
| Alpha Counter | 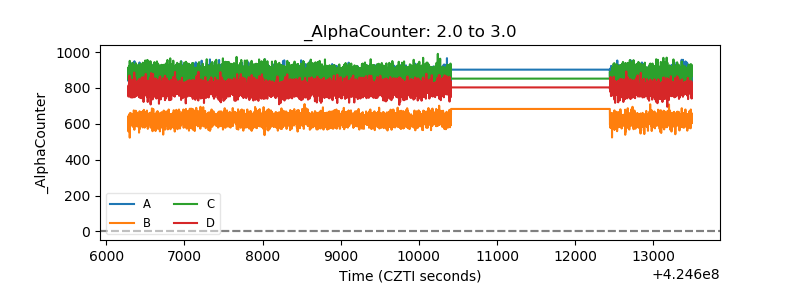 |
| _CPM_Rate |  |
| CZT Counter | 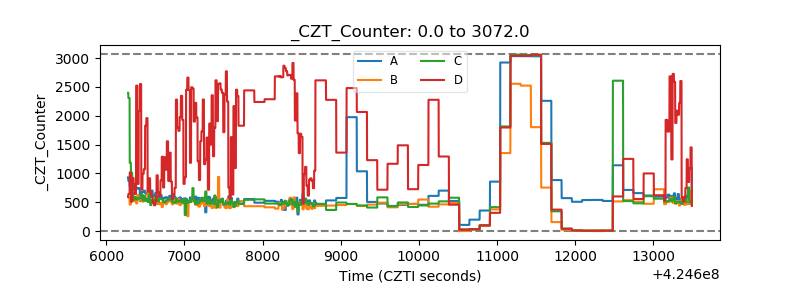 |
| +2.5 Volts monitor | 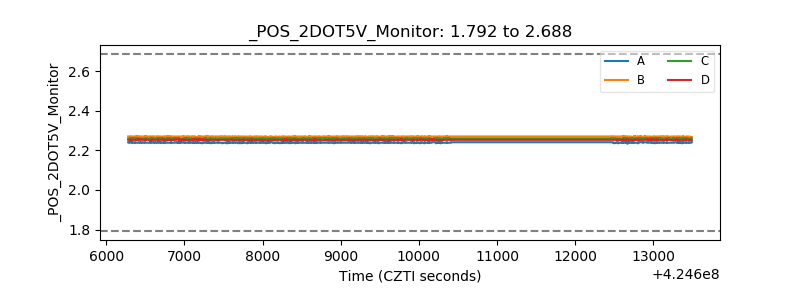 |
| +5 Volts monitor | 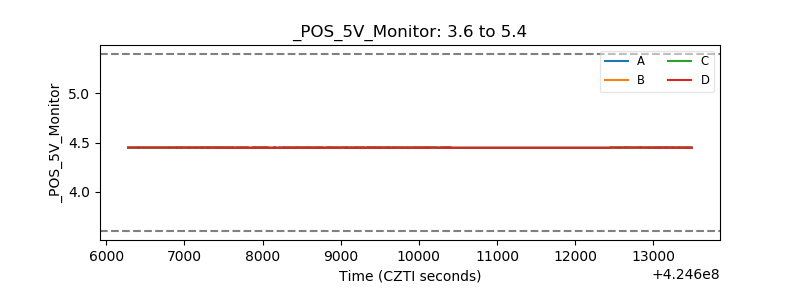 |
| _ROLL_ROT | 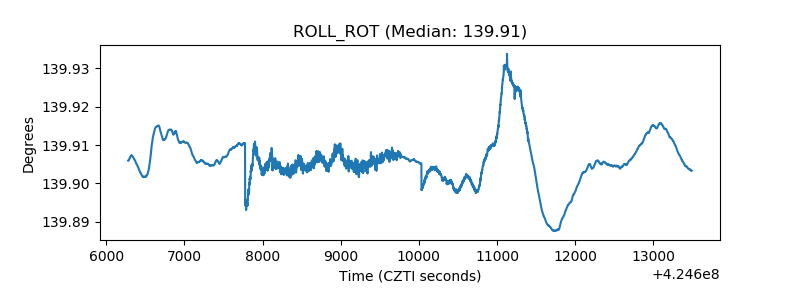 |
| _Roll_DEC | 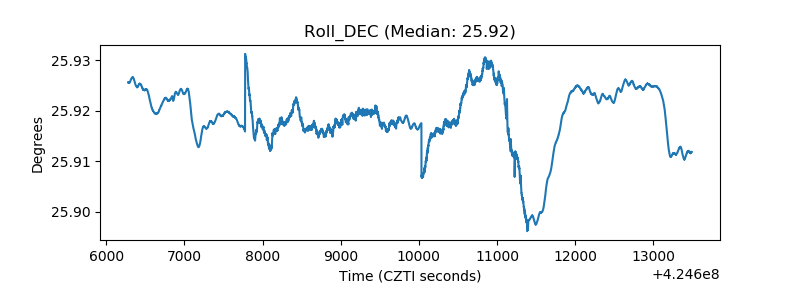 |
| _Roll_RA | 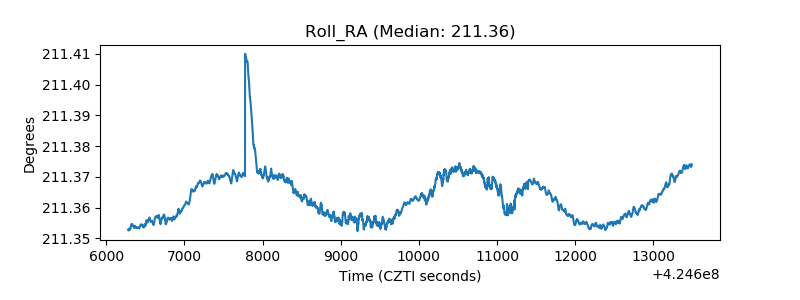 |
| Veto Counter | 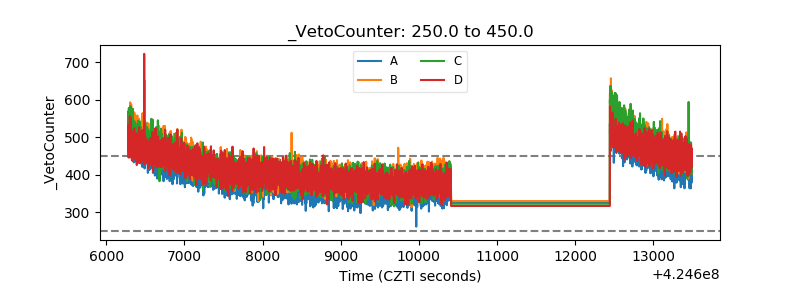 |