| Param | Original file | Final file |
|---|---|---|
| Filename | modeM0/AS1A12_077T12_9000005692_41721cztM0_level2.fits | modeM0/AS1A12_077T12_9000005692_41721cztM0_level2_quad_clean.evt |
| Size (bytes) | 317,528,640 | 87,341,760 |
| Size | 302.8 MB | 83.3 MB |
| Events in quadrant A | 2,782,893 | 606,657 |
| Events in quadrant B | 2,326,137 | 617,129 |
| Events in quadrant C | 2,615,470 | 569,228 |
| Events in quadrant D | 3,649,264 | 510,061 |
| Mode M9 | |||
|---|---|---|---|
| Quadrant | BADHDUFLAG | Total packets | Discarded packets |
| A | 0 | 22 | 0 |
| B | 0 | 22 | 0 |
| C | 0 | 22 | 0 |
| D | 0 | 22 | 0 |
| Mode M0 | |||
|---|---|---|---|
| Quadrant | BADHDUFLAG | Total packets | Discarded packets |
| A | 0 | 11251 | 1 |
| B | 0 | 9971 | 1 |
| C | 0 | 10578 | 1 |
| D | 0 | 14061 | 2 |
| Mode SS | |||
|---|---|---|---|
| Quadrant | BADHDUFLAG | Total packets | Discarded packets |
| A | 0 | 98 | 0 |
| B | 0 | 98 | 0 |
| C | 0 | 98 | 0 |
| D | 0 | 98 | 0 |
| Quadrant | Total seconds | Saturated seconds | Saturation percentage |
|---|---|---|---|
| A | 4876 | 13 | 0.266612% |
| B | 4876 | 6 | 0.123052% |
| C | 4877 | 104 | 2.132458% |
| D | 4876 | 345 | 7.075472% |
Noise dominated data is calculated using 1-second bins in cleaned event files. If a bin has >2000 counts, and if more than 50% of those come from <1% of pixels, then it is considered to be noise-dominated and hence unusable.
| Quadrant | # 1 sec bins | Bins with >0 counts | Bins with >2000 counts | High rate bins dominated by noise | Noise dominated (total time) | Noise dominated (detector-on time) | Marked lightcurve |
|---|---|---|---|---|---|---|---|
| A | 7000 | 4877 | 10 | 10 | 0.14% | 0.21% | 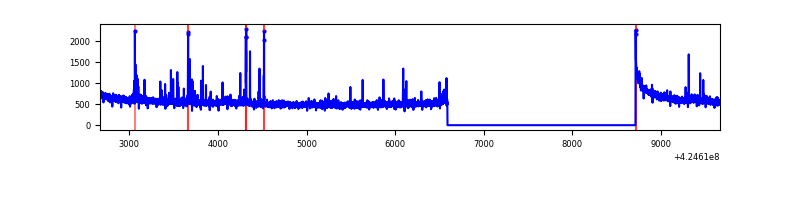 |
| B | 7000 | 4877 | 1 | 1 | 0.01% | 0.02% | 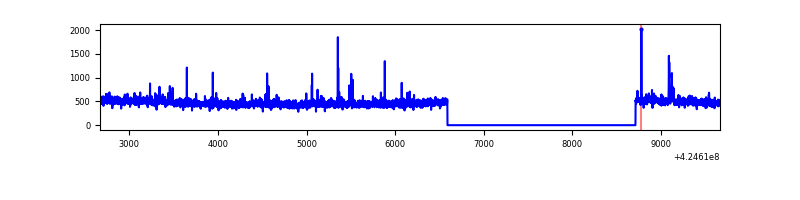 |
| C | 7001 | 4878 | 100 | 100 | 1.43% | 2.05% |  |
| D | 7000 | 4877 | 319 | 319 | 4.56% | 6.54% | 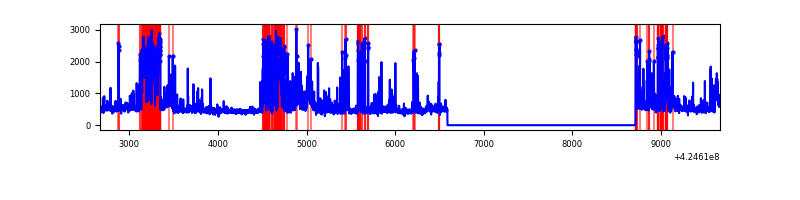 |
Top three noisy pixels from each quadrant. If the there are fewer than three noisy pixels in the level2.evt file, extra rows are filled as -1
| Pixel properties | Quadrant properties | ||||||
|---|---|---|---|---|---|---|---|
| Quadrant | DetID | PixID | Counts | Sigma | Mean | Median | Sigma |
| A | 10 | 83 | 444272 | 3724.25 | 578 | 567 | 119.1 |
| A | 2 | 79 | 49577 | 411.37 | 578 | 567 | 119.1 |
| A | 7 | 3 | 28490 | 234.37 | 578 | 567 | 119.1 |
| B | 5 | 255 | 39740 | 359.58 | 566 | 551 | 109.0 |
| B | 0 | 183 | 28478 | 256.24 | 566 | 551 | 109.0 |
| B | 15 | 35 | 28262 | 254.26 | 566 | 551 | 109.0 |
| C | 0 | 10 | 264244 | 2064.34 | 551 | 557 | 127.7 |
| C | 15 | 214 | 194153 | 1515.62 | 551 | 557 | 127.7 |
| C | 14 | 67 | 8303 | 60.64 | 551 | 557 | 127.7 |
| D | 13 | 249 | 716031 | 5408.05 | 543 | 529 | 132.3 |
| D | 2 | 249 | 553973 | 4183.15 | 543 | 529 | 132.3 |
| D | 12 | 79 | 124301 | 935.52 | 543 | 529 | 132.3 |
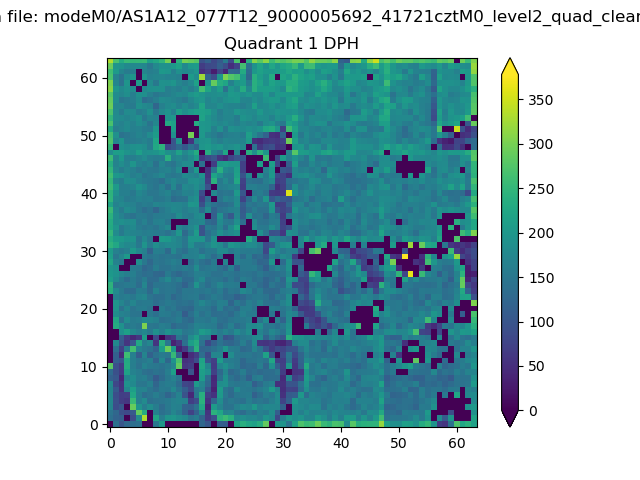
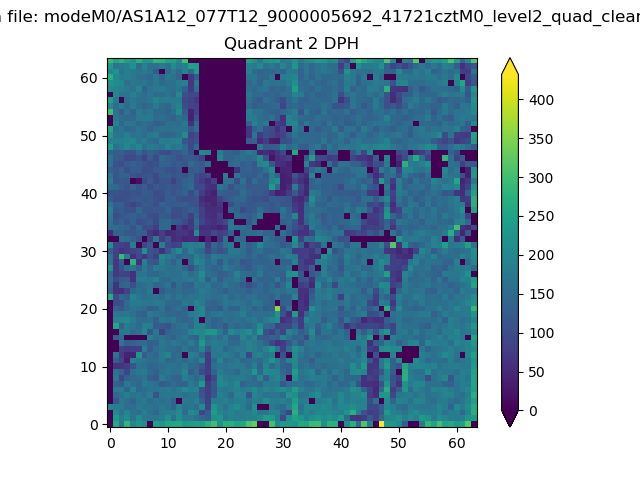
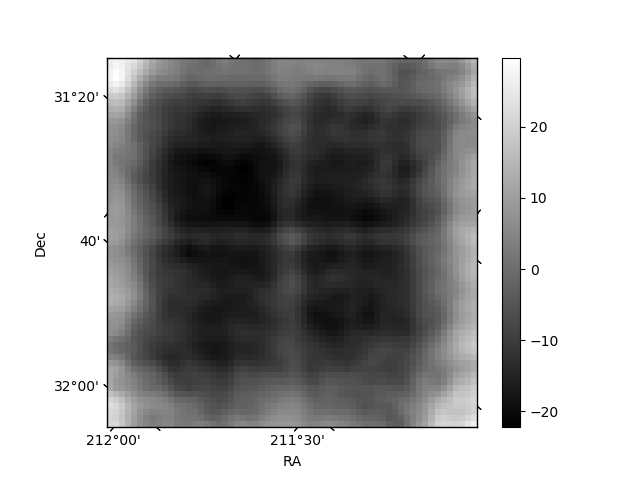
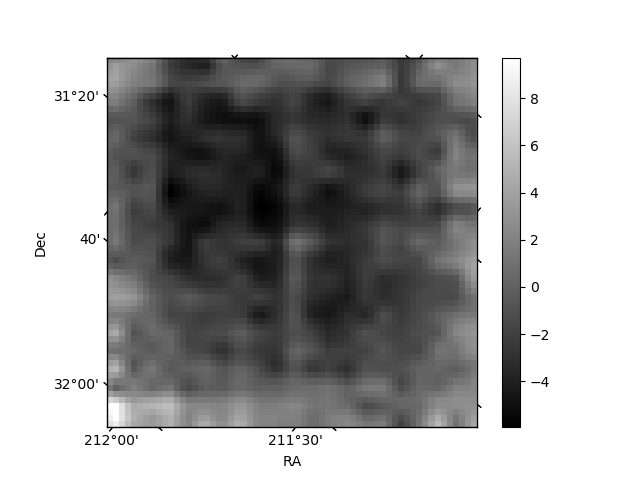
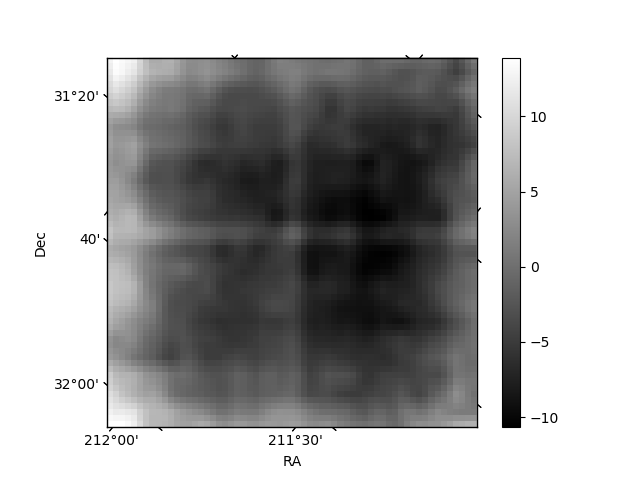
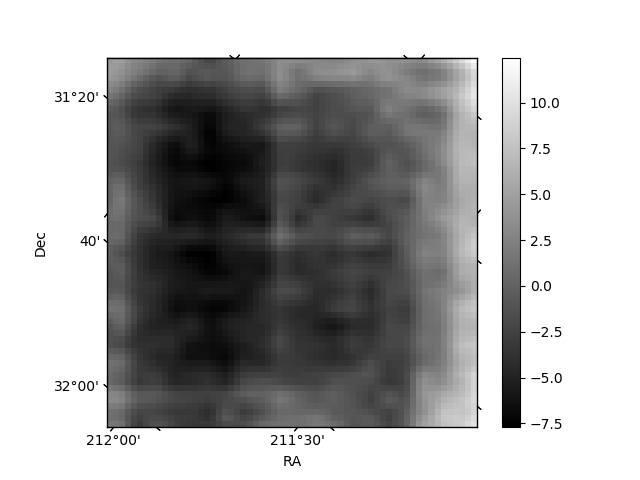
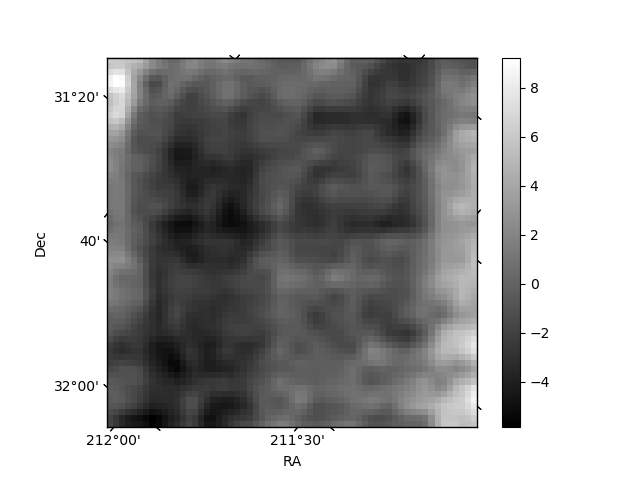
Histogram calculated using DETX and DETY for each event in the final _common_clean file
| Quadrant A | 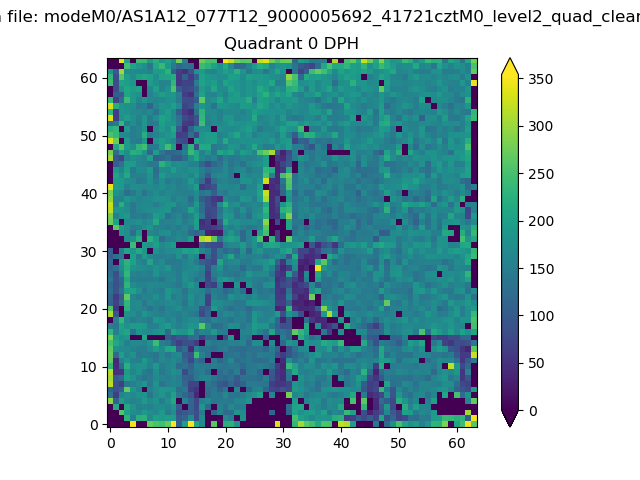 |
 |
Quadrant B |
|---|---|---|---|
| Quadrant D | 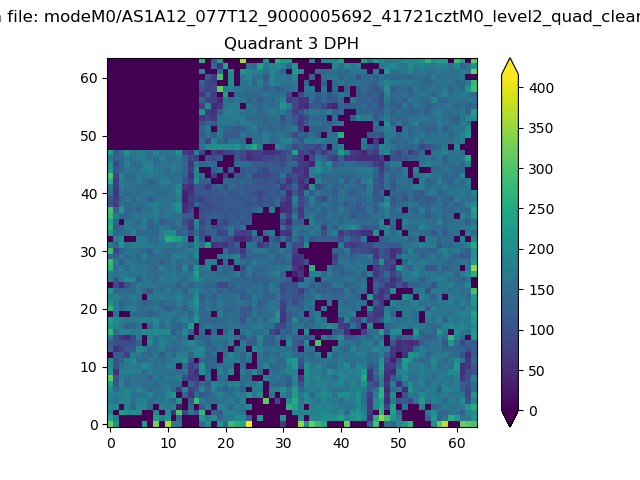 |
 |
Quadrant C |
| Plot type | Count rate plots | Images |
|---|---|---|
| Comparison with Poisson distribution Blue bars denote a histogram of data divided into 1 sec bins. Red curve is a Poisson curve with rate = median count rate of data. |
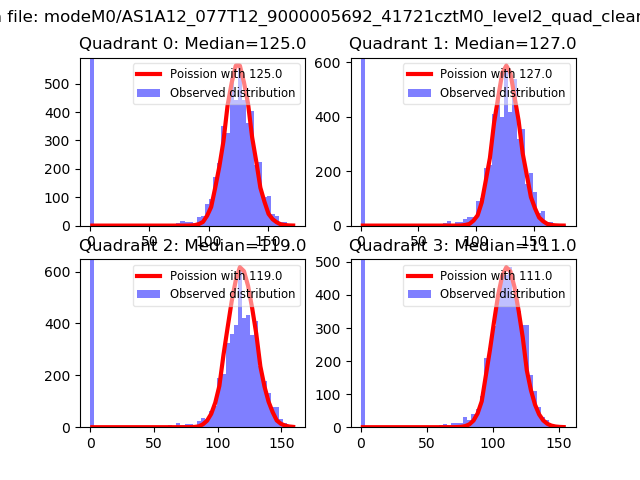 |
 |
| Quadrant-wise count rates Data is divided into 100 sec bins |
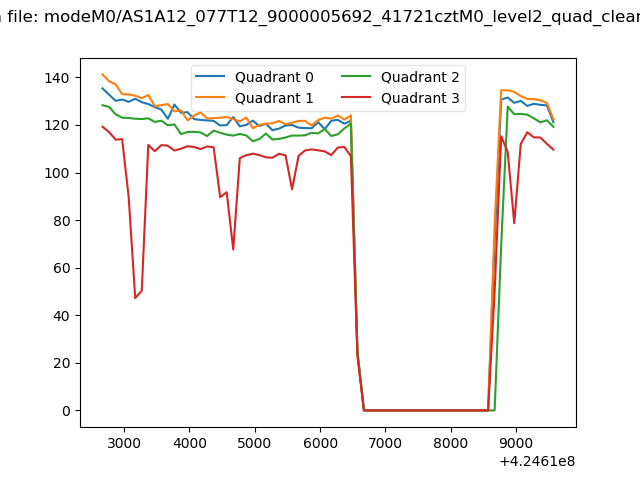 |
|
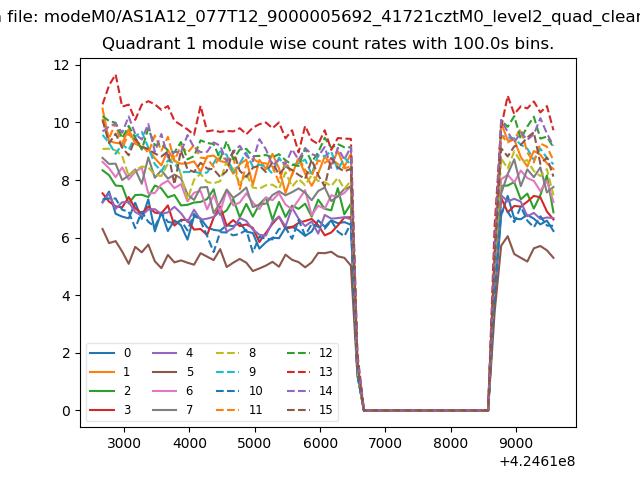
| Module-wise count rates for Quadrant A Data is divided into 100 sec bins |
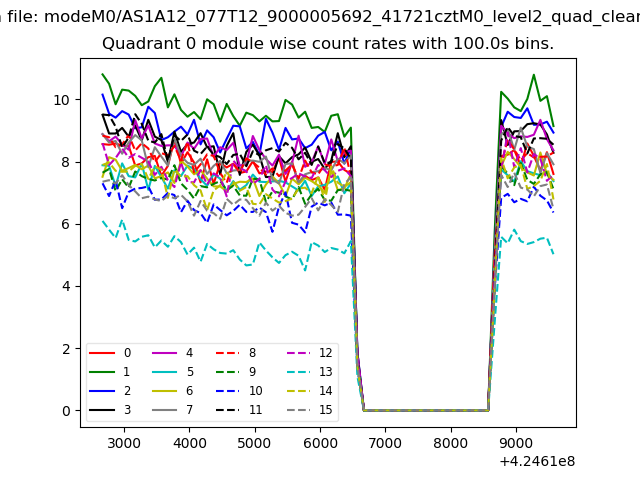 |
 |
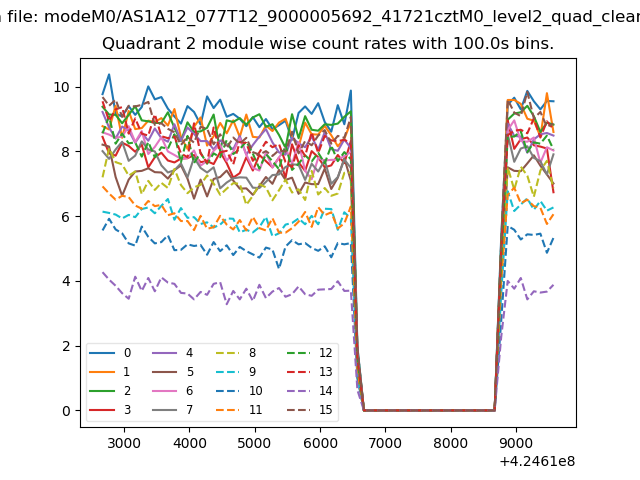
| Module-wise count rates for Quadrant B Data is divided into 100 sec bins |
 |
 |
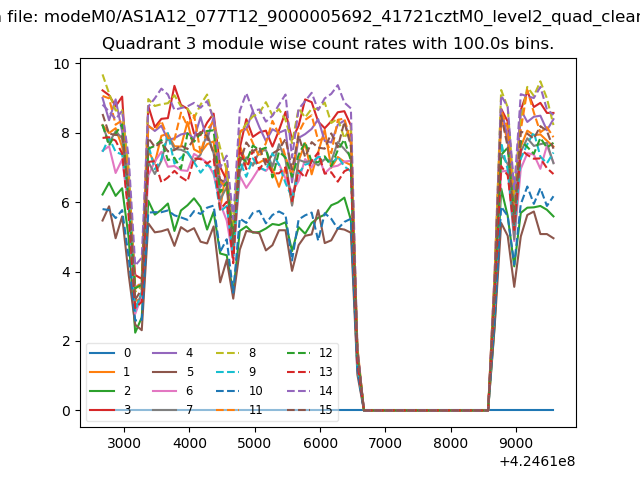
| Module-wise count rates for Quadrant C Data is divided into 100 sec bins |
 |
 |
| Module-wise count rates for Quadrant D Data is divided into 100 sec bins |
 |
 |
| Parameter | Plot |
|---|---|
| CZT HV Monitor | 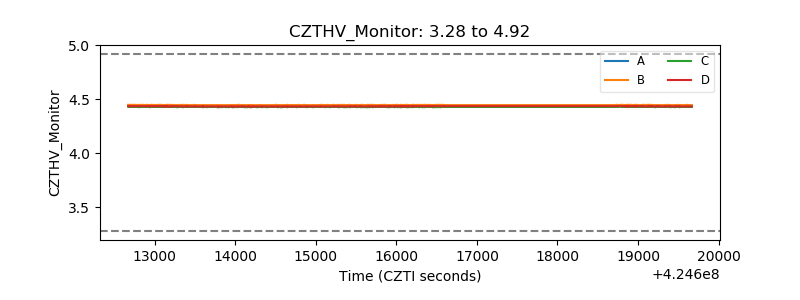 |
| D_VDD | 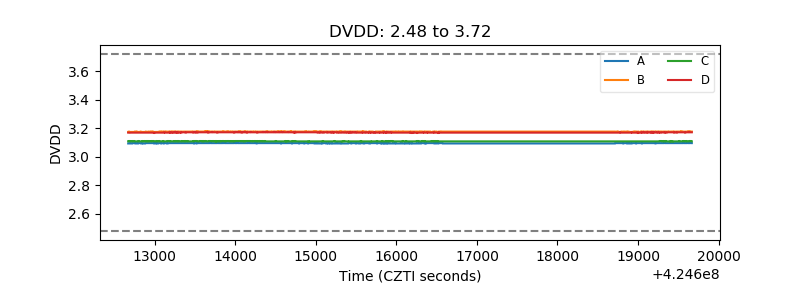 |
| Temperature 1 | 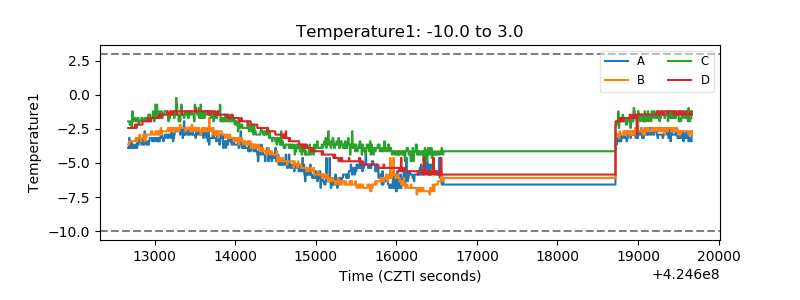 |
| Veto HV Monitor | 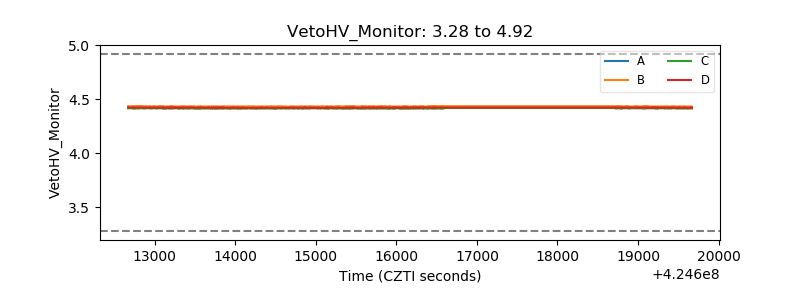 |
| Veto LLD | 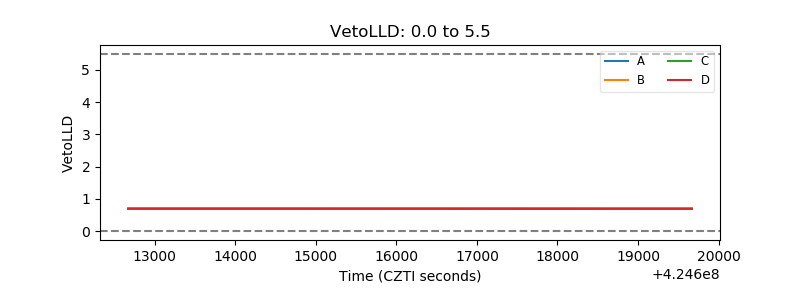 |
| Alpha Counter | 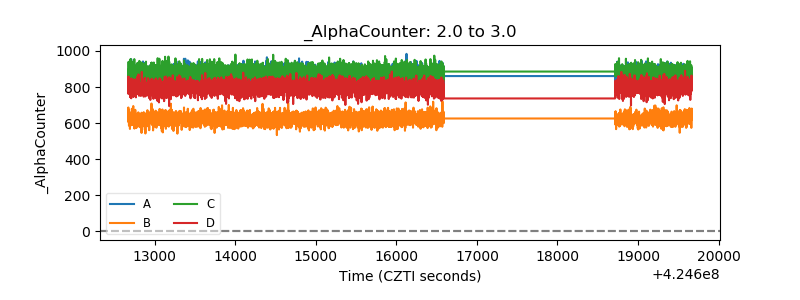 |
| _CPM_Rate | 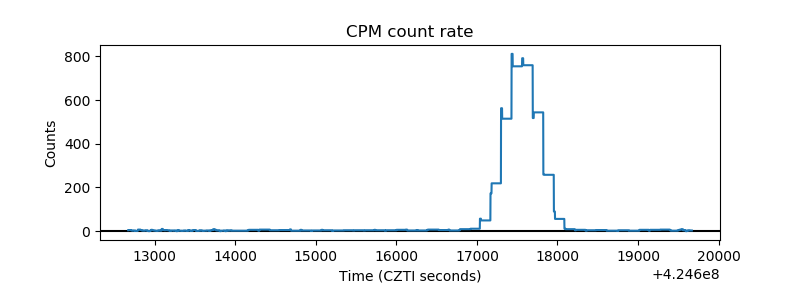 |
| CZT Counter | 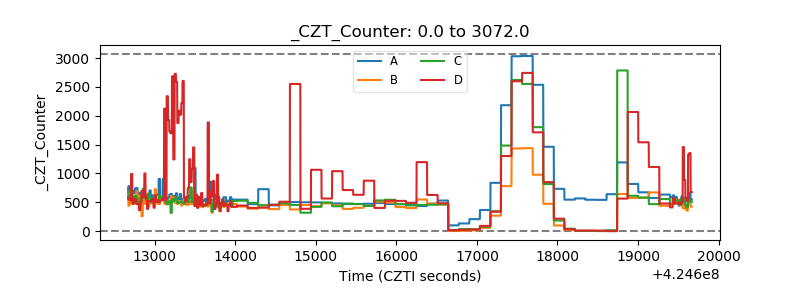 |
| +2.5 Volts monitor | 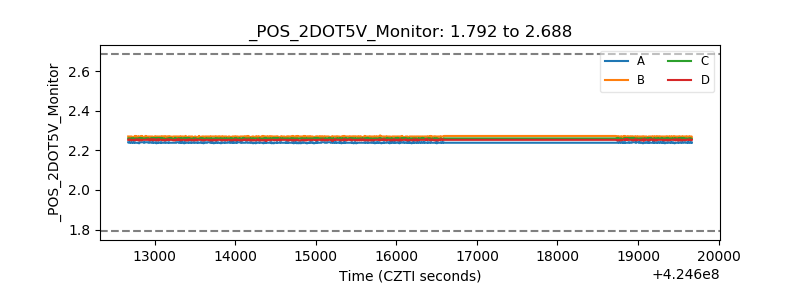 |
| +5 Volts monitor | 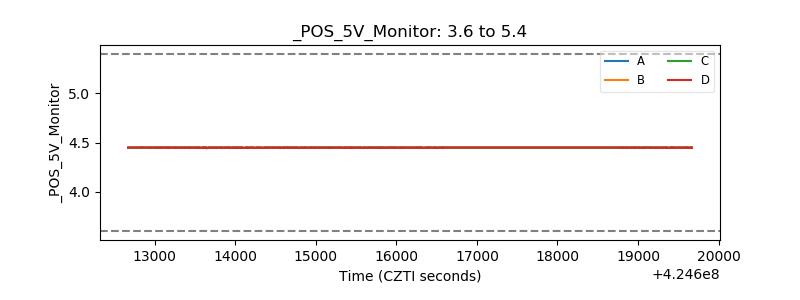 |
| _ROLL_ROT | 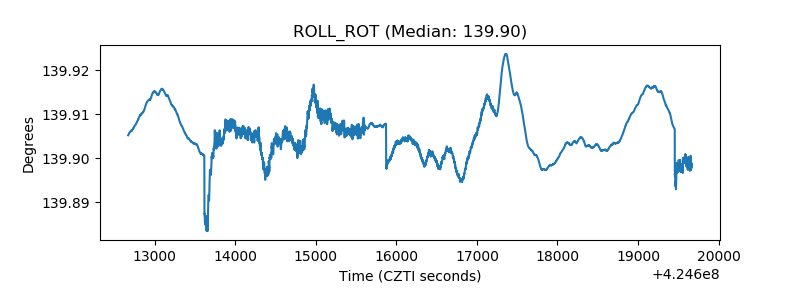 |
| _Roll_DEC | 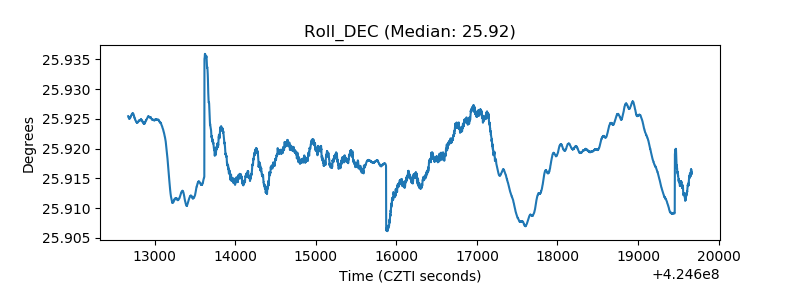 |
| _Roll_RA | 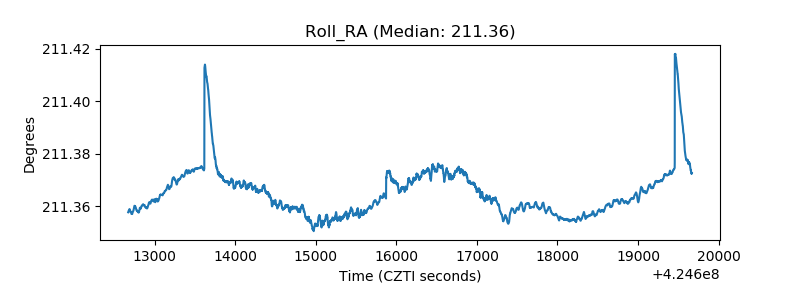 |
| Veto Counter | 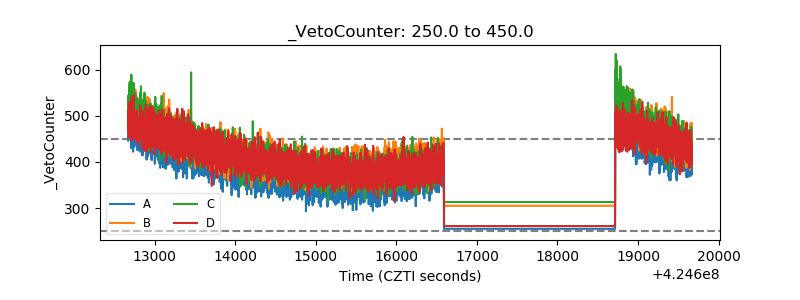 |