| Param | Original file | Final file |
|---|---|---|
| Filename | modeM0/AS1A12_077T12_9000005692_41722cztM0_level2.fits | modeM0/AS1A12_077T12_9000005692_41722cztM0_level2_quad_clean.evt |
| Size (bytes) | 341,202,240 | 88,165,440 |
| Size | 325.4 MB | 84.1 MB |
| Events in quadrant A | 2,830,483 | 609,059 |
| Events in quadrant B | 2,312,636 | 618,376 |
| Events in quadrant C | 2,906,515 | 561,256 |
| Events in quadrant D | 4,188,376 | 528,174 |
| Mode M9 | |||
|---|---|---|---|
| Quadrant | BADHDUFLAG | Total packets | Discarded packets |
| A | 0 | 24 | 0 |
| B | 0 | 24 | 0 |
| C | 0 | 24 | 0 |
| D | 0 | 25 | 0 |
| Mode M0 | |||
|---|---|---|---|
| Quadrant | BADHDUFLAG | Total packets | Discarded packets |
| A | 0 | 11524 | 3 |
| B | 0 | 10252 | 2 |
| C | 0 | 11611 | 2 |
| D | 0 | 15850 | 2 |
| Mode SS | |||
|---|---|---|---|
| Quadrant | BADHDUFLAG | Total packets | Discarded packets |
| A | 0 | 102 | 0 |
| B | 0 | 102 | 0 |
| C | 0 | 102 | 0 |
| D | 0 | 102 | 0 |
| Quadrant | Total seconds | Saturated seconds | Saturation percentage |
|---|---|---|---|
| A | 5036 | 19 | 0.377284% |
| B | 5036 | 8 | 0.158856% |
| C | 5036 | 214 | 4.249404% |
| D | 5036 | 263 | 5.222399% |
Noise dominated data is calculated using 1-second bins in cleaned event files. If a bin has >2000 counts, and if more than 50% of those come from <1% of pixels, then it is considered to be noise-dominated and hence unusable.
| Quadrant | # 1 sec bins | Bins with >0 counts | Bins with >2000 counts | High rate bins dominated by noise | Noise dominated (total time) | Noise dominated (detector-on time) | Marked lightcurve |
|---|---|---|---|---|---|---|---|
| A | 7189 | 5037 | 7 | 7 | 0.10% | 0.14% | 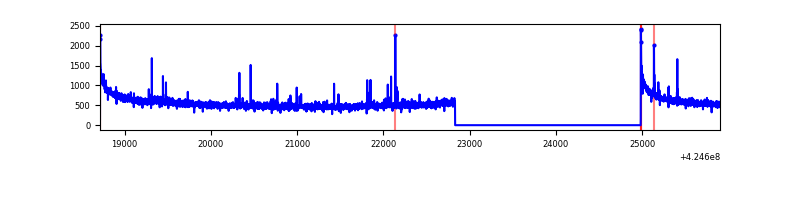 |
| B | 7189 | 5037 | 1 | 1 | 0.01% | 0.02% | 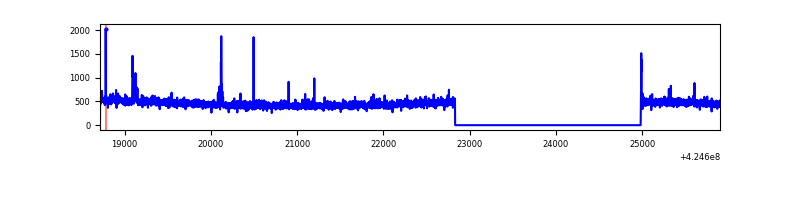 |
| C | 7189 | 5037 | 206 | 206 | 2.87% | 4.09% | 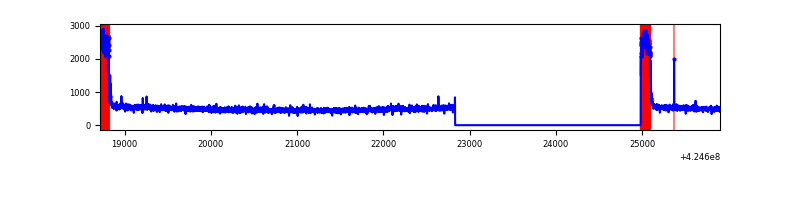 |
| D | 7189 | 5037 | 283 | 283 | 3.94% | 5.62% | 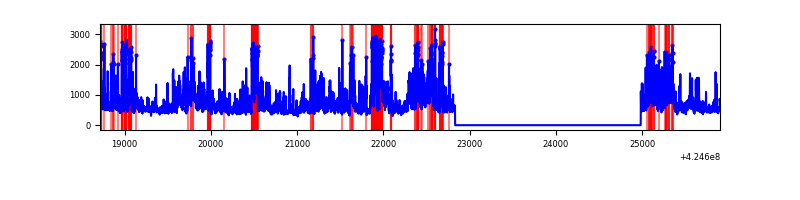 |
Top three noisy pixels from each quadrant. If the there are fewer than three noisy pixels in the level2.evt file, extra rows are filled as -1
| Pixel properties | Quadrant properties | ||||||
|---|---|---|---|---|---|---|---|
| Quadrant | DetID | PixID | Counts | Sigma | Mean | Median | Sigma |
| A | 10 | 83 | 528356 | 4426.88 | 582 | 571 | 119.2 |
| A | 7 | 3 | 37285 | 307.94 | 582 | 571 | 119.2 |
| A | 13 | 248 | 11303 | 90.02 | 582 | 571 | 119.2 |
| B | 5 | 255 | 33890 | 298.01 | 572 | 557 | 111.9 |
| B | 12 | 111 | 13605 | 116.66 | 572 | 557 | 111.9 |
| B | 11 | 111 | 12806 | 109.51 | 572 | 557 | 111.9 |
| C | 0 | 10 | 547320 | 4269.78 | 549 | 553 | 128.1 |
| C | 15 | 214 | 200960 | 1565.01 | 549 | 553 | 128.1 |
| C | 14 | 254 | 9283 | 68.17 | 549 | 553 | 128.1 |
| D | 12 | 79 | 1192578 | 8748.75 | 556 | 543 | 136.3 |
| D | 13 | 249 | 566619 | 4154.62 | 556 | 543 | 136.3 |
| D | 1 | 47 | 115850 | 846.28 | 556 | 543 | 136.3 |
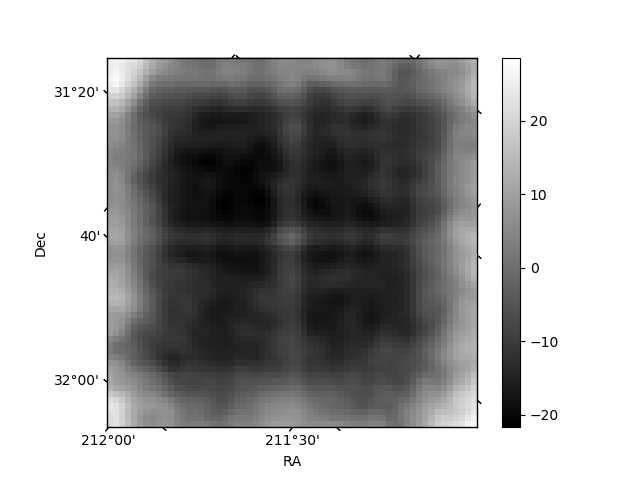
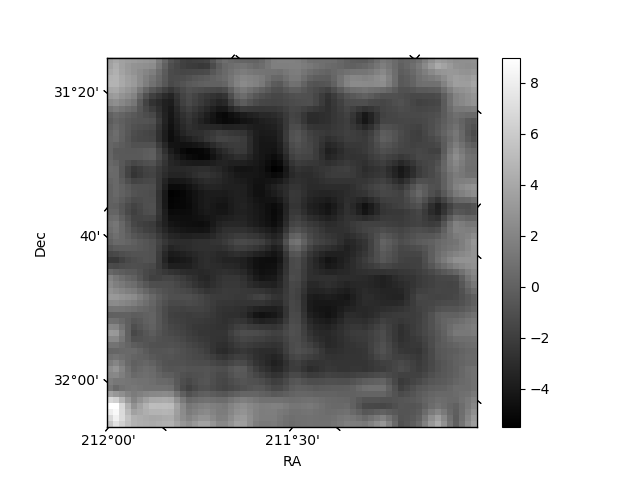
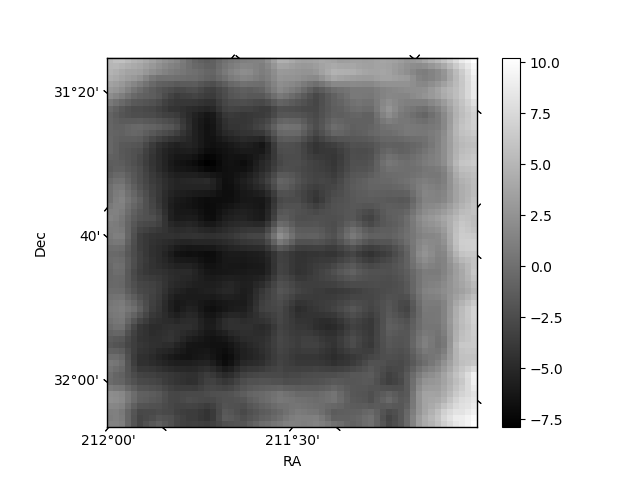
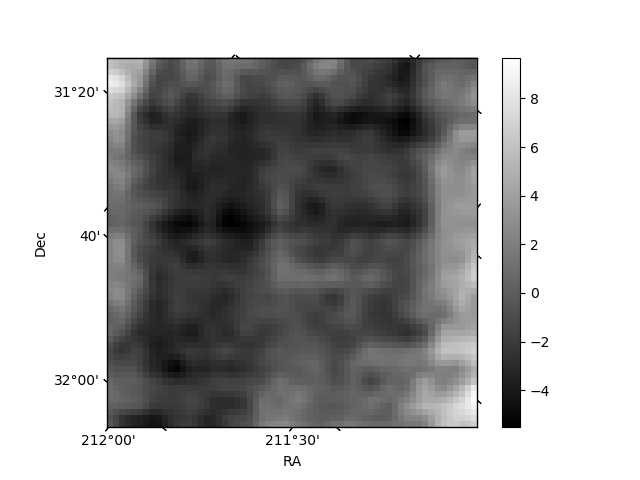
Histogram calculated using DETX and DETY for each event in the final _common_clean file
| Quadrant A | 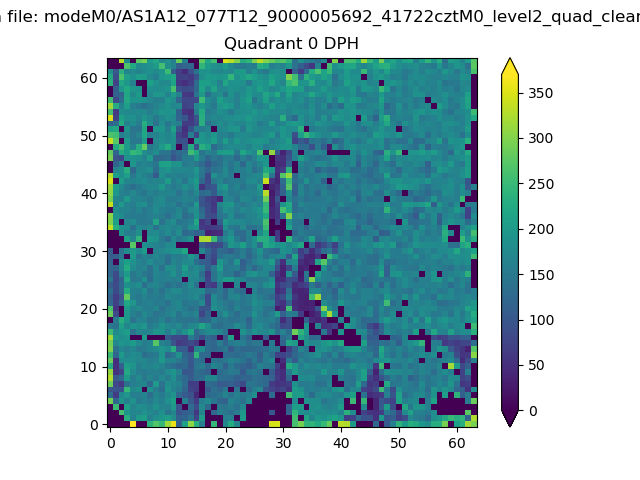 |
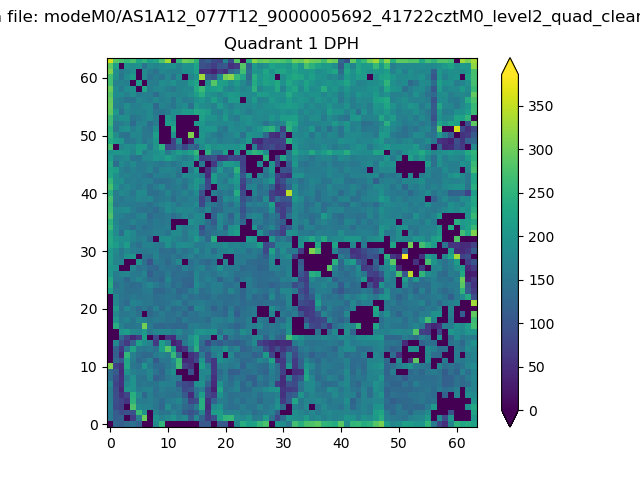 |
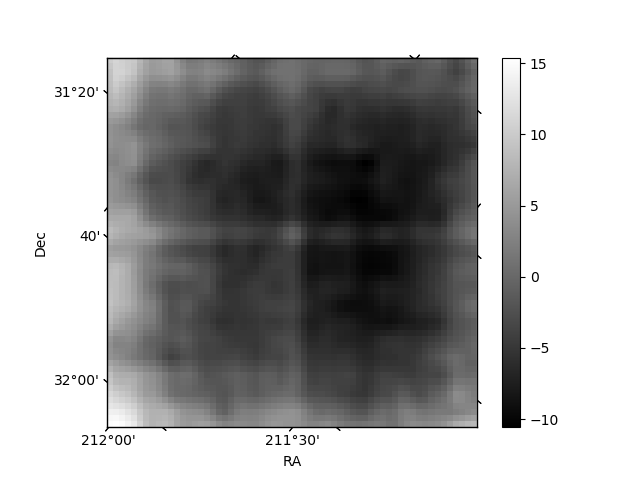
Quadrant B |
|---|---|---|---|
| Quadrant D | 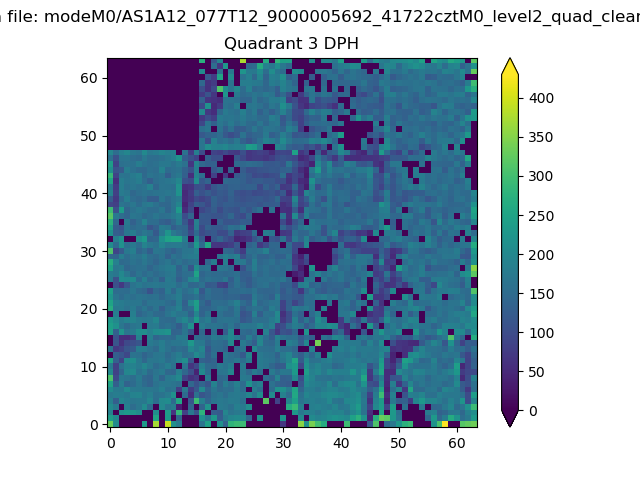 |
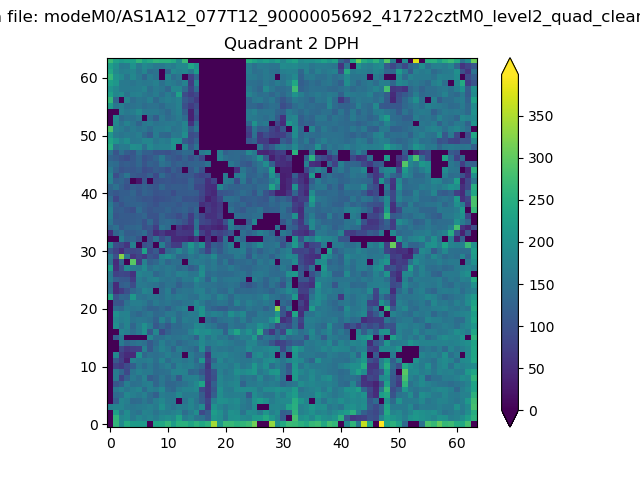 |
Quadrant C |
| Plot type | Count rate plots | Images |
|---|---|---|
| Comparison with Poisson distribution Blue bars denote a histogram of data divided into 1 sec bins. Red curve is a Poisson curve with rate = median count rate of data. |
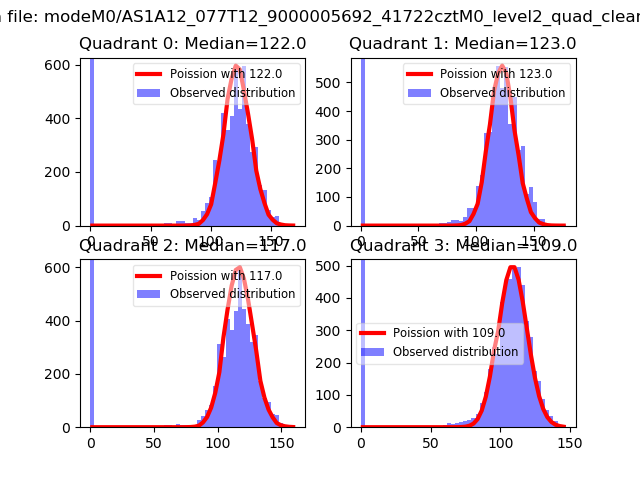 |
 |
| Quadrant-wise count rates Data is divided into 100 sec bins |
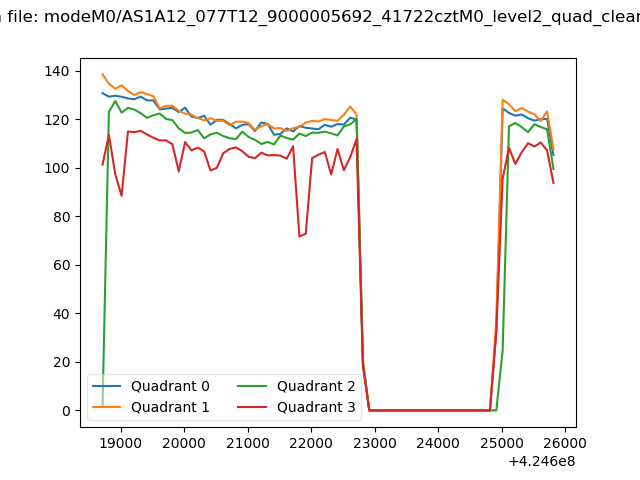 |
|
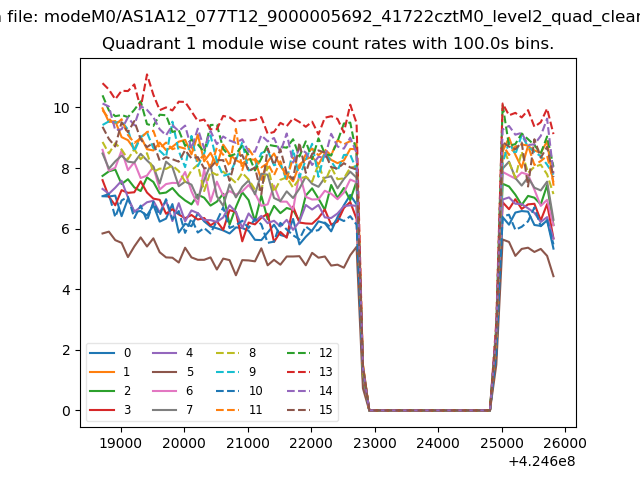
| Module-wise count rates for Quadrant A Data is divided into 100 sec bins |
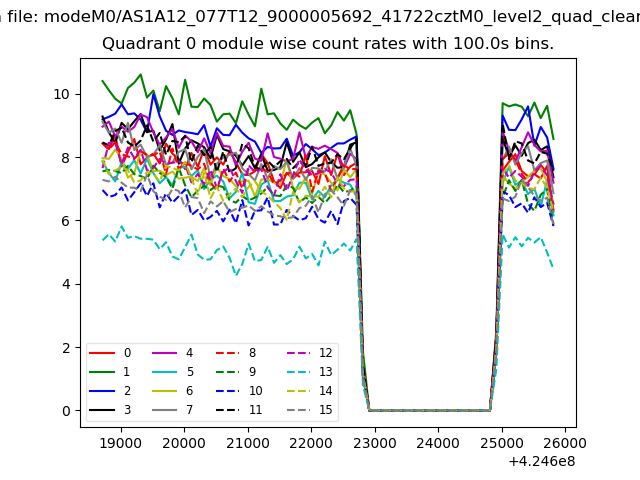 |
 |
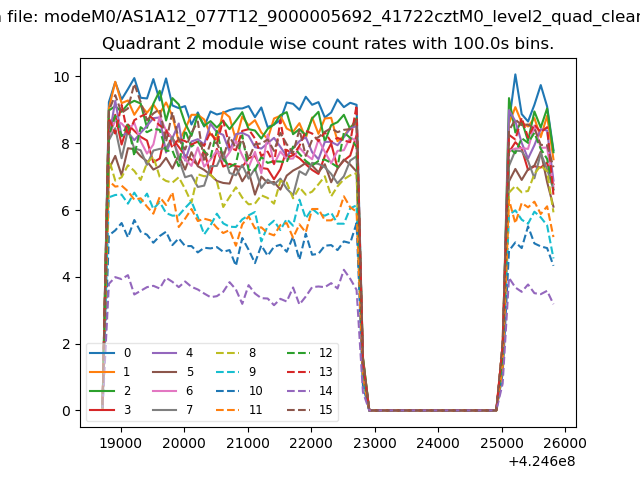
| Module-wise count rates for Quadrant B Data is divided into 100 sec bins |
 |
 |
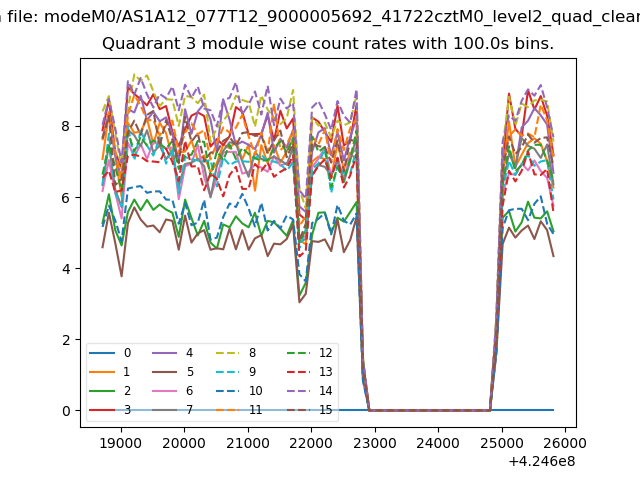
| Module-wise count rates for Quadrant C Data is divided into 100 sec bins |
 |
 |
| Module-wise count rates for Quadrant D Data is divided into 100 sec bins |
 |
 |
| Parameter | Plot |
|---|---|
| CZT HV Monitor | 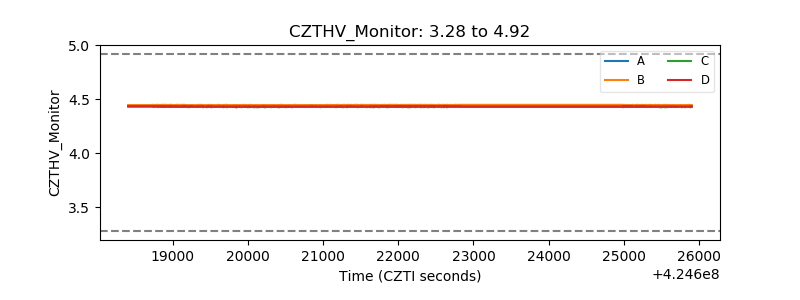 |
| D_VDD | 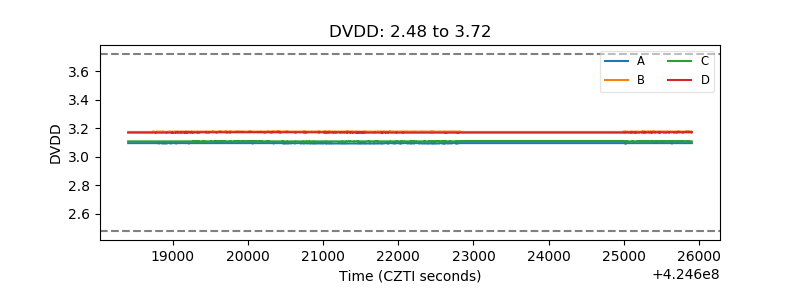 |
| Temperature 1 | 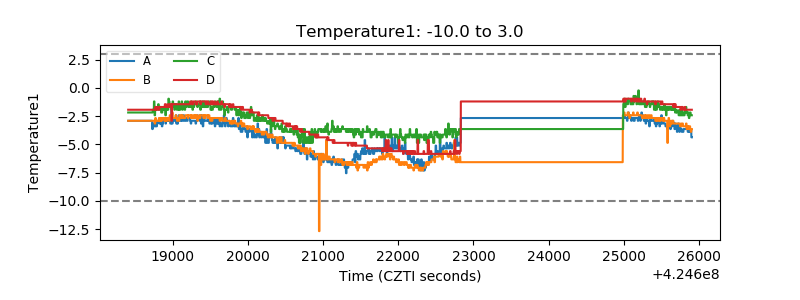 |
| Veto HV Monitor | 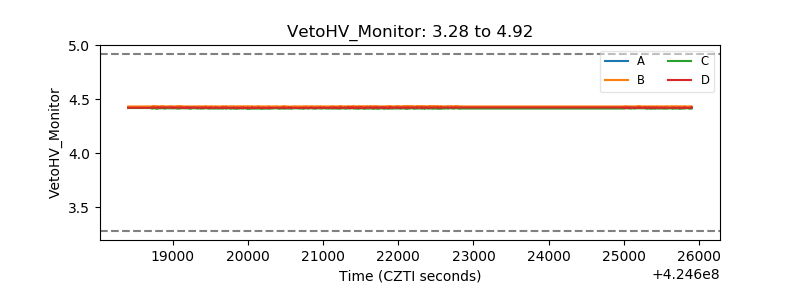 |
| Veto LLD | 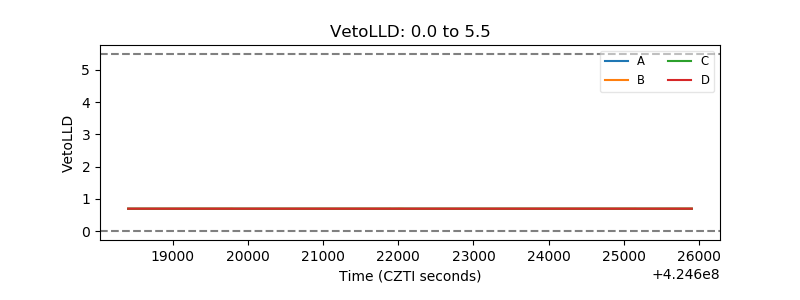 |
| Alpha Counter | 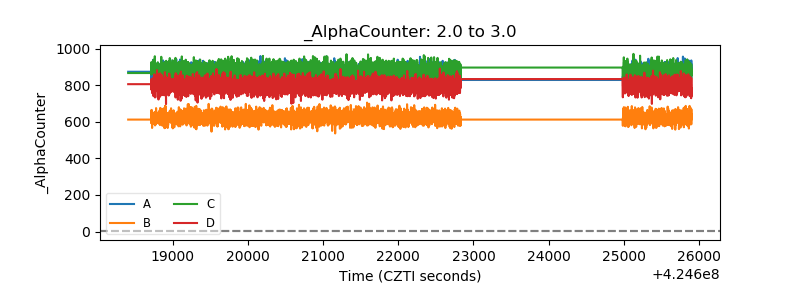 |
| _CPM_Rate | 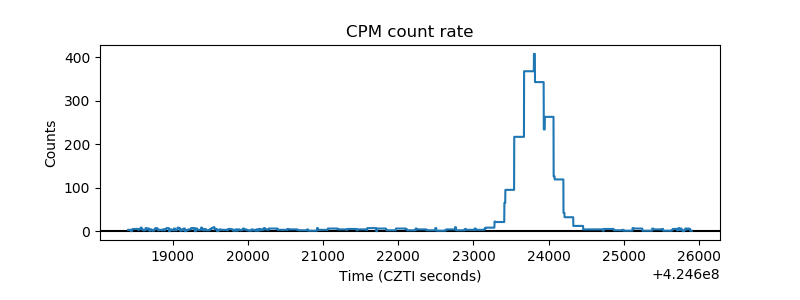 |
| CZT Counter | 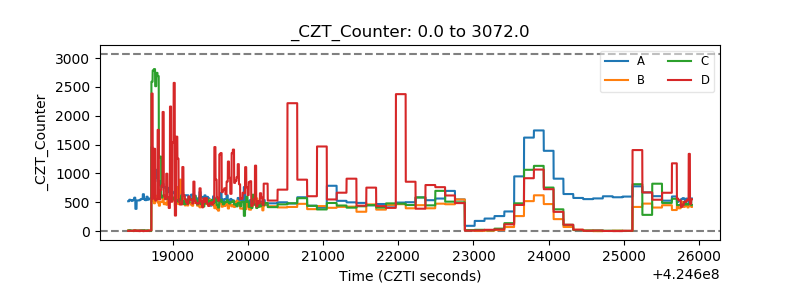 |
| +2.5 Volts monitor | 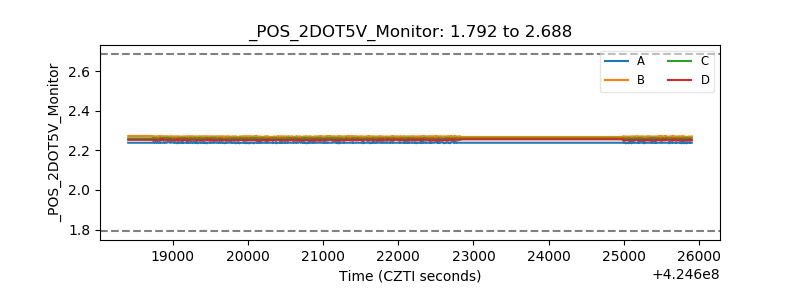 |
| +5 Volts monitor | 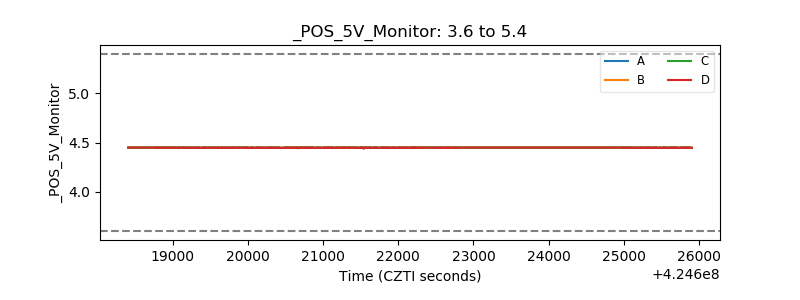 |
| _ROLL_ROT | 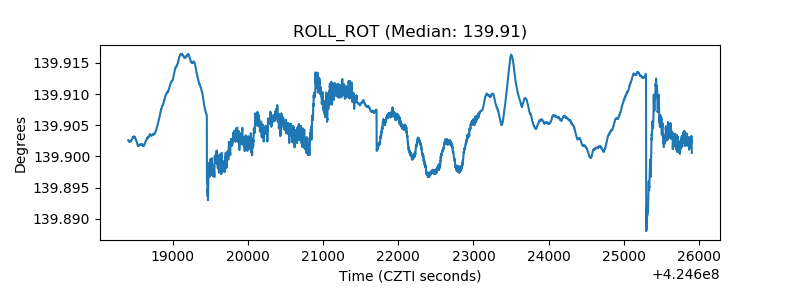 |
| _Roll_DEC | 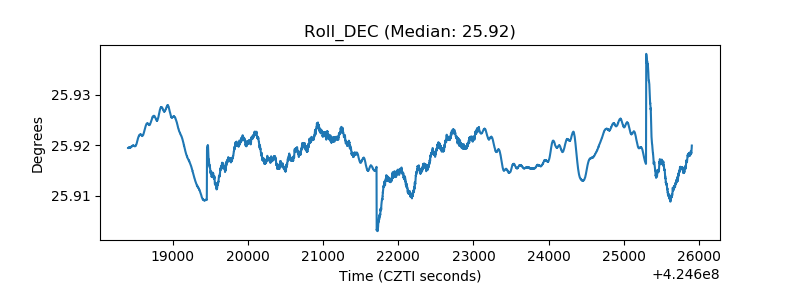 |
| _Roll_RA | 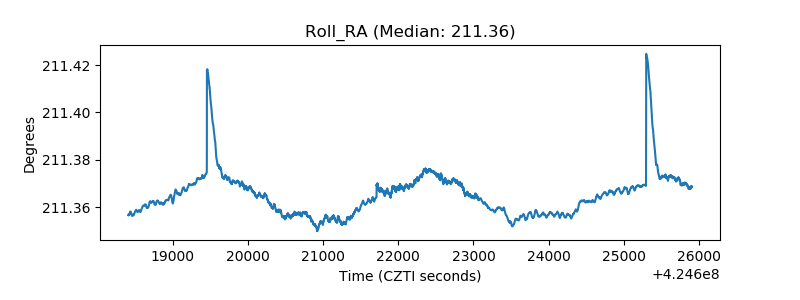 |
| Veto Counter | 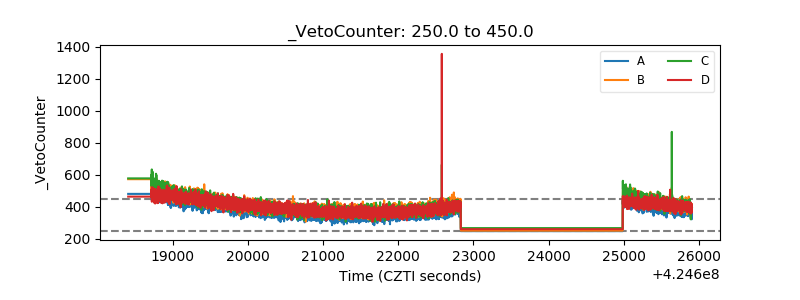 |