| Param | Original file | Final file |
|---|---|---|
| Filename | modeM0/AS1A12_077T12_9000005692_41723cztM0_level2.fits | modeM0/AS1A12_077T12_9000005692_41723cztM0_level2_quad_clean.evt |
| Size (bytes) | 317,580,480 | 84,268,800 |
| Size | 302.9 MB | 80.4 MB |
| Events in quadrant A | 2,758,275 | 573,853 |
| Events in quadrant B | 2,444,031 | 582,596 |
| Events in quadrant C | 2,813,183 | 533,642 |
| Events in quadrant D | 3,351,745 | 512,393 |
| Mode M9 | |||
|---|---|---|---|
| Quadrant | BADHDUFLAG | Total packets | Discarded packets |
| A | 0 | 22 | 0 |
| B | 0 | 22 | 0 |
| C | 0 | 23 | 0 |
| D | 0 | 23 | 0 |
| Mode M0 | |||
|---|---|---|---|
| Quadrant | BADHDUFLAG | Total packets | Discarded packets |
| A | 0 | 11248 | 2 |
| B | 0 | 10805 | 2 |
| C | 0 | 11488 | 2 |
| D | 0 | 13457 | 2 |
| Mode SS | |||
|---|---|---|---|
| Quadrant | BADHDUFLAG | Total packets | Discarded packets |
| A | 0 | 100 | 0 |
| B | 0 | 100 | 0 |
| C | 0 | 100 | 0 |
| D | 0 | 100 | 0 |
| Quadrant | Total seconds | Saturated seconds | Saturation percentage |
|---|---|---|---|
| A | 4985 | 17 | 0.341023% |
| B | 4985 | 30 | 0.601805% |
| C | 4985 | 217 | 4.353059% |
| D | 4985 | 146 | 2.928786% |
Noise dominated data is calculated using 1-second bins in cleaned event files. If a bin has >2000 counts, and if more than 50% of those come from <1% of pixels, then it is considered to be noise-dominated and hence unusable.
| Quadrant | # 1 sec bins | Bins with >0 counts | Bins with >2000 counts | High rate bins dominated by noise | Noise dominated (total time) | Noise dominated (detector-on time) | Marked lightcurve |
|---|---|---|---|---|---|---|---|
| A | 7018 | 4986 | 6 | 6 | 0.09% | 0.12% | 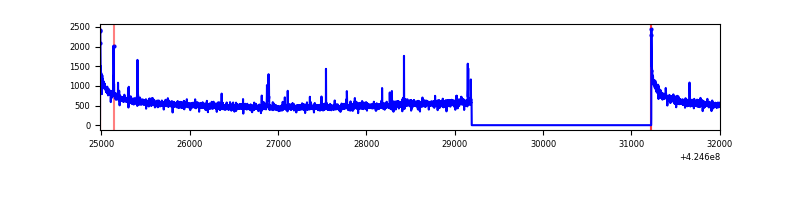 |
| B | 7018 | 4986 | 15 | 15 | 0.21% | 0.30% | 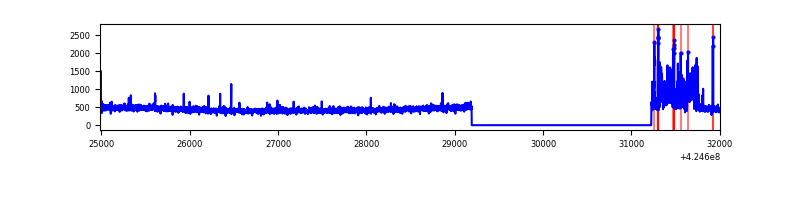 |
| C | 7018 | 4986 | 206 | 206 | 2.94% | 4.13% | 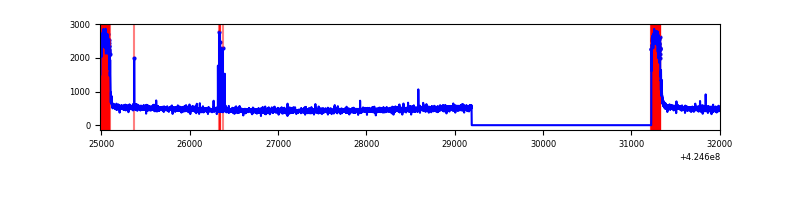 |
| D | 7018 | 4986 | 142 | 142 | 2.02% | 2.85% | 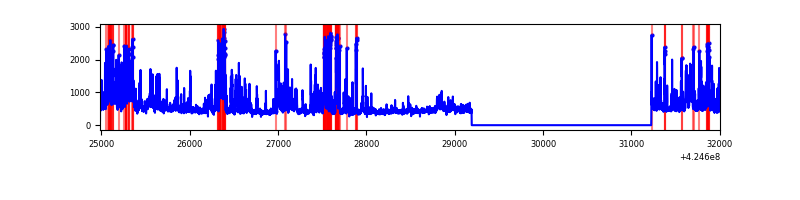 |
Top three noisy pixels from each quadrant. If the there are fewer than three noisy pixels in the level2.evt file, extra rows are filled as -1
| Pixel properties | Quadrant properties | ||||||
|---|---|---|---|---|---|---|---|
| Quadrant | DetID | PixID | Counts | Sigma | Mean | Median | Sigma |
| A | 10 | 83 | 522148 | 4541.81 | 554 | 543 | 114.8 |
| A | 15 | 223 | 46876 | 403.44 | 554 | 543 | 114.8 |
| A | 7 | 3 | 33045 | 283.01 | 554 | 543 | 114.8 |
| B | 0 | 186 | 162308 | 1496.49 | 548 | 532 | 108.1 |
| B | 4 | 141 | 84798 | 779.49 | 548 | 532 | 108.1 |
| B | 15 | 35 | 27334 | 247.93 | 548 | 532 | 108.1 |
| C | 0 | 10 | 520920 | 4163.58 | 527 | 531 | 125.0 |
| C | 15 | 214 | 199296 | 1590.3 | 527 | 531 | 125.0 |
| C | 14 | 254 | 27161 | 213.06 | 527 | 531 | 125.0 |
| D | 12 | 79 | 884318 | 6712.01 | 538 | 524 | 131.7 |
| D | 13 | 249 | 291935 | 2213.13 | 538 | 524 | 131.7 |
| D | 10 | 199 | 51003 | 383.36 | 538 | 524 | 131.7 |
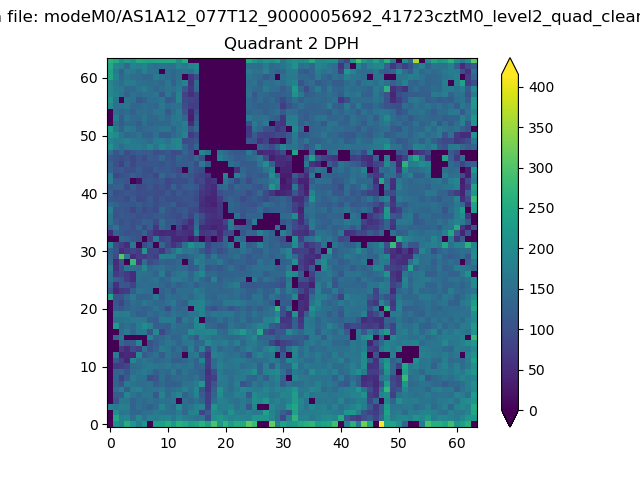
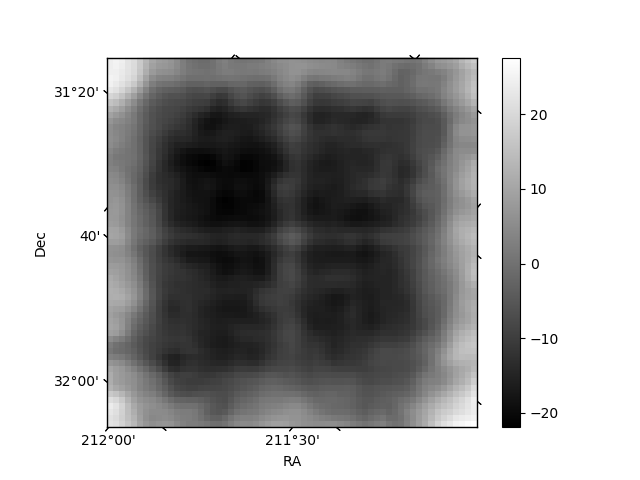
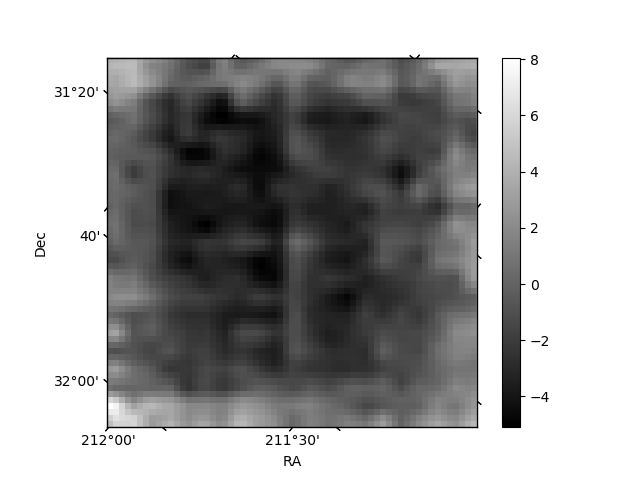
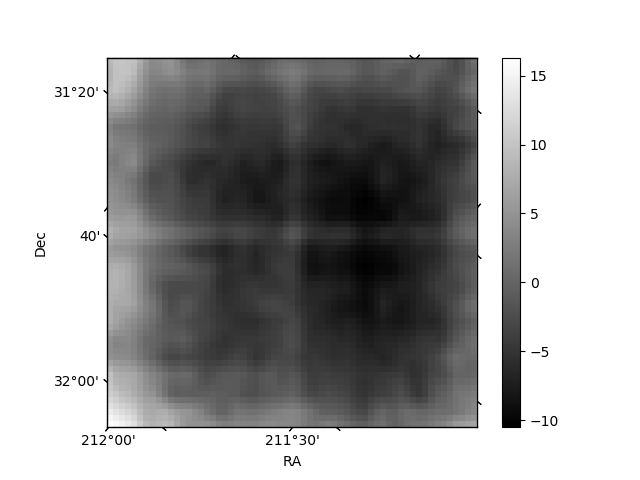
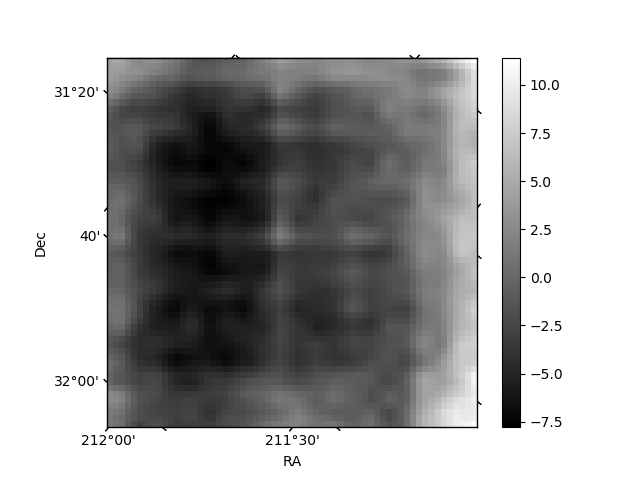
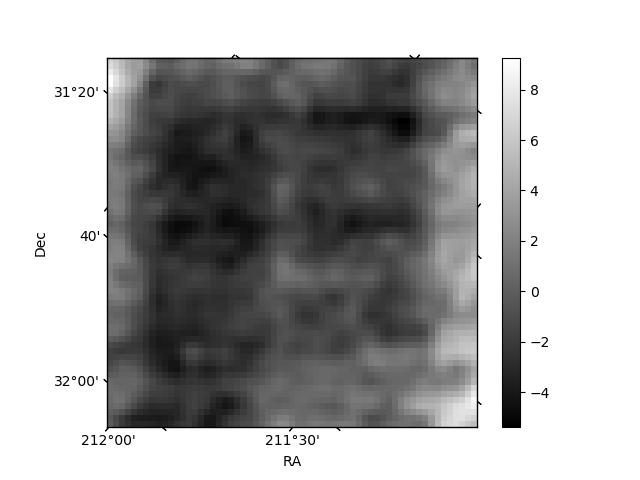
Histogram calculated using DETX and DETY for each event in the final _common_clean file
| Quadrant A | 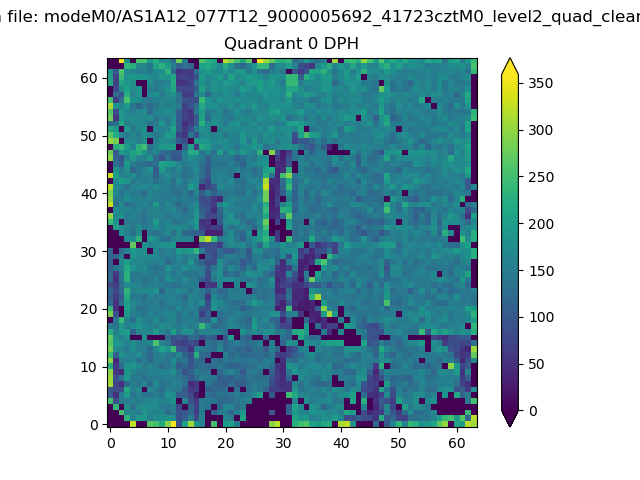 |
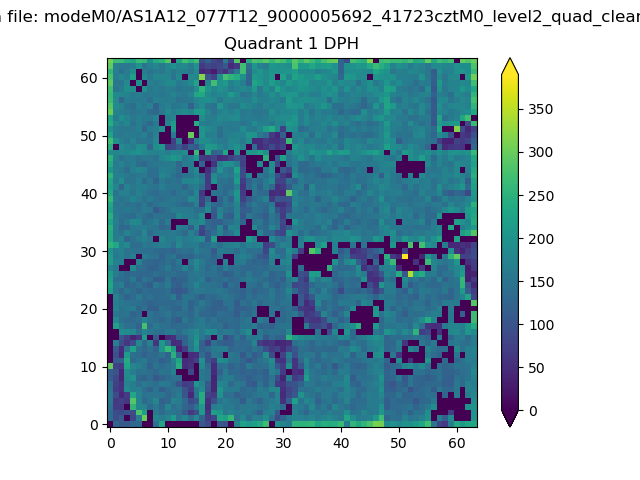 |
Quadrant B |
|---|---|---|---|
| Quadrant D | 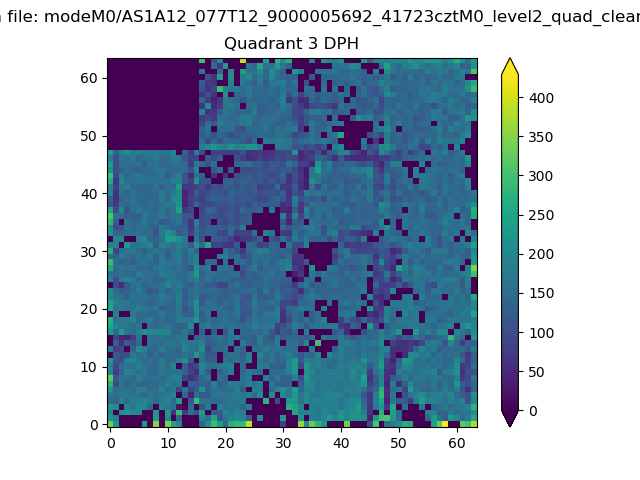 |
 |
Quadrant C |
| Plot type | Count rate plots | Images |
|---|---|---|
| Comparison with Poisson distribution Blue bars denote a histogram of data divided into 1 sec bins. Red curve is a Poisson curve with rate = median count rate of data. |
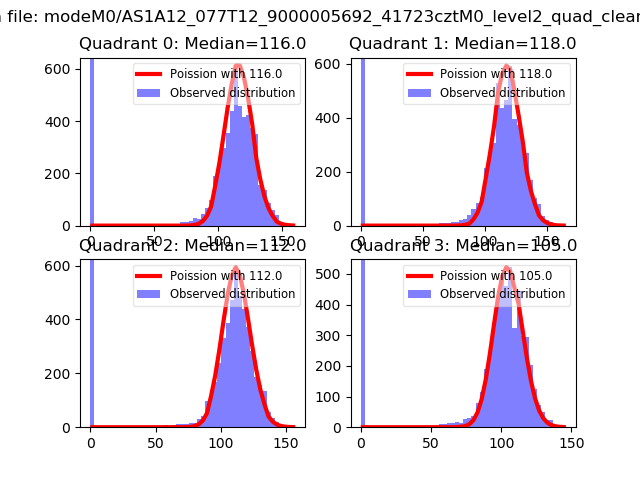 |
 |
| Quadrant-wise count rates Data is divided into 100 sec bins |
 |
|
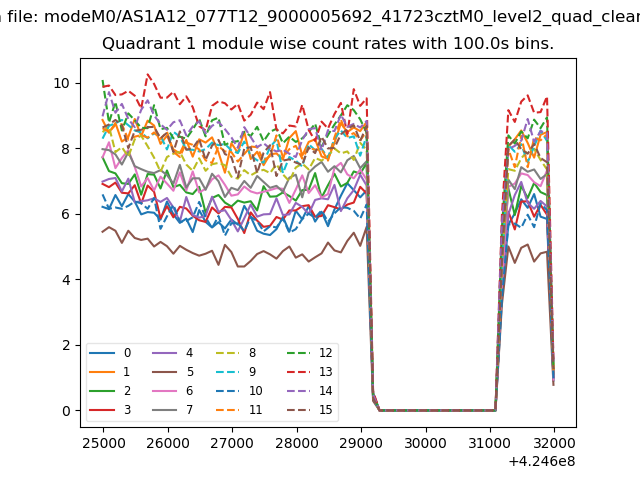
| Module-wise count rates for Quadrant A Data is divided into 100 sec bins |
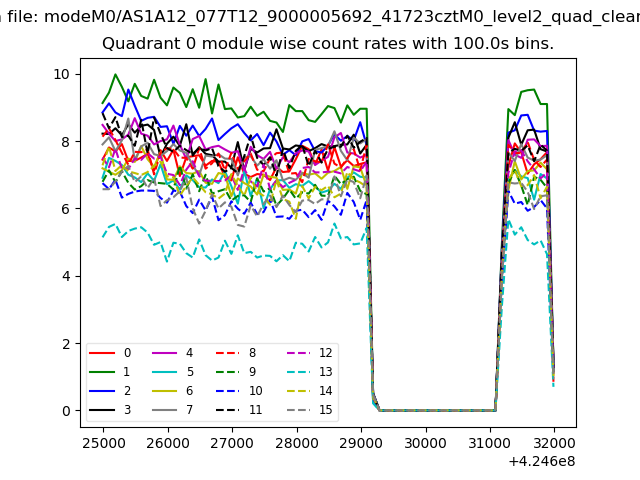 |
 |
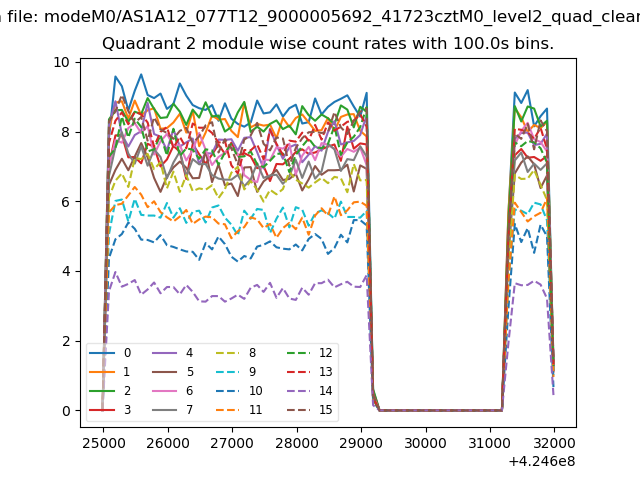
| Module-wise count rates for Quadrant B Data is divided into 100 sec bins |
 |
 |
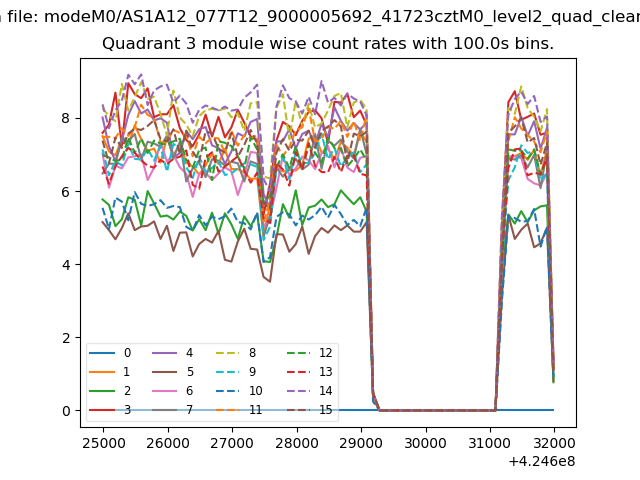
| Module-wise count rates for Quadrant C Data is divided into 100 sec bins |
 |
 |
| Module-wise count rates for Quadrant D Data is divided into 100 sec bins |
 |
 |
| Parameter | Plot |
|---|---|
| CZT HV Monitor |  |
| D_VDD | 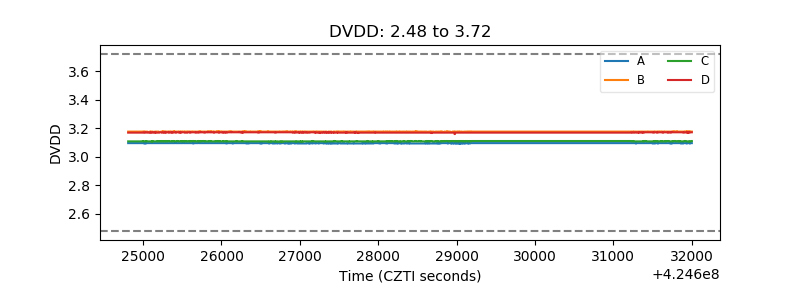 |
| Temperature 1 |  |
| Veto HV Monitor | 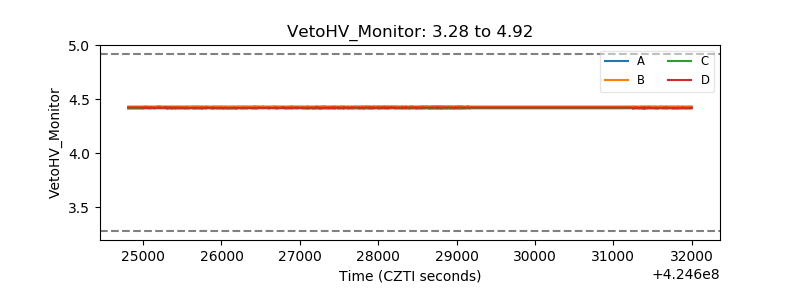 |
| Veto LLD | 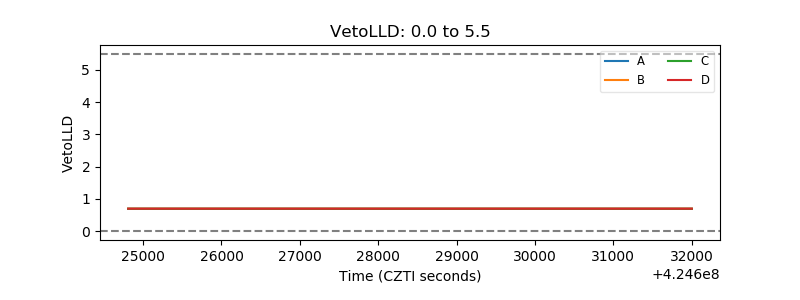 |
| Alpha Counter | 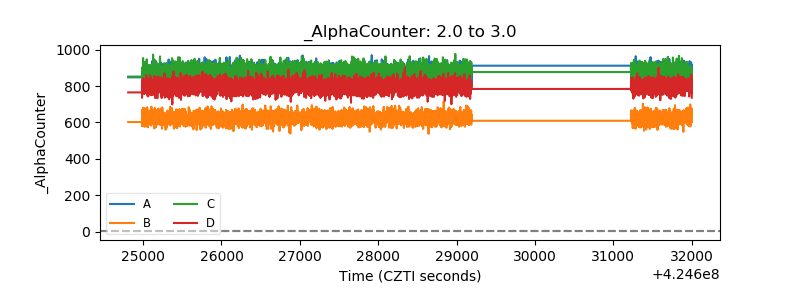 |
| _CPM_Rate | 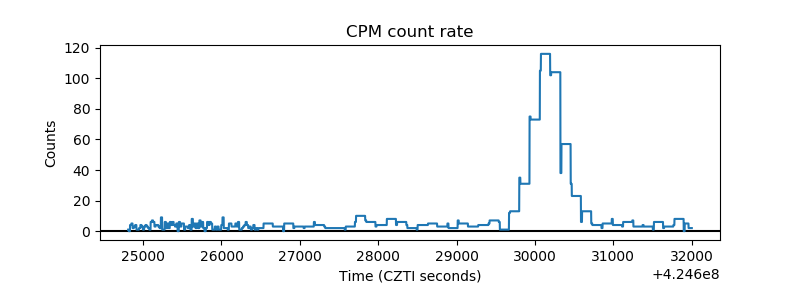 |
| CZT Counter | 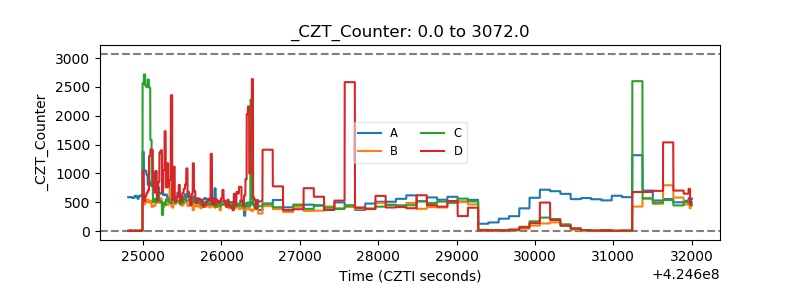 |
| +2.5 Volts monitor | 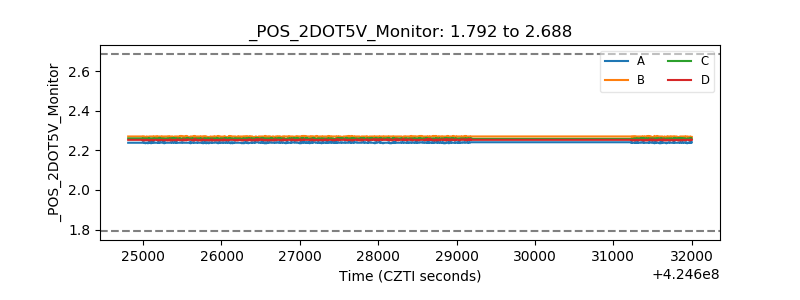 |
| +5 Volts monitor | 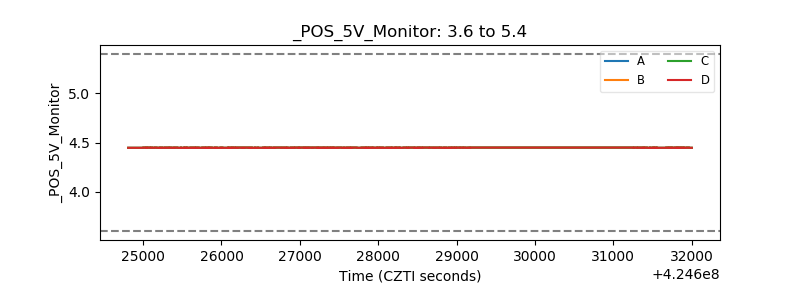 |
| _ROLL_ROT |  |
| _Roll_DEC | 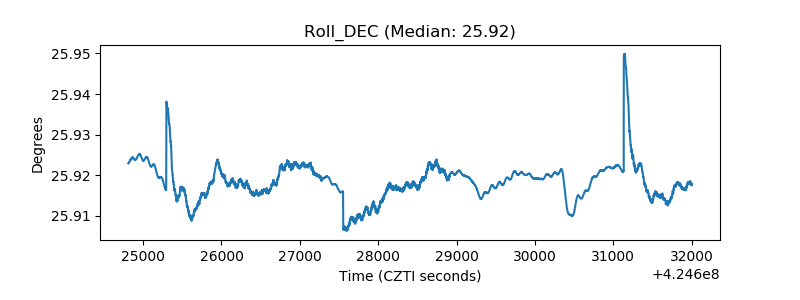 |
| _Roll_RA | 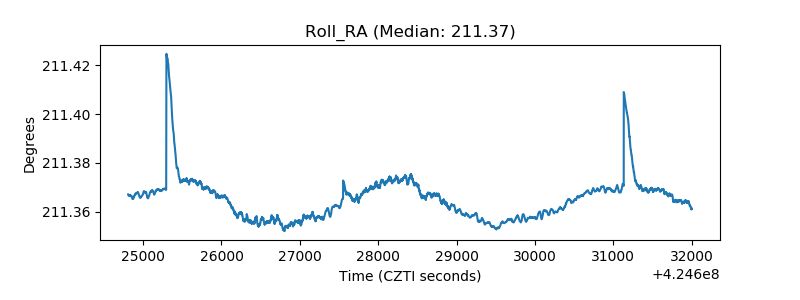 |
| Veto Counter | 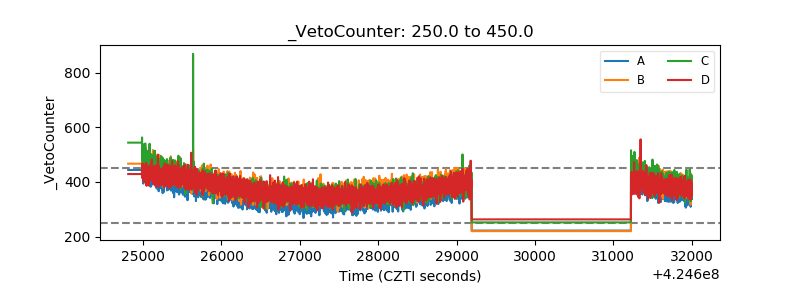 |