| Param | Original file | Final file |
|---|---|---|
| Filename | modeM0/AS1A12_077T12_9000005692_41724cztM0_level2.fits | modeM0/AS1A12_077T12_9000005692_41724cztM0_level2_quad_clean.evt |
| Size (bytes) | 314,130,240 | 85,965,120 |
| Size | 299.6 MB | 82.0 MB |
| Events in quadrant A | 2,891,198 | 577,378 |
| Events in quadrant B | 2,613,282 | 589,567 |
| Events in quadrant C | 2,868,915 | 545,711 |
| Events in quadrant D | 2,846,437 | 523,908 |
| Mode M9 | |||
|---|---|---|---|
| Quadrant | BADHDUFLAG | Total packets | Discarded packets |
| A | 0 | 28 | 0 |
| B | 0 | 28 | 0 |
| C | 0 | 28 | 0 |
| D | 0 | 29 | 0 |
| Mode M0 | |||
|---|---|---|---|
| Quadrant | BADHDUFLAG | Total packets | Discarded packets |
| A | 0 | 11865 | 3 |
| B | 0 | 11557 | 2 |
| C | 0 | 11927 | 2 |
| D | 0 | 12358 | 2 |
| Mode SS | |||
|---|---|---|---|
| Quadrant | BADHDUFLAG | Total packets | Discarded packets |
| A | 0 | 106 | 0 |
| B | 0 | 106 | 0 |
| C | 0 | 106 | 0 |
| D | 0 | 106 | 0 |
| Quadrant | Total seconds | Saturated seconds | Saturation percentage |
|---|---|---|---|
| A | 5235 | 40 | 0.764088% |
| B | 5235 | 54 | 1.031519% |
| C | 5235 | 203 | 3.877746% |
| D | 5235 | 77 | 1.470869% |
Noise dominated data is calculated using 1-second bins in cleaned event files. If a bin has >2000 counts, and if more than 50% of those come from <1% of pixels, then it is considered to be noise-dominated and hence unusable.
| Quadrant | # 1 sec bins | Bins with >0 counts | Bins with >2000 counts | High rate bins dominated by noise | Noise dominated (total time) | Noise dominated (detector-on time) | Marked lightcurve |
|---|---|---|---|---|---|---|---|
| A | 7028 | 5236 | 35 | 35 | 0.50% | 0.67% | 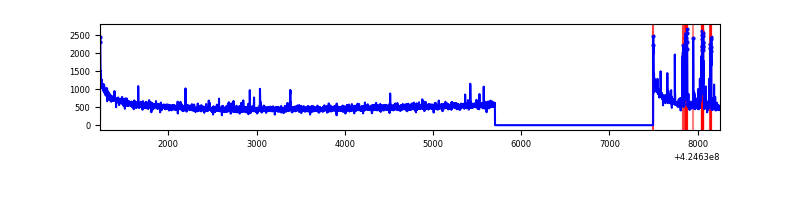 |
| B | 7028 | 5236 | 41 | 41 | 0.58% | 0.78% | 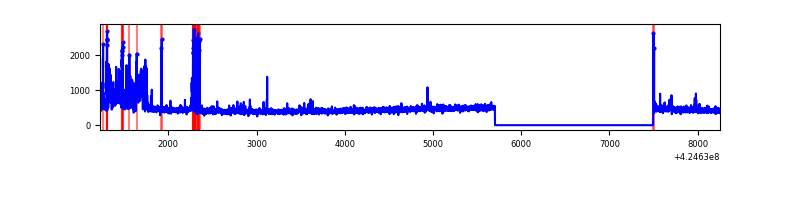 |
| C | 7028 | 5236 | 189 | 189 | 2.69% | 3.61% | 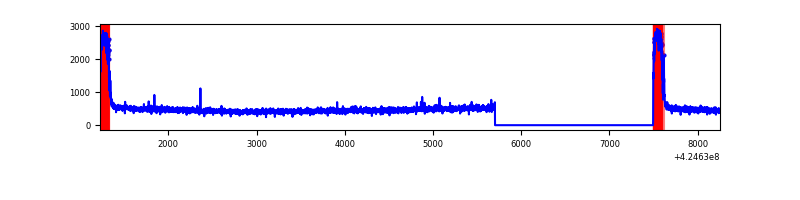 |
| D | 7028 | 5236 | 87 | 87 | 1.24% | 1.66% | 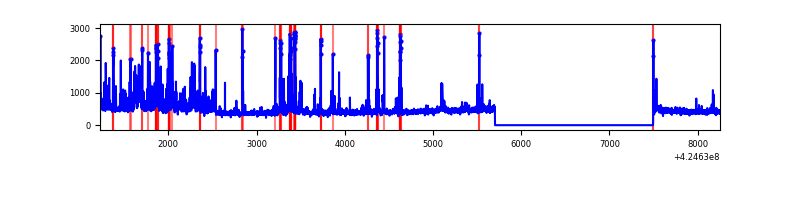 |
Top three noisy pixels from each quadrant. If the there are fewer than three noisy pixels in the level2.evt file, extra rows are filled as -1
| Pixel properties | Quadrant properties | ||||||
|---|---|---|---|---|---|---|---|
| Quadrant | DetID | PixID | Counts | Sigma | Mean | Median | Sigma |
| A | 10 | 83 | 526232 | 4455.13 | 568 | 557 | 118.0 |
| A | 2 | 79 | 130974 | 1105.29 | 568 | 557 | 118.0 |
| A | 7 | 3 | 29038 | 241.38 | 568 | 557 | 118.0 |
| B | 0 | 186 | 175178 | 1579.16 | 565 | 550 | 110.6 |
| B | 4 | 141 | 171872 | 1549.27 | 565 | 550 | 110.6 |
| B | 15 | 35 | 22481 | 198.32 | 565 | 550 | 110.6 |
| C | 0 | 10 | 530381 | 4139.48 | 542 | 545 | 128.0 |
| C | 15 | 214 | 208357 | 1623.58 | 542 | 545 | 128.0 |
| C | 14 | 67 | 15896 | 119.93 | 542 | 545 | 128.0 |
| D | 12 | 79 | 395146 | 2922.51 | 553 | 538 | 135.0 |
| D | 13 | 249 | 228454 | 1687.97 | 553 | 538 | 135.0 |
| D | 12 | 217 | 23856 | 172.7 | 553 | 538 | 135.0 |
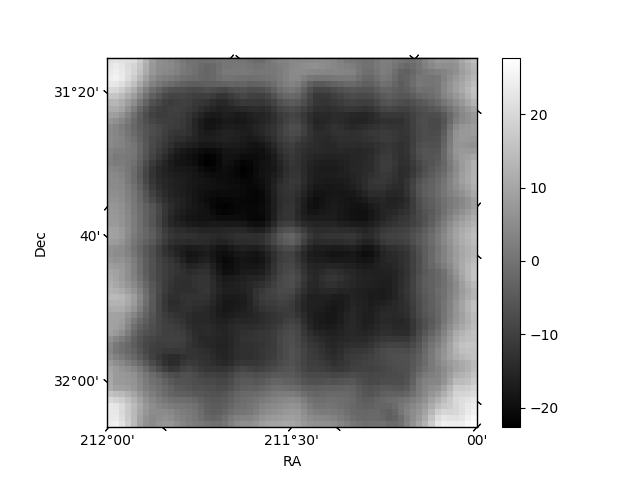
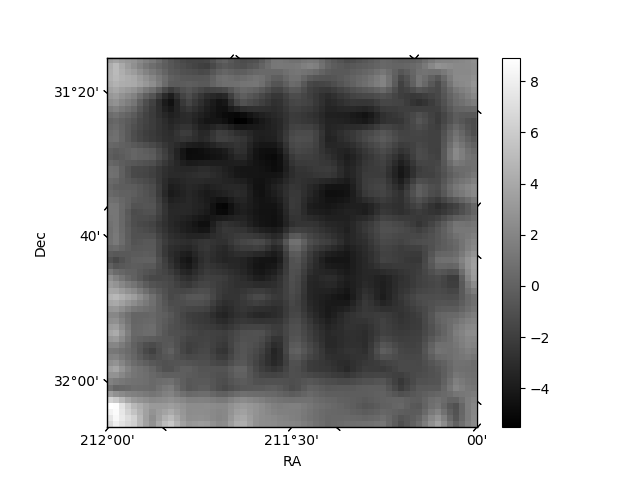
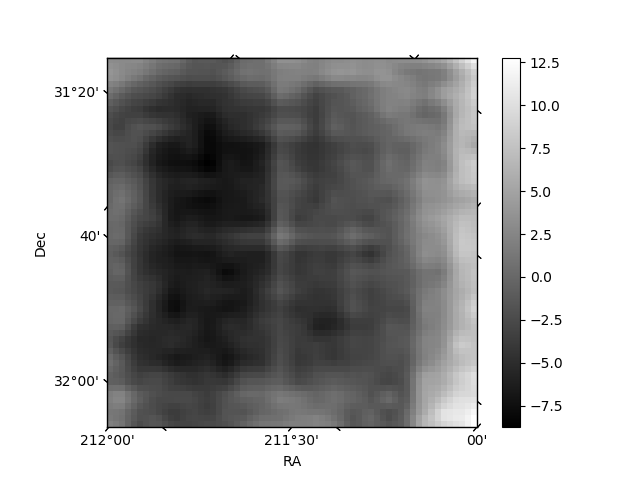
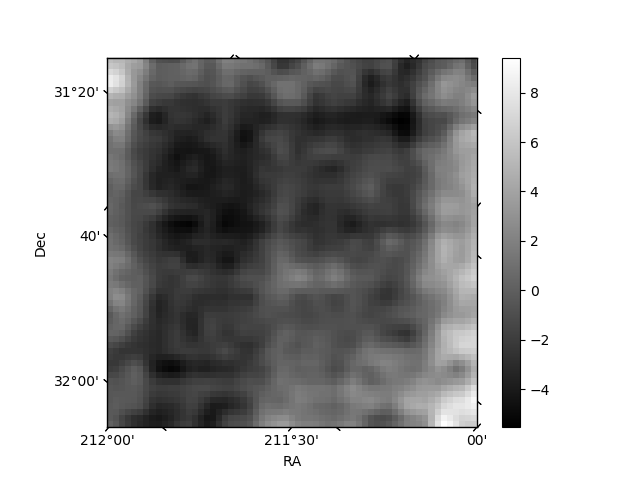
Histogram calculated using DETX and DETY for each event in the final _common_clean file
| Quadrant A | 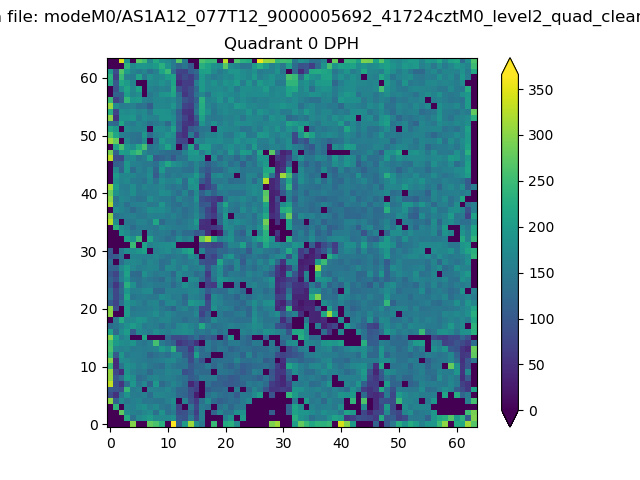 |
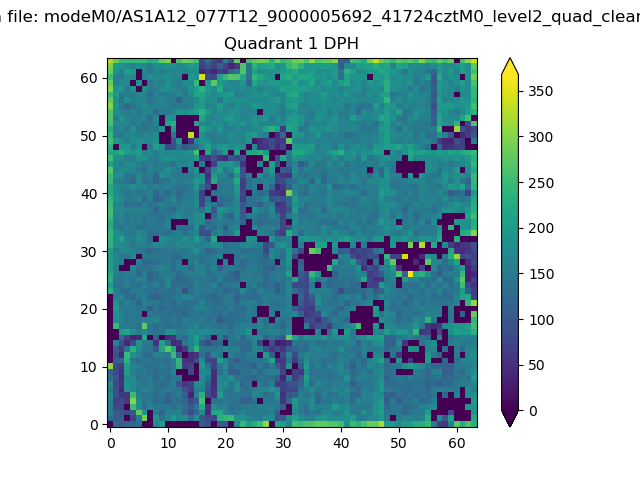 |
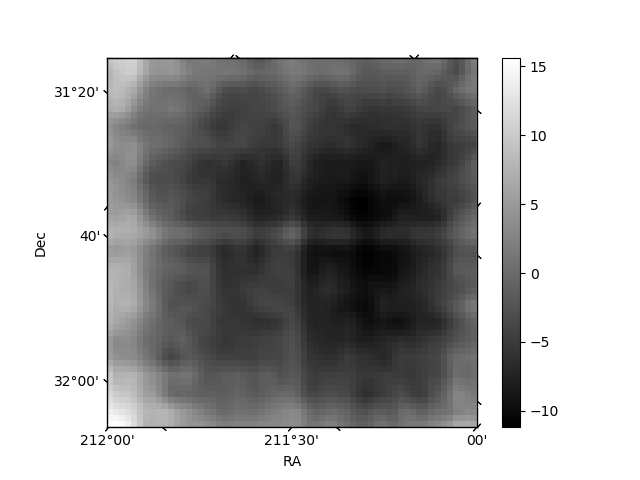
Quadrant B |
|---|---|---|---|
| Quadrant D | 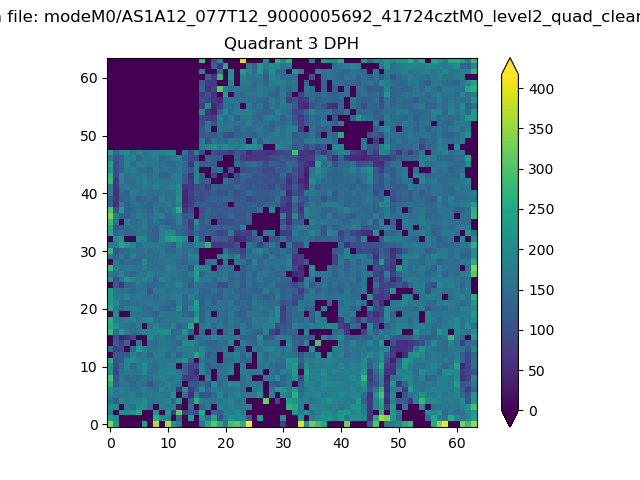 |
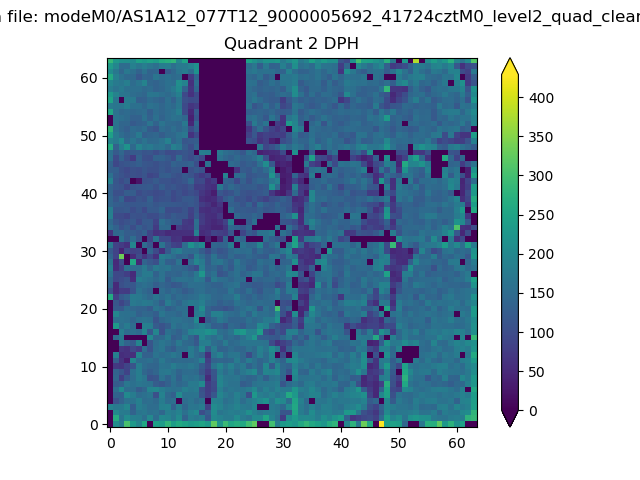 |
Quadrant C |
| Plot type | Count rate plots | Images |
|---|---|---|
| Comparison with Poisson distribution Blue bars denote a histogram of data divided into 1 sec bins. Red curve is a Poisson curve with rate = median count rate of data. |
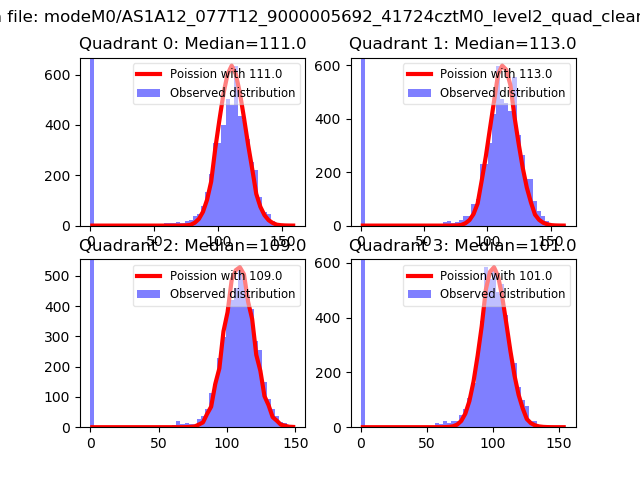 |
 |
| Quadrant-wise count rates Data is divided into 100 sec bins |
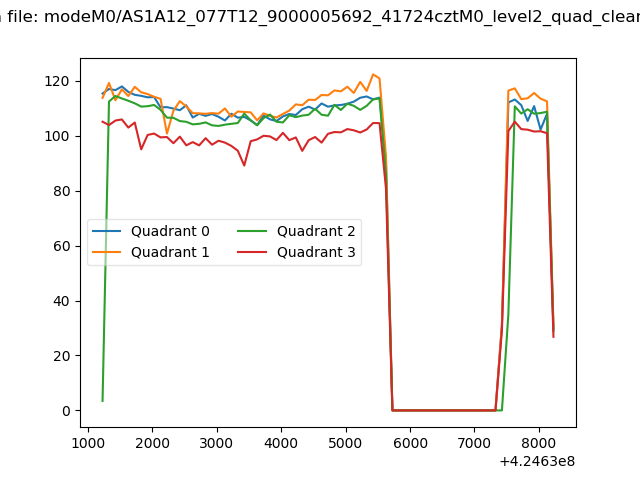 |
|
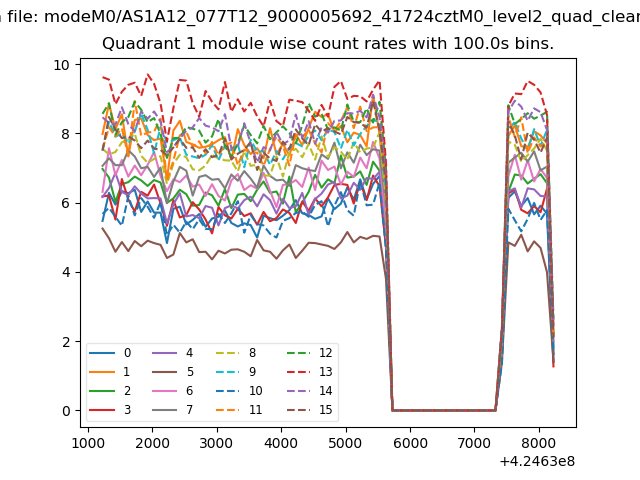
| Module-wise count rates for Quadrant A Data is divided into 100 sec bins |
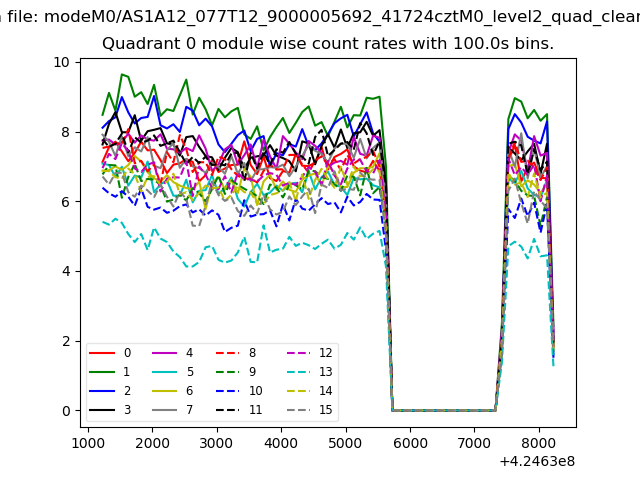 |
 |
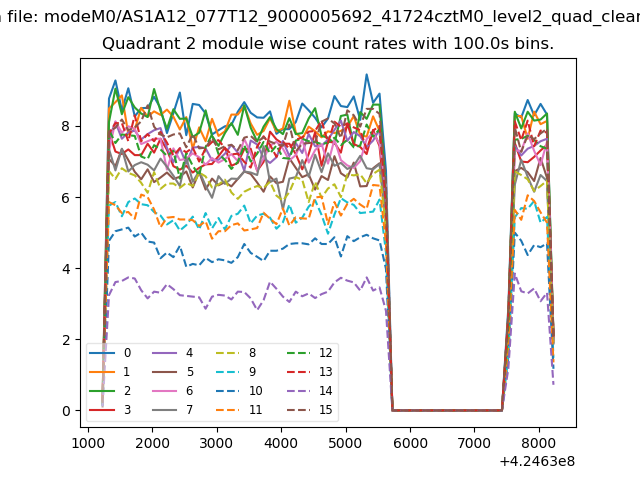
| Module-wise count rates for Quadrant B Data is divided into 100 sec bins |
 |
 |
| Module-wise count rates for Quadrant C Data is divided into 100 sec bins |
 |
 |
| Module-wise count rates for Quadrant D Data is divided into 100 sec bins |
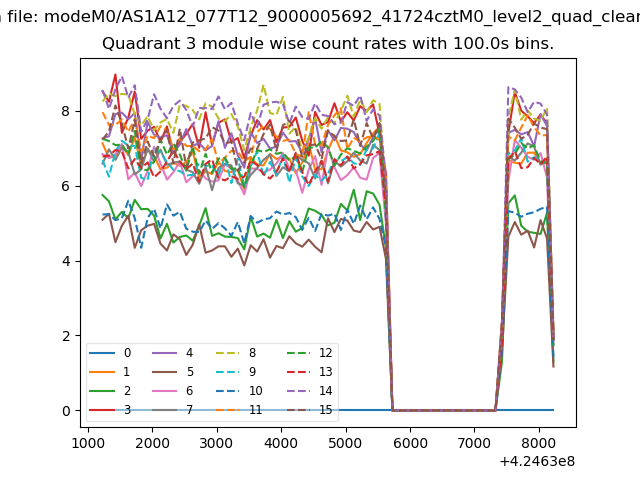 |
 |
| Parameter | Plot |
|---|---|
| CZT HV Monitor | 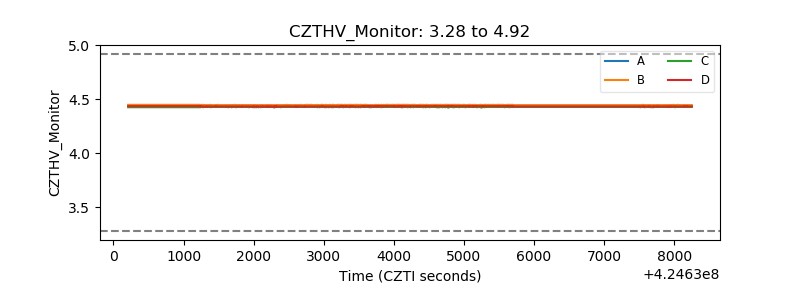 |
| D_VDD | 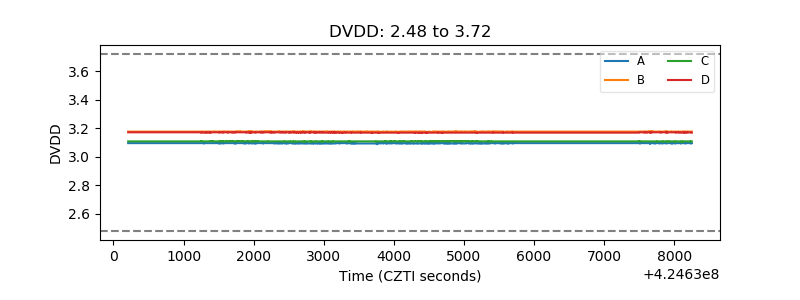 |
| Temperature 1 | 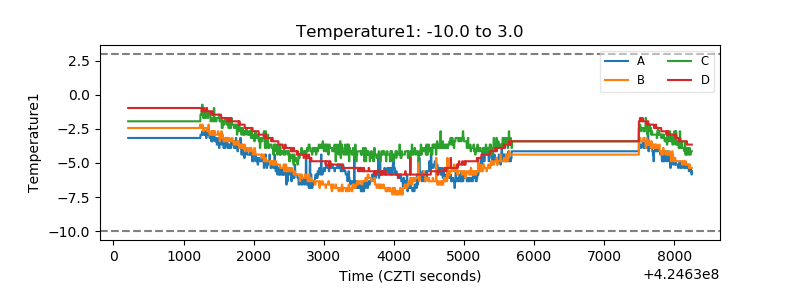 |
| Veto HV Monitor | 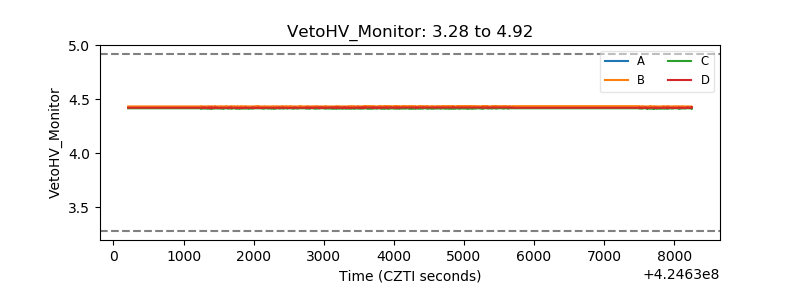 |
| Veto LLD | 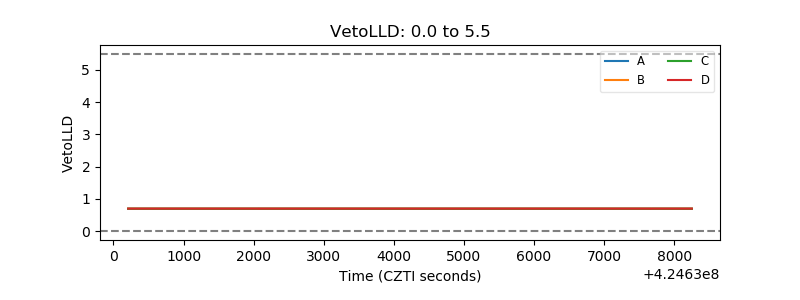 |
| Alpha Counter | 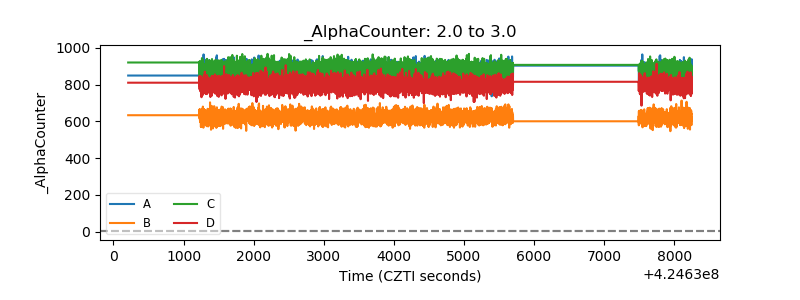 |
| _CPM_Rate | 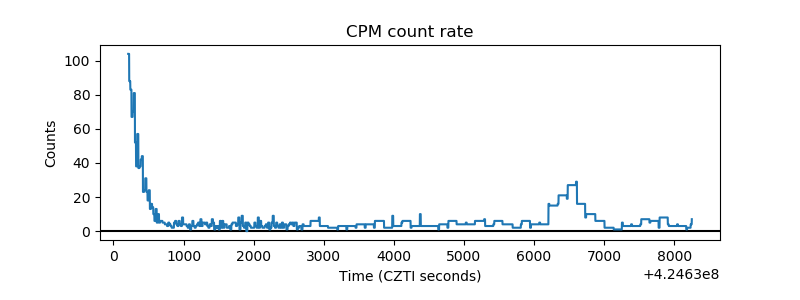 |
| CZT Counter | 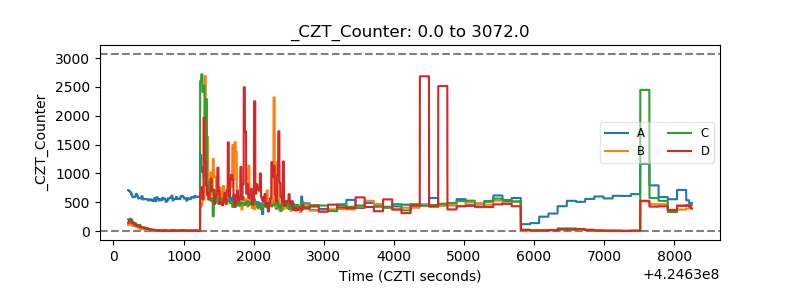 |
| +2.5 Volts monitor | 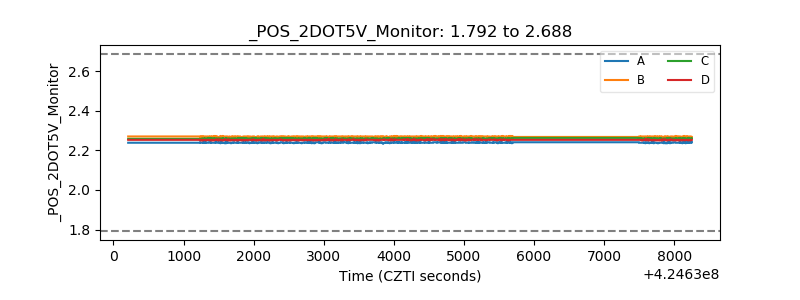 |
| +5 Volts monitor | 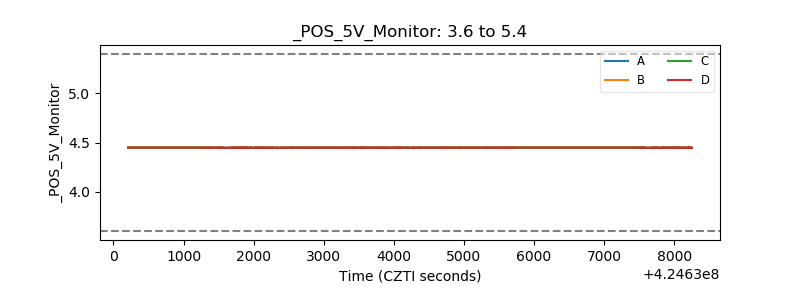 |
| _ROLL_ROT | 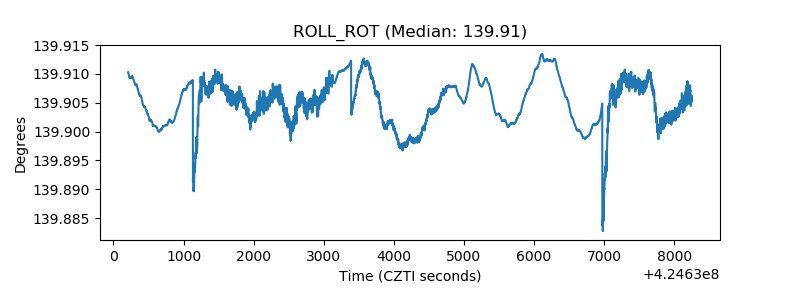 |
| _Roll_DEC | 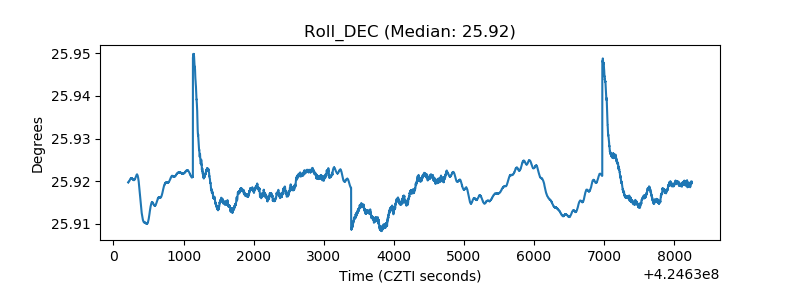 |
| _Roll_RA | 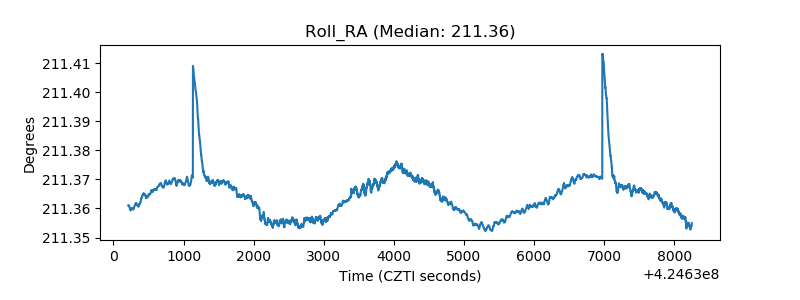 |
| Veto Counter | 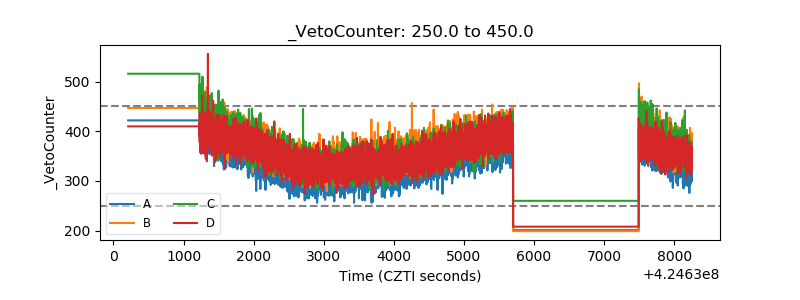 |