| Param | Original file | Final file |
|---|---|---|
| Filename | modeM0/AS1A12_077T12_9000005692_41725cztM0_level2.fits | modeM0/AS1A12_077T12_9000005692_41725cztM0_level2_quad_clean.evt |
| Size (bytes) | 80,648,640 | 20,707,200 |
| Size | 76.9 MB | 19.7 MB |
| Events in quadrant A | 978,112 | 138,277 |
| Events in quadrant B | 553,961 | 141,593 |
| Events in quadrant C | 816,880 | 125,282 |
| Events in quadrant D | 534,797 | 126,789 |
| Mode M9 | |||
|---|---|---|---|
| Quadrant | BADHDUFLAG | Total packets | Discarded packets |
| A | 0 | 7 | 0 |
| B | 0 | 8 | 0 |
| C | 0 | 8 | 0 |
| D | 0 | 8 | 0 |
| Mode M0 | |||
|---|---|---|---|
| Quadrant | BADHDUFLAG | Total packets | Discarded packets |
| A | 0 | 3756 | 1 |
| B | 0 | 2603 | 1 |
| C | 0 | 3266 | 1 |
| D | 0 | 2572 | 1 |
| Mode SS | |||
|---|---|---|---|
| Quadrant | BADHDUFLAG | Total packets | Discarded packets |
| A | 0 | 26 | 0 |
| B | 0 | 26 | 0 |
| C | 0 | 26 | 0 |
| D | 0 | 26 | 0 |
| Quadrant | Total seconds | Saturated seconds | Saturation percentage |
|---|---|---|---|
| A | 1267 | 40 | 3.157064% |
| B | 1267 | 5 | 0.394633% |
| C | 1267 | 101 | 7.971586% |
| D | 1267 | 5 | 0.394633% |
Noise dominated data is calculated using 1-second bins in cleaned event files. If a bin has >2000 counts, and if more than 50% of those come from <1% of pixels, then it is considered to be noise-dominated and hence unusable.
| Quadrant | # 1 sec bins | Bins with >0 counts | Bins with >2000 counts | High rate bins dominated by noise | Noise dominated (total time) | Noise dominated (detector-on time) | Marked lightcurve |
|---|---|---|---|---|---|---|---|
| A | 1267 | 1267 | 42 | 42 | 3.31% | 3.31% | 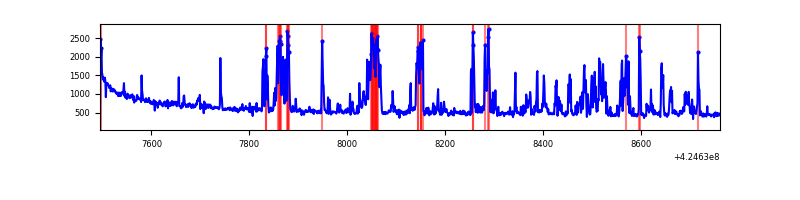 |
| B | 1267 | 1267 | 2 | 2 | 0.16% | 0.16% | 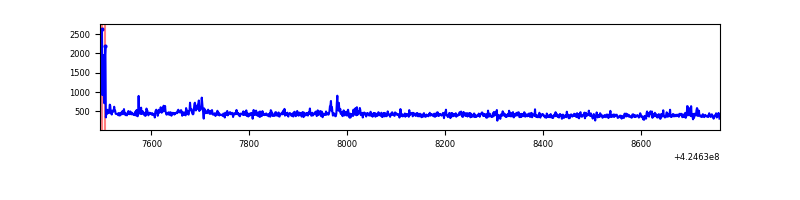 |
| C | 1267 | 1267 | 94 | 94 | 7.42% | 7.42% | 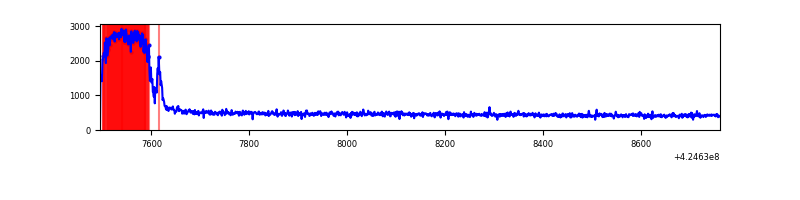 |
| D | 1267 | 1267 | 2 | 2 | 0.16% | 0.16% | 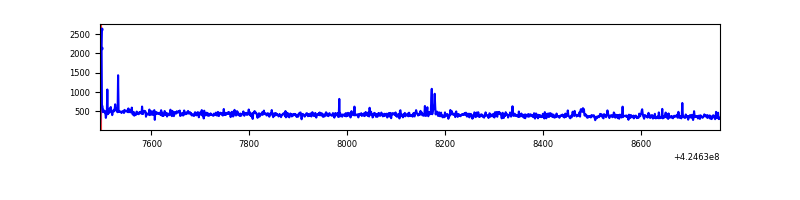 |
Top three noisy pixels from each quadrant. If the there are fewer than three noisy pixels in the level2.evt file, extra rows are filled as -1
| Pixel properties | Quadrant properties | ||||||
|---|---|---|---|---|---|---|---|
| Quadrant | DetID | PixID | Counts | Sigma | Mean | Median | Sigma |
| A | 2 | 79 | 248847 | 8431.02 | 132 | 129 | 29.5 |
| A | 10 | 83 | 183971 | 6231.86 | 132 | 129 | 29.5 |
| A | 7 | 3 | 26445 | 892.06 | 132 | 129 | 29.5 |
| B | 0 | 186 | 12975 | 458.12 | 133 | 129 | 28.0 |
| B | 4 | 141 | 12760 | 450.45 | 133 | 129 | 28.0 |
| B | 12 | 111 | 3172 | 108.52 | 133 | 129 | 28.0 |
| C | 0 | 10 | 272463 | 8722.76 | 124 | 125 | 31.2 |
| C | 15 | 214 | 52920 | 1690.98 | 124 | 125 | 31.2 |
| C | 14 | 67 | 2785 | 85.2 | 124 | 125 | 31.2 |
| D | 12 | 217 | 6510 | 187.43 | 133 | 129 | 34.0 |
| D | 2 | 234 | 5702 | 163.69 | 133 | 129 | 34.0 |
| D | 10 | 199 | 4544 | 129.68 | 133 | 129 | 34.0 |
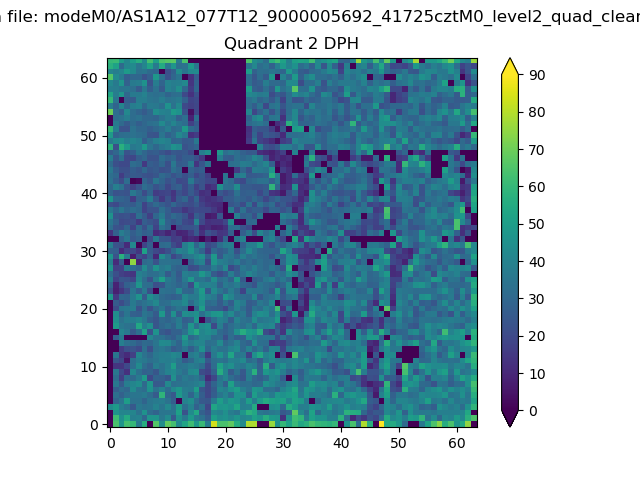
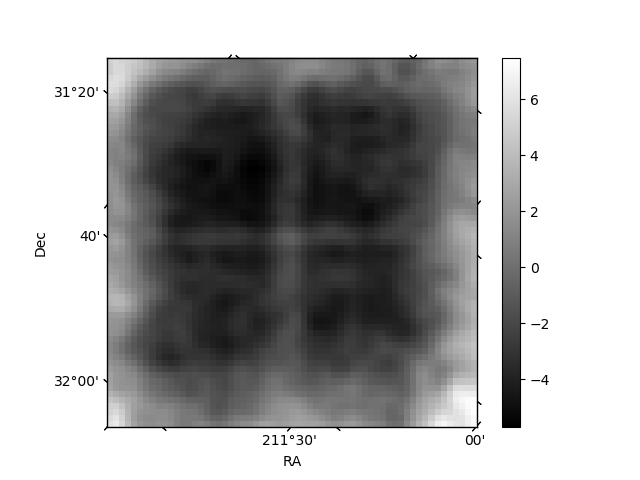
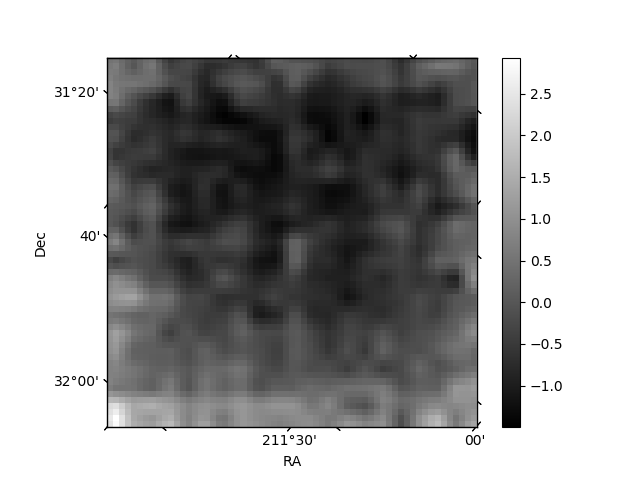
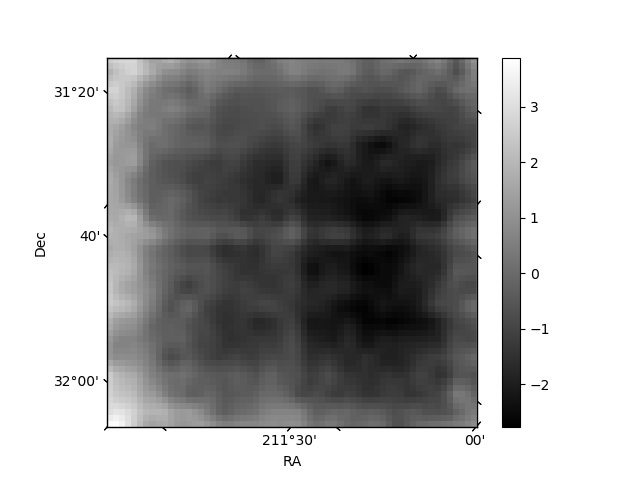
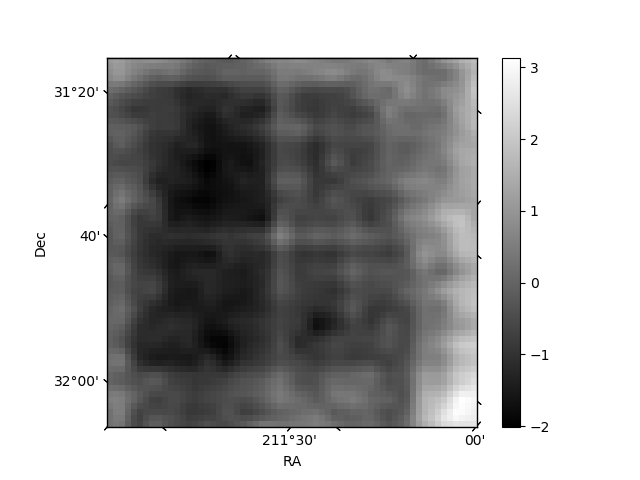
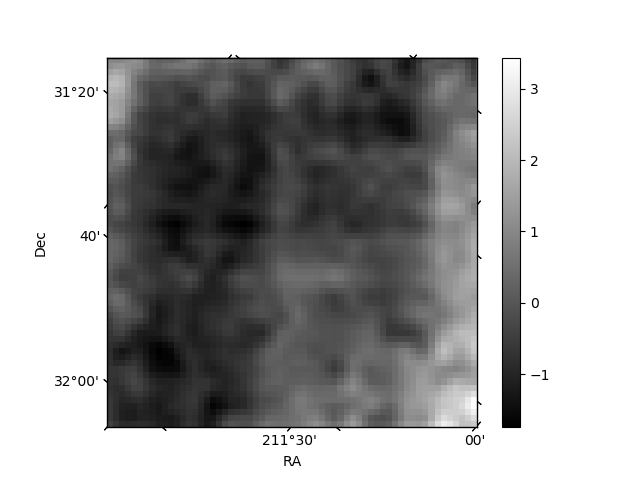
Histogram calculated using DETX and DETY for each event in the final _common_clean file
| Quadrant A | 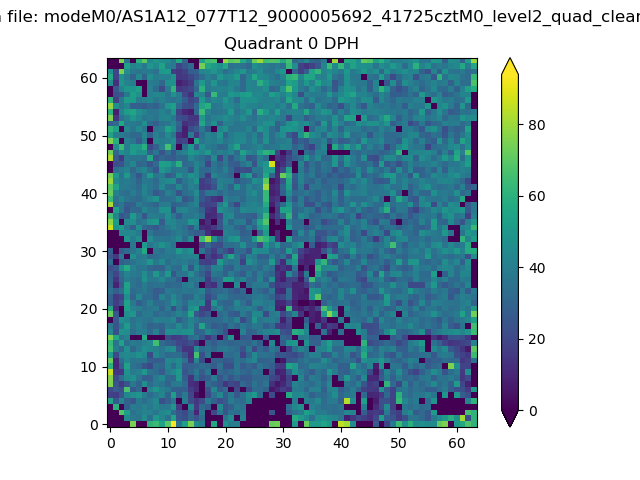 |
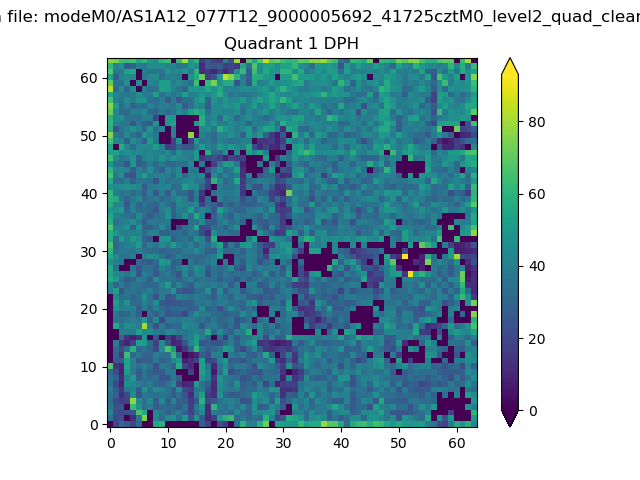 |
Quadrant B |
|---|---|---|---|
| Quadrant D | 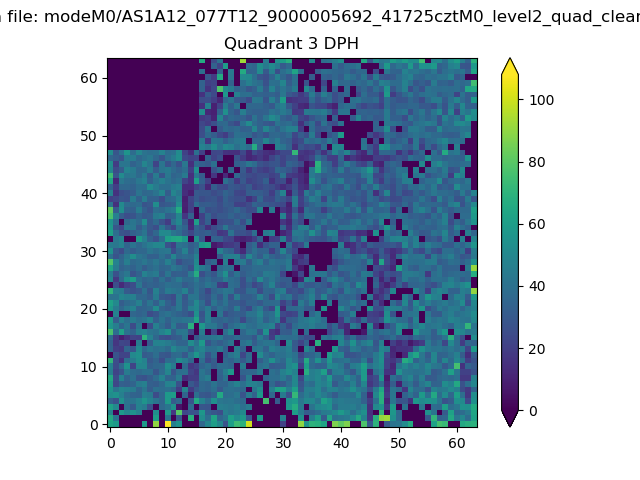 |
 |
Quadrant C |
| Plot type | Count rate plots | Images |
|---|---|---|
| Comparison with Poisson distribution Blue bars denote a histogram of data divided into 1 sec bins. Red curve is a Poisson curve with rate = median count rate of data. |
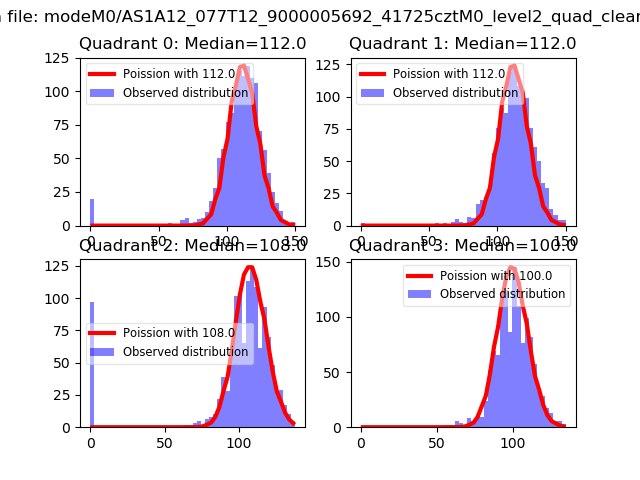 |
 |
| Quadrant-wise count rates Data is divided into 100 sec bins |
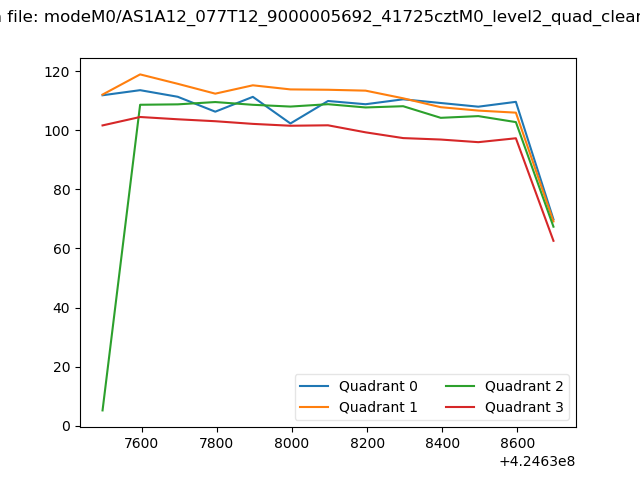 |
|
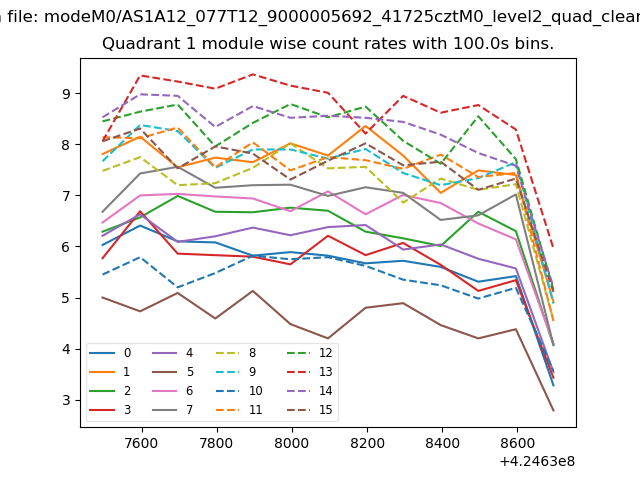
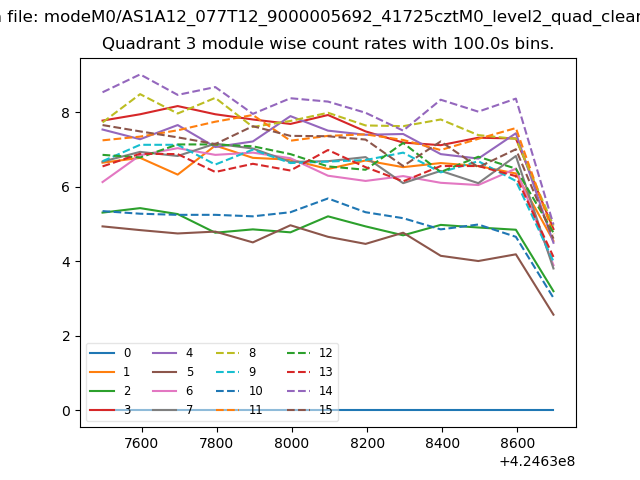
| Module-wise count rates for Quadrant A Data is divided into 100 sec bins |
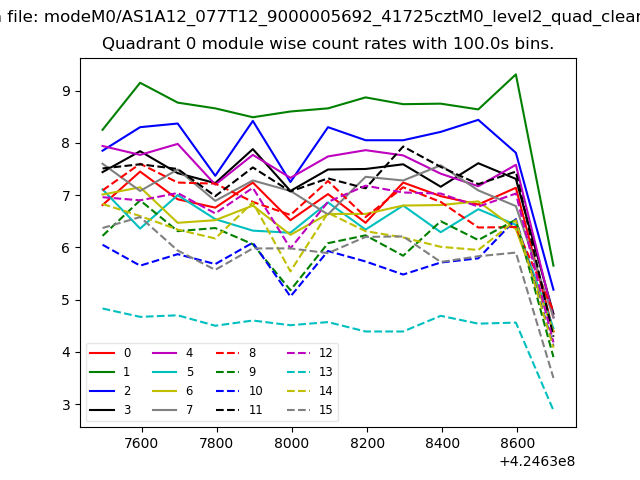 |
 |
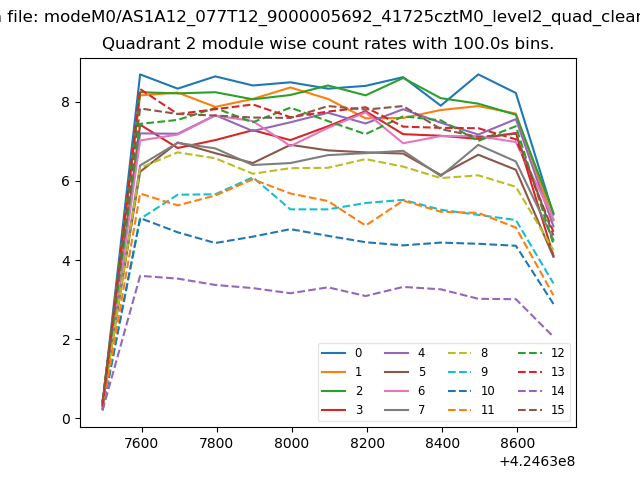
| Module-wise count rates for Quadrant B Data is divided into 100 sec bins |
 |
 |
| Module-wise count rates for Quadrant C Data is divided into 100 sec bins |
 |
 |
| Module-wise count rates for Quadrant D Data is divided into 100 sec bins |
 |
 |
| Parameter | Plot |
|---|---|
| CZT HV Monitor | 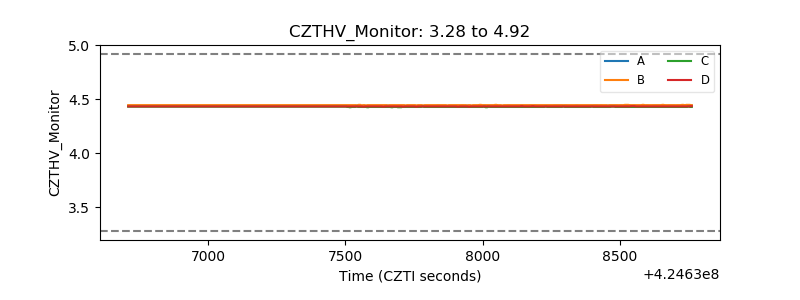 |
| D_VDD | 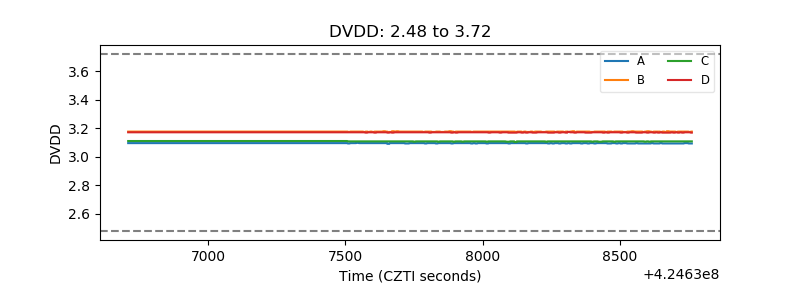 |
| Temperature 1 | 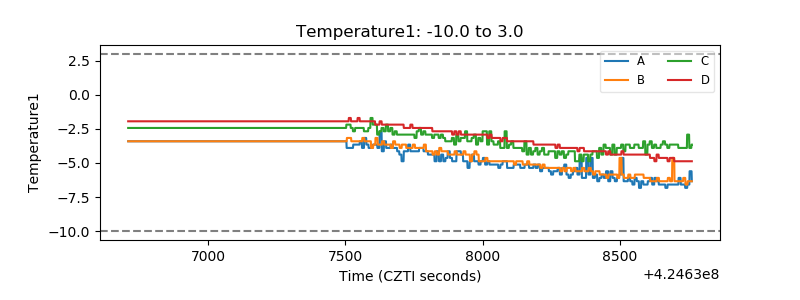 |
| Veto HV Monitor | 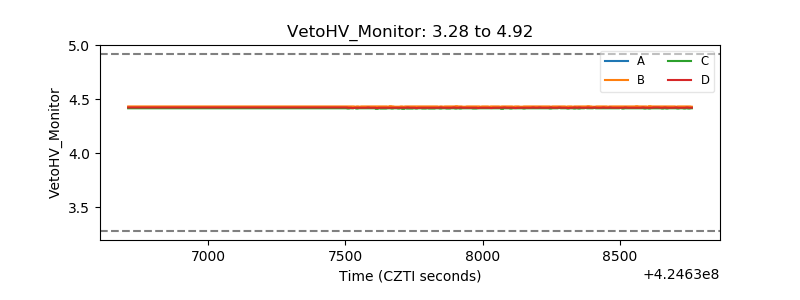 |
| Veto LLD | 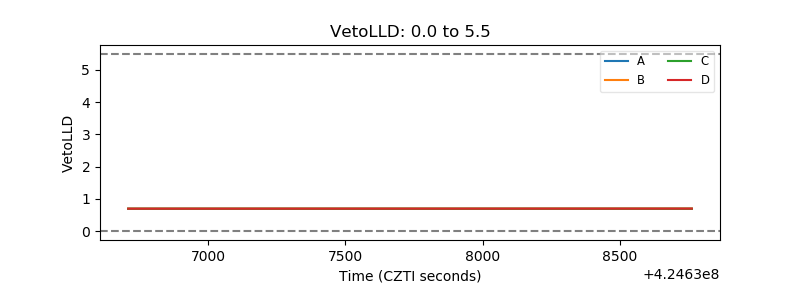 |
| Alpha Counter | 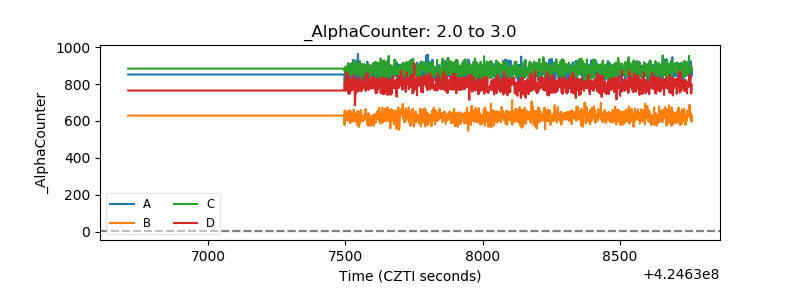 |
| _CPM_Rate | 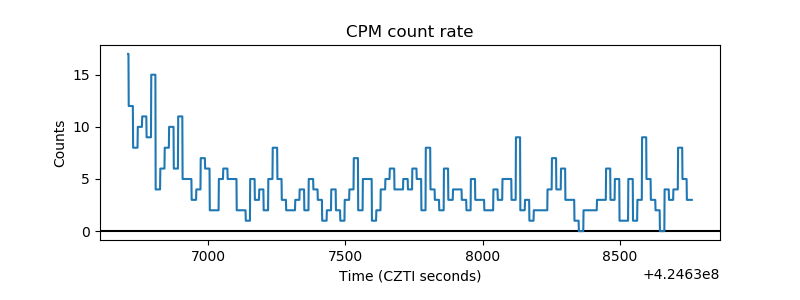 |
| CZT Counter | 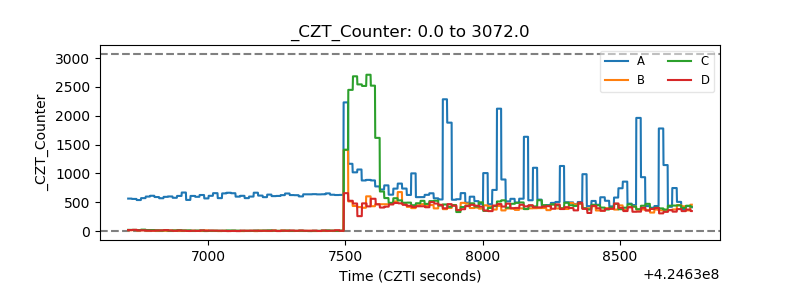 |
| +2.5 Volts monitor | 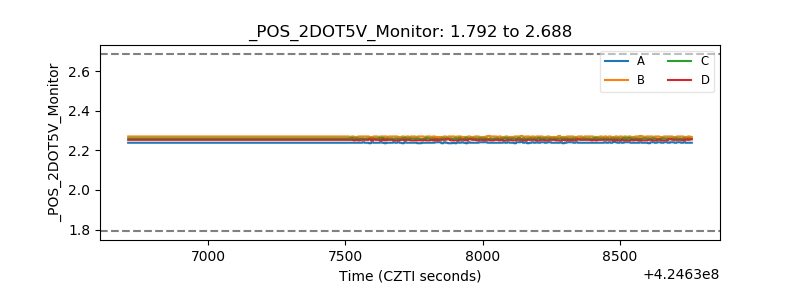 |
| +5 Volts monitor | 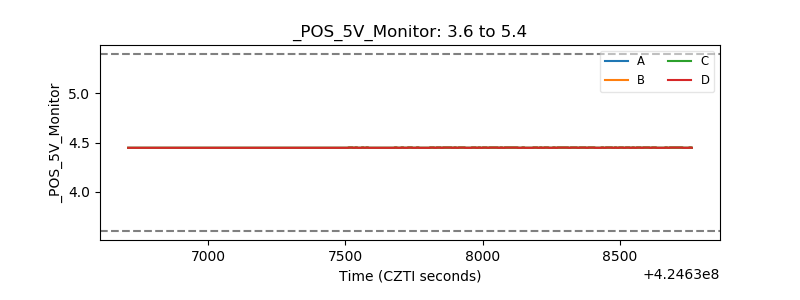 |
| _ROLL_ROT | 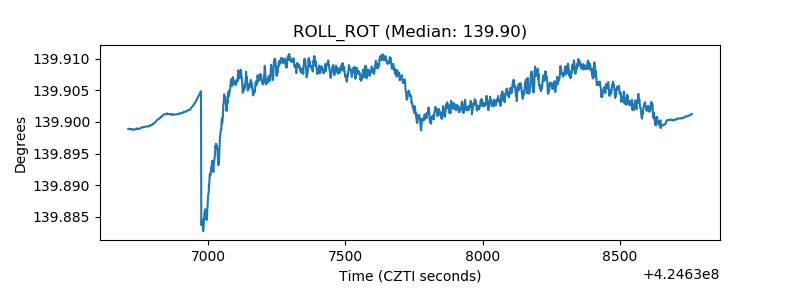 |
| _Roll_DEC | 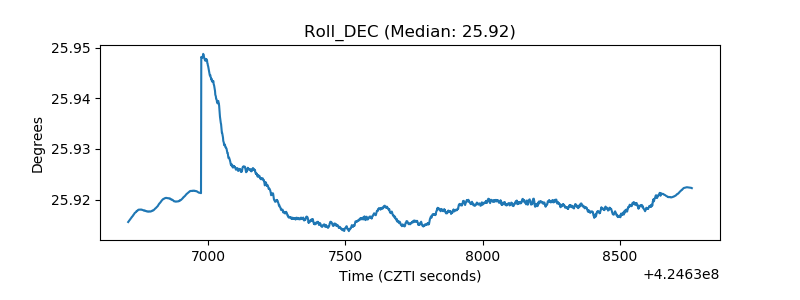 |
| _Roll_RA | 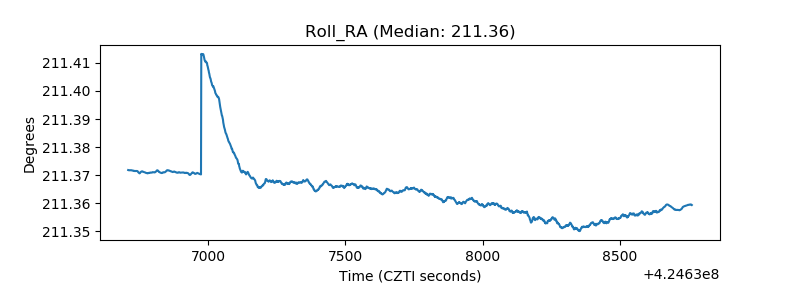 |
| Veto Counter | 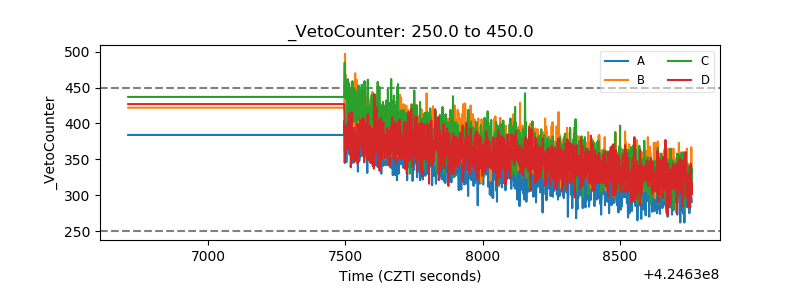 |